 GAP_
Good
Agricultural Practices;
GAP_
Good
Agricultural Practices;  OAE_
Office Agricultural Economics; RAOT_ Rubber Authority of Thailand.
OAE_
Office Agricultural Economics; RAOT_ Rubber Authority of Thailand.Australian Journal of Crop Science
Article | https://doi.org/10.21475/ajcs.26.20.09.pne242
Submitted: 14 December 2025 | Revised: 03 August 2026 | Accepted: 06 August 2026
Pages 738-748
Clustering rubber farmers’ risk perceptions in Thailand using K-means and fuzzy C-means approaches
Onanong Longpichai1,2, Arisara Romyen1,2, Ferdoushi Ahmed1,2*, Pimpawee Suwannarat1,2
1Department of Agricultural Economics and Agribusiness, Faculty of Economics, Prince of Songkla University (PSU), Hat Yai, 90110, Songkhla, Thailand
2Future Economy and Southern Economic Development Research Center, Thailand
*Corresponding author: ferdoushi.a@psu.ac.th
Abstract: This study aims to identify and classify risk perceptions in rubber farming in Thailand, focusing on their characteristics through cluster analysis. Three provinces in the southern region - Surat Thani, Songkhla, and Trang were chosen. These provinces were selected for their diverse rubber plantation farming systems and their representation of agricultural and social transitions, including rural development and increasing urbanization. Primary data was collected from a total of 674 randomly selected rubber farmer respondents using a standardized and structured questionnaire. Both K-means and Fuzzy C-Means clustering algorithms were utilized, alongside cluster validation via the Within-Cluster Sum of Squares method and the Gap Statistic compares within-cluster dispersion. The study categorized rubber production risks into two groups: internal and external. Internal risks include production, labor/contracts, finance, and farmer risks, while land tenure/lease, market, climate and natural disasters, price, and policy/institutional risks are external. The analyses revealed that for internal risks, farmers perceptions, production risks as the highest, while price risk was the highest among external risks. For specifying the optimal clusters, Cluster 1 (South = 2.261, North-East = 0.412), which is the lowest perceived risk, consists of labor/contract, market, and policy/institutional risks. Financial and farmer risks are grouped in cluster 2 (South = 2.695, North-East = 1.086) with a moderate level of perceived risk. The high-risk perception (south = 3.021, north-east = 1.815) indicate that farmers in both regions perceive when production (R1) and prices (R5) interact, these vigorously impact on rubber production. The study suggests several recommendations including promoting good agricultural practices, establishing a nationwide rubber auction system, and promoting rubber plantation insurance through integration between rubber farmers and related organizations for better management of the risks associated with rubber farming in Thailand.
Keywords: Clustering algorithms, Risks perception, Rubber Farmer, Thailand.
Abbreviations: FAO_ Food and Agricultural
organization;
Introduction
Risk and uncertainty are distinct concepts that significantly impact the agricultural sector (Solomon and Ruiz, 2012). Traditionally, risk is associated with known probabilities, while uncertainty pertains to unknown probabilities (Knight, 1921; Osiemo et al., 2021). The crucial distinction lies in the consequences involved: uncertainty represents incomplete knowledge, and risk denotes uncertain outcomes. Consequently, a scenario without consequences implies no risk (Hardaker et al., 2003). However, Siegel (2005) notes that the terms "risk" and "uncertainty" are often used interchangeably, particularly in discussions about potential losses. Risks involve the adverse effects of hazards and their occurrence frequency, both of which contribute to uncertainty and complicate risk management for farmers (Huet et al., 2020). Hazards can stem from various sources, including biophysical factors and issues related to marketing, finance, legal matters, and human resources (Baquet et al., 1997; Huet et al., 2020). In lower-income countries, these elements of risk and uncertainty are closely tied to the vulnerability of farming households, particularly regarding poverty (Riwthong et al., 2017).
Agricultural businesses and farmers face heightened risks compared to other sectors due to their reliance on natural processes, biological assets, and the threat of plant and animal diseases. Agriculture is particularly susceptible to adverse natural events, such as pest infestations and unfavorable weather, which can adversely affect production. Climate change is expected to exacerbate the economic impacts of significant climatic disasters in the future (Laura Girdžiūtė, 2012). Key risks in agriculture include climate variability, market fluctuations, pests, diseases, and extreme weather events. These risks lead to direct economic losses for farmers, which can ripple through the entire value chain, ultimately impacting agricultural growth and rural livelihoods (FAO, 2018). Given that farming is a primary source of income for rural households, it is essential for these growers to identify and mitigate risks to ensure production (Drollette, 2009). The multifaceted nature of risks in agriculture complicates the farming process (Muhammad et al., 2019). Farmers face a growing array of production, market, financial, and institutional risks (Meraner and Finger, 2018). Significant sources of risk include market and price fluctuations, production challenges, financial uncertainties, and institutional/legal risks (OECD, 2013). Additionally, risks can be categorized into five types: production, market, financial, institutional, and personal (Komarek et al., 2020). Previous research has identified various risk types, including marketing, production, environmental, legal, human capital, and financial risks (Musser and Patrick, 2002). The management of farm-level risks can vary based on the nature of the crop (Muhammad et al., 2019). This is particularly relevant for rubber plantations in Thailand, which are crucial to the country’s economy and societal development. Rubber serves as a vital source of income, foreign currency, and employment for rubber farmers and associated industries. Over 1.60 million farming households depend on rubber production for their livelihoods. As of 2023, Thailand had a total rubber plantation area of 24 million rai, with over 22.08 million rai available for tapping. The total production volume exceeded 5.14 million tons, generating export revenue of over 342,675.94 million baht (Office of Agricultural Economics, 2023). Rubber production reached 5,146,000 tons, with exports totalling 3,998,041 tons, domestic use at 1,234,413 tons, stock at 875,504 tons, and imports at 1,290 tons (Rubber Division, 2023).
Investing in rubber plantations demands significant capital and yields returns over the long term. Rubber trees begin to produce after 5-7 years and can remain productive for over 25 years. Once farmers commit to a particular rubber variety, they cannot change it until the replacement planting period, necessitating the management of inherent risks and uncertainties (Kongmanee et al., 2023). The evolving economic and social landscape, coupled with complex interrelations among ecosystem and socio-economic systems at local, regional, national, and global levels, creates additional risks and uncertainties that threaten the viability and sustainability of rubber farming households. However, a cursory attention has been paid to the various risks associated with the rubber plantation in Thailand. Therefore, the present study aims to identify and classify the risks the rubber farmers perceive in their farming activities in Thailand. This research focuses on rubber production in southern and northeastern Thailand, where the southern region contains the largest rubber plantation area, comprising 56.86% of the nation’s total tapping area (Office of Agricultural Economics, 2023). The southern region of Thailand was the original rubber planting area, while the northeastern region was the rubber planting area that was later promoted. Therefore, it is interesting to see how the risk perception of farmers in the two areas is similar or different.
From the viewpoint of designing and implementing policies for rubber farmers, it is equally and needful to understand risk perception of rubber farmers. Categorization of risk sources often varies according to the specific objectives of different studies. This study provides efforts to evaluate comprehensively the characteristics of each risk using cluster analysis to categorize the Thai rubber farmers into relatively homogeneous segments based on their risk perceptions regarding rubber production and to characterize and compare these segments. The study findings might aid in the development of targeted risk management strategies for rubber farmers in Thailand.
Results
Identifying the sources of perceived risks by rubber farmers
Rubber farmers’ perception of risks plays a pivotal role in how they manage their farms and livelihoods. A well-informed perception of risks helps farmers prepare, adapt, and innovate in the face of uncertainty, leading to more resilient and sustainable farming practices. On the other hand, poor or misinformed perceptions of risk can lead to increased vulnerability and potential losses, especially in a sector as sensitive to external factors as rubber farming. Therefore, improving farmers' awareness and understanding of risks is essential for strengthening their ability to thrive in challenging conditions. The perception of risks is critically important for rubber farmers because it directly influences their decision-making, resource allocation, and long-term sustainability. This perception can either protect their livelihoods or expose them to greater vulnerability if risks are underestimated or misunderstood.
In this study, the relevant risk items of production (R1), land/tenancy rights (R2), labor/contracts (R3), markets (R4), prices (R5), finance (R6), climate and natural disasters (R7), policies/institutions (R8) and farmers (R9) can be categorized into internal and external risks as shown in Figure 1 and 2. When considering separation by region Farmers in the original rubber planting areas in the South were more aware of all aspects of risk than farmers in the Northeast, where rubber cultivation was later promoted.
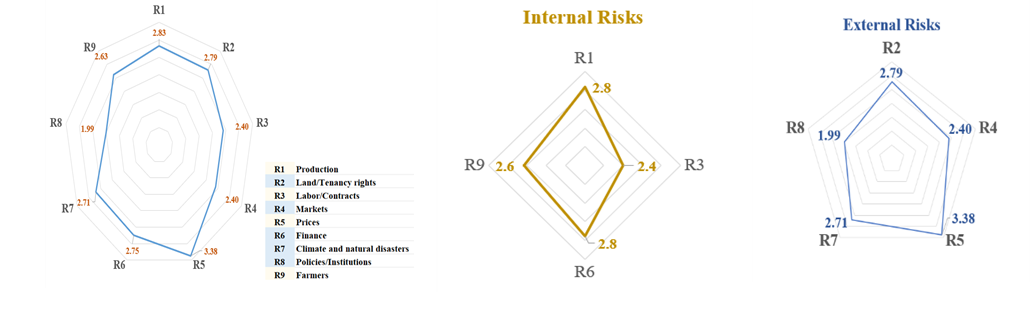 Figure 1.
Risk perception levels of rubber farmers for the Southern Thailand.
Figure 1.
Risk perception levels of rubber farmers for the Southern Thailand.
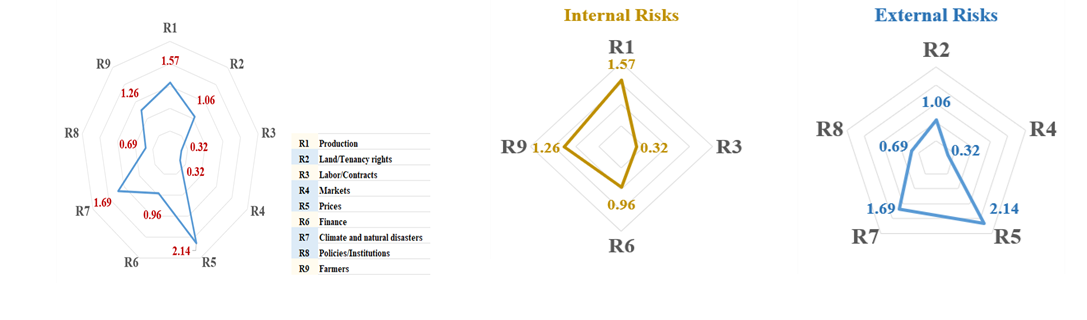 Figure 2.
Risk perception levels of rubber farmers for the North - Eastern
Thailand.
Figure 2.
Risk perception levels of rubber farmers for the North - Eastern
Thailand.
Clustering method using the quantitative methods of the K-means clustering and the Fuzzy C-Means clustering
The K-means clustering is a partitional clustering algorithm that divides a dataset into Clusters (k) distinct, non-overlapping clusters. The algorithm iteratively assigns data points to clusters based on the distance from the centroids (mean position of data points in each cluster). For number of clusters (k), the user needs to define the number of clusters (k). Moreover, more various methods, like the Elbow Method or Silhouette Score, can help determine the optimal value of k. The Centroids are the mean values of the points in a cluster and represent the center of each cluster. The Euclidean Distance is usually relied on the distance between points and centroids is measured using Euclidean distance. Initially, k initial cluster centroids are randomly selected from the data points and each data point is assigned to the nearest centroid, forming k clusters. The centroids of the clusters then are recalculated as the meaning of the points within each cluster. After that, the relevant calculation steps are repeated until the centroids no longer change (convergence) or a maximum number of iterations is reached. The results of the study are separated by region as follows:
The optimal number of clusters for analyzing risk perception among rubber farmers in Southern Thailand
To determine the optimal number of clusters for K-means clustering, the function visualizes different metrics for determining the optimal number of clusters. The method of Within-Cluster Sum of Squares (WCSS) is being used to assess how the clusters fit. This helps to identify the Elbow point, where adding more clusters does not significantly improve the clustering.
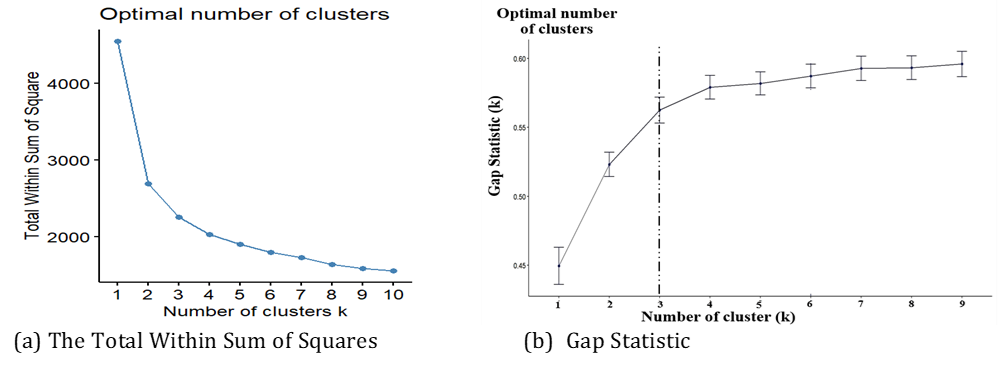
Figure 3. Clustering selections for Southern Thailand.
From all the samples studied, the analysis results suggest that the K-means clustering is proper with 3 clusters of its centroid as the central data point around with sizes 174, 117, 124. The Within-Cluster Sum of Squares (WCSS) is a measure of the total variance within a cluster. It quantifies how tightly the data points in a cluster are grouped around the centroid. The WCSS are 492.17, 674.7, and 8984.28 as shown in Figure 4. Consistently, the FCM clustering is a clustering algorithm in which each data point can belong to more than one cluster, with a degree of membership, rather than being assigned to exactly one cluster. The algorithm minimizes an objective function that is a weighted sum of squared distances between each data point and the cluster centers. After computing the membership grades for all data points, the centroids are recalculated as weighted averages of the data points, where the weights are the membership grades. The algorithm iterates between recalculating cluster centroids and updating membership values until the change in the objective function or the centroids becomes smaller than a threshold as shown in Figure 5 and 6.
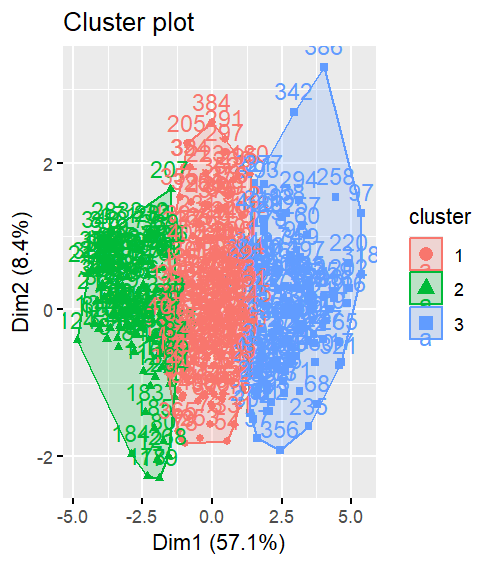
Figure 4. Within -Cluster Sum of Squares criteria for the Southern Thailand.
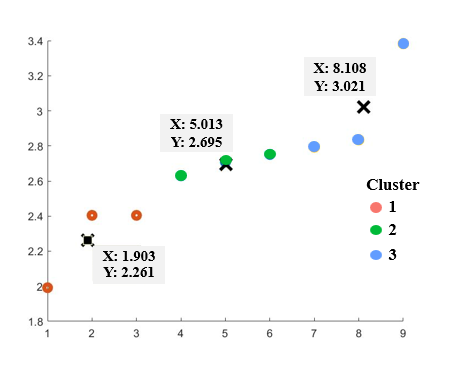
Figure 5. Fuzzy C-Means (FCM) clustering for the Southern Thailand.
| Cluster1 | 2.261 | R3 | R4 | R8 |
|---|---|---|---|---|
| Labor/Contracts | Markets | Policies/Institutions | ||
| Cluster2 | 2.695 | R9 | R7 | R6 |
| Farmers | Climate and natural disasters | Finance | ||
| Cluster3 | 3.021 | R2 | R1 | R5 |
| Land/Tenancy rights | Production | Prices |
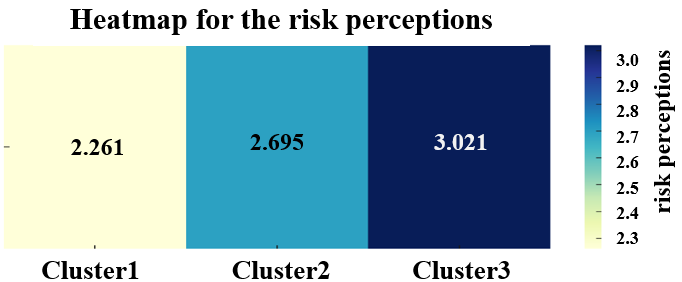
Figure 6. Heatmap of the risk perceptions for the Southern Thailand.
The optimal number of clusters for analyzing risk perception among rubber farmers in North-Eastern Thailand
To determine the optimal number of clusters for K-means clustering, the function uses various metrics to guide the selection process. Specifically, the WCSS method is applied here to evaluate how well the data points fit within each cluster. This approach helps locate the “Elbow” point, where adding more clusters no longer significantly improves the clustering outcome. Typically, this Elbow point where the WCSS curve shows a distinct “bend” indicates the optimal cluster number. In this case, an elbow appears between 2-3 clusters.
Additionally, the Gap Statistic is used to compare the dispersion within clusters across different values of (k) against what would be expected in a random distribution. This method provides a statistical framework that addresses some limitations of other validation methods, such as the Elbow Method or Silhouette Score. A noticeable “kink” in the Gap Statistic plot suggests that (k = 3) offers a robust clustering solution (Figure 7).
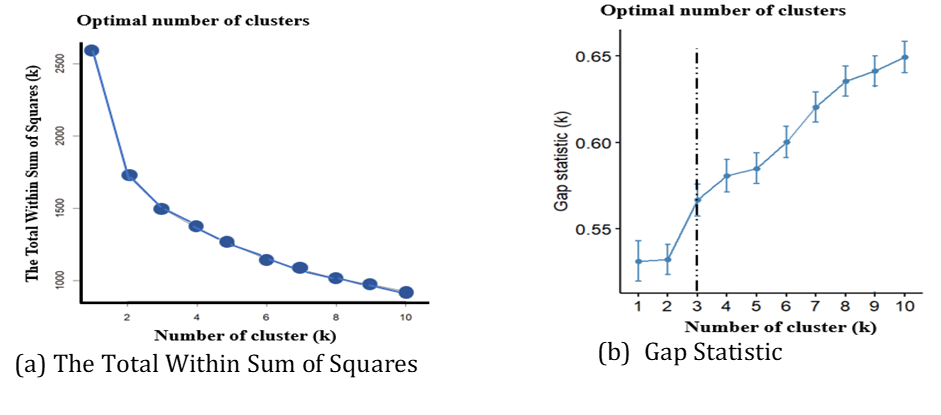
Figure 7. Clustering selections for North - Eastern Thailand.
From all the samples studied, the analysis results indicate that K-means clustering is most suitable with 3 clusters, each with a central data point as its centroid. The cluster sizes are 130, 93, and 36, respectively. The Within-Cluster Sum of Squares (WCSS) measures the total variance within each cluster, reflecting how tightly the data points are grouped around the centroid. The WCSS values for the three clusters are 429.5507, 557.8668, and 501.2801, as shown in Figure 8.
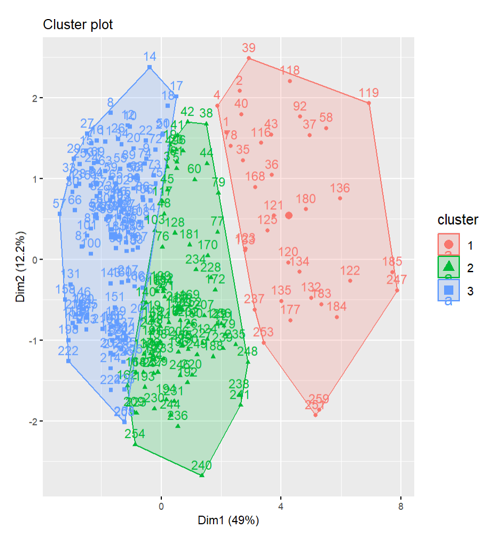
Figure 8. The WCSS criteria for the North - Eastern Thailand.
Consistently, the FCM clustering algorithm allows each data point to belong to multiple clusters with a degree of membership, rather than assigning each point to a single cluster. The algorithm works by minimizing an objective function, which is the weighted sum of squared distances between each data point and the cluster centers. Once the membership grades are computed for all data points, the centroids are updated as weighted averages, with the weights corresponding to the membership grades. This process iterates, recalculating the cluster centroids and updating membership values until the change in the objective function or centroids becomes smaller than a specified threshold, as shown in Figures 9 and 10.
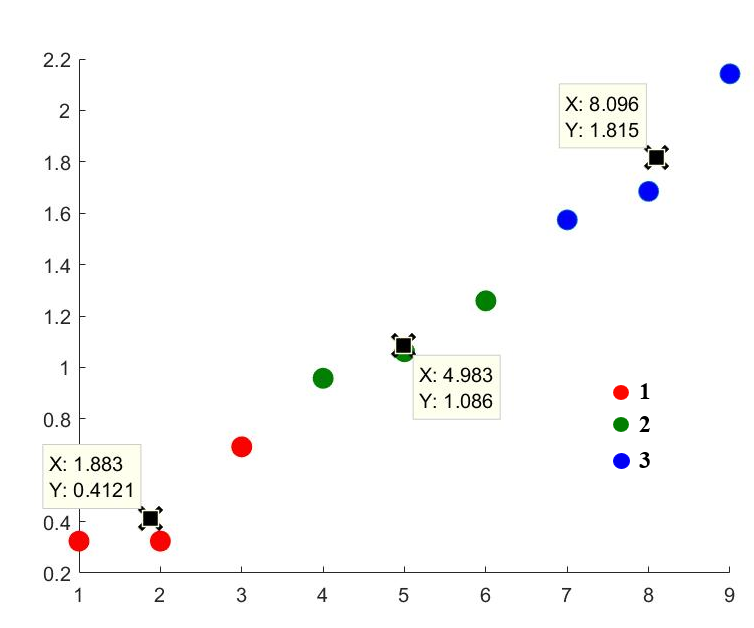
Figure 9. The Fuzzy C-Means (FCM) clustering for the North-Eastern Thailand.
| Cluster1 | 0.412 | R3 | R4 | R8 |
|---|---|---|---|---|
| Labor/Contracts | Markets | Policies/Institutions | ||
| Cluster2 | 1.086 | R6 | R2 | R9 |
| Finance | Land/Tenancy rights | Farmers | ||
| Cluster3 | 1.815 | R1 | R7 | R5 |
| Production | Climate and natural disasters | Prices |
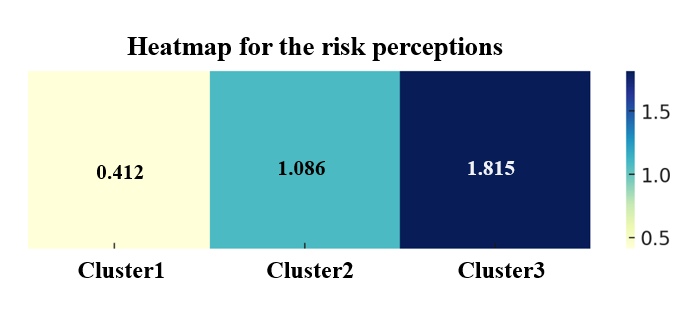
Figure 10. Heatmap of the risk perceptions for the North-Eastern Thailand.
The results of the risk perception clustering’s of rubber plantation farmers in both regions were largely consistent. The details are as follows:
Cluster 1: The variables of labor/contracts (R3), markets (R4), and policies/institutions (R8) influence only a slight awareness of potential challenges. Cluster 1 (south = 2.261, north-east = 0.412) has the lowest risk perception among the three. This indicates that the internal and external risks associated with this cluster are relatively manageable, suggesting that farmers may feel secure in their labor contracts, market access, and institutional policies. In conclusion, these factors pose only minor risks to rubber farmers, who manage their concerns related to labor, markets, and policies effectively without significant impact on their daily operations or long-term planning.
Cluster 2: The moderate risk perception (south = 2.695, north-east = 1.086) suggests that farmers in both regions recognize challenges related to finance (R6), and farmers (R9). However, in this cluster there are differences between the South and the Northeast. Another risk category that is in the moderate risk perception for the Southern region is climate and natural disasters (R7) and for the North-eastern region namely land/tenancy rights (R2). Moderate climate and natural disasters (R7) perception for Southern region because most farmers can cope with moderate weather variability, even though there remains a persistent risk from extreme events. In conclusion, while these factors contribute to a moderate risk perception for rubber farmers, they do not pose overwhelmingly critical threats.
Cluster 3: The high-risk perception (south = 3.021, north-east = 1.815) indicate that farmers in both regions perceive when production (R1) and prices (R5) interact, these vigorously impact on rubber production. The low production, often caused by poor land management or input shortages, combined with volatile prices, increases the likelihood of financial losses for farmers. Land/tenancy rights (R2): farmers in Southern region experience uncertainties related to land ownership, which can impact their long-term planning and investment decisions. This contributes to a high-risk perception regarding land security. Rubber farmers in the North-eastern region recognize climate and natural disasters (R7) is high risk. Growing awareness of climate change and its risks leads farmers to worry about extreme weather events like droughts and floods. This understanding emphasizes the potential for climate variability to disrupt farming practices and overall production stability.
Discussions
The present study focused that Internal risks are risks that originate from within a farm or system. They are typically within the control or influence of the farm and can be managed through internal processes and decision-making. These risks arise from the farm's internal operations, management, or structure. In this study, the rubber farmers have four types of risk of: production risks associated with inefficiencies in production processes, equipment failures, or lack of input materials, labor/labor contract risks related to internal labor disputes, contract non-fulfillment, labor shortages, inadequate worker training, or high turnover, finance risks related to mismanagement of funds, poor cash flow, over-leverage, or lack of capital for operations, and farmers risks stemming from individual farmer productivity, inadequate knowledge or skills, non-compliance with contracts, or internal decision-making. As for internal risk, which farmers perceive as the highest risk in both Southern and Northeastern regions, production risk is equal to 2.83 and 1.57, respectively. Previous studies reported that risk normally plays an important role in decision-making of an individual (Kasper, 1980; Sitkin and Weingart, 1995). Shi Min et al. (2017) demonstrated that risk perceptions play an important role in smallholders’ decision-making regarding land use strategies to address potential risks in rubber farming. The farmers with higher risk perceptions in rubber farming are more likely to diversify their land use, thereby contributing to local environmental conservation in terms of agrobiodiversity. The land use choices of smallholder rubber farmers are also associated with ethnicity, household wealth, off-farm employment, land tenure status, altitude and rubber farming experience. Similarly, Imelda et al., (2023) attempted to specify the risk perception, risk attitude and determinant factors for smallholder rubber farmers in West Kalimantan, Indonesia. The researchers revealed that most of the rubber farmers were risk-averse and perceived climate change, plant diseases and price change as high risks. It was also found that farmers’ age, education, rubber plantation size, rubber age, distance and use of rubber clones had a positive and significant effect on farmers’ risk perception, while the family size and farming experience had a negative effect.
In line with previous studies, Tran (2020) aimed to assess the economic efficiency of smallholders’ rubber production in the context of risk perception in Vietnam. The study reported that risk from strong storms has the greatest impact that can reduce profits by 100% and, on average, reduce profits by 26.8%. Other risks have lower impacts; but there are some with more significant impacts such as the risk of falling product prices, rising interest rates or risks due to unsecured farming techniques. In addition, risk perceptions also can be regarded as a prerequisite for choosing an effective risk-coping strategy because a farmer who is not clearly aware of the risks that he or she faces is unable to manage them effectively (Sulewski and Kłoczko-Gajewska, 2014).
The study Imeldal et al. (2023) found that most rubber farmers were risk-averse and perceived climate change, plant diseases and price change as high risks. The logit model found that farmers’ age, education, rubber plantation size, rubber age, distance and use of rubber clones had a positive and significant effect on farmers’ risk perception, while the family size and farming experience had a negative effect. Regarding risk attitude, the logit model found that rubber age, distance and risk perception of price change had a positive and significant effect on farmers’ risk aversion, while farmers’ age and use of rubber clones had a negative effect. The study logit model found that farmers’ age positively affects risk perception. The oldest farmers will perceive climate change, plant disease and price change as a high risk. Moreover, most rubber farmers also perceived price change as a high risk since it is related to the decline in output prices, which significantly impacts rubber farming (Imeldal et al. 2023).
Kongmanee and Ahmed (2026) found in their study, seven components of risk were such as
the first factor, Technical and farm management risk, accounted for 22.95% of the variance and included poor farm practices such as limited fertilizer application, reliance on low-quality inputs, and inadequate financial capital. The second factor, Production risk, explained 12.18% of the variance and reflected monoculture practices, declining yields, and the exclusive production of cup-lump rubber. The third factor, Price and market risk, accounted for 10.24% of the variance and encompassed price volatility, global market downturn, rising input costs, and declining rubber demand. The fourth factor, Natural disaster risk, explained 5.88% of the variance and included storms, floods, and fire hazards. The fifth factor, Income risk, contributed 4.89% of the variance and reflected declining incomes, rising household expenses, and dependence on rubber income. The sixth factor, Middleman risk, explained 3.98% of the variance and was defined by price suppression and collusion among traders. The final factor, Farm skill and farmer competency risk, accounted for 3.51% of the variance, capturing limitations in farmer knowledge, particularly in intercropping and diversified farming.
The highest-ranked risk was Price and market risk (mean = 20.20), followed by Income risk (mean = 17.20) and Production risk (mean = 16.10), all of which were classified as high. Technical and farm management risk (mean = 13.82), Natural disaster risk (mean = 13.63), Middleman risk (mean = 12.74), and Farm skills and competency risk (mean = 12.60) were classified as moderate. These findings indicate that rubber farmers perceive economic and market-related uncertainties as the most severe threats, while technical and institutional risks are viewed as less urgent but still significant (Kongmanee and Ahmed, 2026). Muhammad et al. (2019) estimated in the study, the four major types of risks, such as flood risk, input high price risk, crop disease risk, and increasing temperature risk, in the study area. The findings reveal that education is a negative significant factor for input high prices risk. The outcomes indicate that more educated households consider less importance for input high price risk. The study also showed that the education coefficient has a negative and significant effect on disease risk, which shows that more educated farmers’ perception is less toward disease risk. As education gives awareness, the more educated growers are well-managing crop disease at their farms.
Furthermore, the external risks are risks that arise from factors outside the farms and are generally beyond their direct control. These risks are caused by external forces such as changes in the market, regulations, or natural disasters. External risks can significantly impact a business, and while they cannot always be avoided, they can often be mitigated through strategic planning and risk management. There are five risk type consisting of: land/tenancy rights risks related to external changes in land ownership laws, disputes over tenancy rights, or government expropriation of land, market risks from external market fluctuations, changes in demand, entry of competitors, or shifting consumer preferences, prices risks tied to volatility in commodity prices, inflation, or changes in supply and demand dynamics that impact profitability, climate and natural disaster risks caused by environmental factors like droughts, floods, hurricanes, or long-term climate change affecting agricultural output, policies/institutions risks resulting from changes in government policies, regulations, agricultural subsidies, trade restrictions, or instability of institutions that impact farm operations. As for the external risk that farmers perceive as the highest risk in both Southern and Northeastern regions, price risk is equal to 3.38 and 2.14, respectively.
The study findings indicates that an Elbow in which the sum of squares begins to “bend”, informs the optimal number of clusters. This appears that there is a bit of an elbow or “bend” at k between 2-3 clusters. Moreover, the Gap Statistic compares the within-cluster dispersion for different numbers of clusters (k) with that expected under a reference null distribution. This method helps to overcome the limitations of other clustering validation techniques like the elbow method or silhouette score by providing a statistical framework. The kink in the Gap statistic plot suggests that for k = 3, the clustering solution is significantly solutions for clustering (Figure 3). The current study provided that the Gap Statistic is used to compare the dispersion within clusters across different values of (k) against what would be expected in a random distribution. This method provides a statistical framework that addresses some limitations of other validation methods, such as the Elbow Method or Silhouette Score. A noticeable “kink” in the Gap Statistic plot suggests that (k = 3) offers a robust clustering solution (Figure 7).
Materials and Methods
Data collection
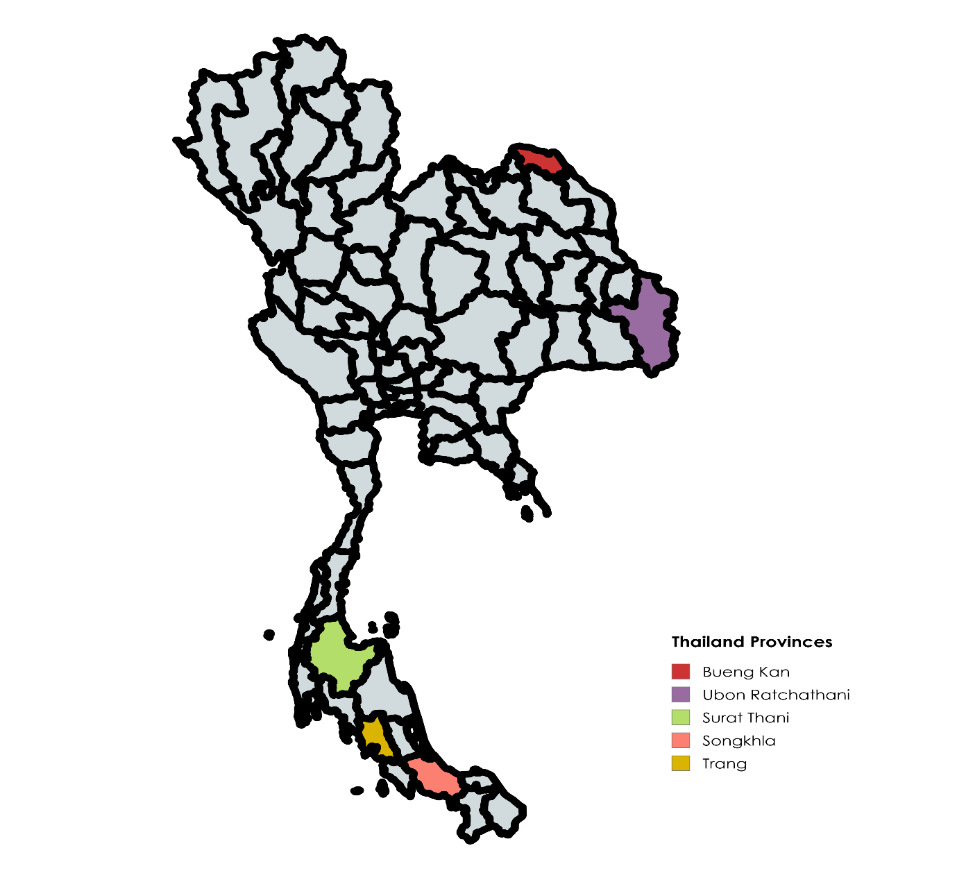 The study areas were selected
through purposive sampling, focusing on provinces with a high
concentration of rubber plantations and a strong dependence on a
rubber-based economy, incorporating ecological, economic, and social
dimensions. Three provinces in the southern region - Surat Thani,
Songkhla, and Trang - and two in the northeastern region - Bueng Kan and
Ubon Ratchathani - were chosen. These provinces were selected for their
diverse rubber plantation farming systems and their representation of
agricultural and social transitions, including rural development and
increasing urbanization. A multistage sampling approach was employed.
Initially, two districts in each province were purposively selected
based on the criterion of having a significant number of rubber farmers.
Subsequently, two sub-districts within each district were chosen using
the same criterion. Finally, respondents were randomly selected from the
20 identified sub-districts using simple random sampling. The survey
included 260 rubber farmers from the northeastern region and 414 farmers
from the southern region. Data collection was conducted through a
questionnaire survey. The questionnaire was internally pre-tested and
further refined during sessions with farmers, incorporating their
feedback and suggestions for improvement. Farmers were asked to evaluate
each source of risk using a Likert scale ranging from 1 (very low
impact) to 5 (very high impact).
The study areas were selected
through purposive sampling, focusing on provinces with a high
concentration of rubber plantations and a strong dependence on a
rubber-based economy, incorporating ecological, economic, and social
dimensions. Three provinces in the southern region - Surat Thani,
Songkhla, and Trang - and two in the northeastern region - Bueng Kan and
Ubon Ratchathani - were chosen. These provinces were selected for their
diverse rubber plantation farming systems and their representation of
agricultural and social transitions, including rural development and
increasing urbanization. A multistage sampling approach was employed.
Initially, two districts in each province were purposively selected
based on the criterion of having a significant number of rubber farmers.
Subsequently, two sub-districts within each district were chosen using
the same criterion. Finally, respondents were randomly selected from the
20 identified sub-districts using simple random sampling. The survey
included 260 rubber farmers from the northeastern region and 414 farmers
from the southern region. Data collection was conducted through a
questionnaire survey. The questionnaire was internally pre-tested and
further refined during sessions with farmers, incorporating their
feedback and suggestions for improvement. Farmers were asked to evaluate
each source of risk using a Likert scale ranging from 1 (very low
impact) to 5 (very high impact).
Figure 11. Survey area of the study.
Data analysis
Risk perspectives and clustering are crucial in risk management and decision-making processes across various sectors. Risk perspectives involve understanding and assessing potential risks from different viewpoints, such as financial, operational, strategic, and compliance-related risks. To identify and prioritize risks, different perspectives allow for a comprehensive identification of risks, ensuring no significant risk is overlooked. Clustering risks with similar characteristics is a strategic approach to managing risks by grouping them based on shared attributes. This helps organizations streamline their risk management processes and develop more effective mitigation strategies. The risk clustering for rubber farmers involves steps as follows:
I
Clustering method using the quantitative methods of the K-means clustering partition risks into 𝑘 clusters based on their characteristics) and the Fuzzy C-Means clustering (a membership function to measure the likelihood of a data point belonging to each cluster) to ensure the proper groups. Then, the Within-Cluster Sum of Squares method identifies the optimal number of clusters by finding the "Elbow point," where variance reduction slows significantly.
Cluster analysis to determine risk perception among rubber farmers
Cluster analysis is a method used to identify groups of subjects that exhibit similar characteristics, with the "similarity" within each group reflecting a distinct trait that differentiates it from the larger population or sample. The existence of well-defined clusters indicates significant differences between groups, whereas a single cluster suggests a high degree of homogeneity within the data. As an unsupervised learning technique, cluster analysis does not require prior knowledge of the number of clusters within the dataset. Unlike many traditional statistical methods, it operates without assuming predefined relationships among variables. While cluster analysis is instrumental in uncovering associations and patterns within the data, it does not inherently explain the nature or meaning of these patterns (Landau and Chis Ster, 2010).
Clustering distance measures
Distance measures are a critical step in clustering. It defines how the similarity of two elements (x, y) is calculated and it will influence the shape of the clusters. The classical methods for distance measures are Euclidean, which are defined as follow:
Euclidean distance:
\[d_{euc}(x,y) = \sqrt{\sum_{i = 1}^{n}{(x_{i} - y_{i})}^{2}}\]
where x and y are two vectors of length n.
Standardization enhances the similarity among the four distance measure methods of Euclidean, Manhattan, Correlation and Eisen - more similar than they would be with non-transformed data. Note that, when the data are standardized, there is a functional relationship between the Pearson correlation coefficient r (x, y) and the Euclidean distance. This relationship can be expressed mathematically as follows:
\[d_{euc}(x,y) = \sqrt{2m\lbrack 1 - r(x,y)\rbrack}\]
where x and y are two standardized m-vectors with zero mean and unit length.
Therefore, the result obtained with Pearson correlation measures and standardized Euclidean distances are comparable. (Landau and Chis Ster, 2010; Yim and Ramdeen, 2015).
K-means algorithm
The K-means algorithm is widely employed in risk identification for rubber farming in Thailand by utilizing a cluster analysis approach. This method groups rubber farming areas based on shared characteristics, enabling the identification of specific risk factors across different regions. By segmenting the data into clusters, the K-means algorithm helps reveal patterns that highlight variations in risk levels, such as climate vulnerability, soil quality, or market access. The cluster-based approach not only identifies homogeneous groups with similar risk profiles but also emphasizes key differences between clusters, offering insights into how risks vary geographically or due to environmental and economic factors. This provides a more targeted understanding of the challenges faced by rubber farmers, informing better risk management and mitigation strategies. K-means is a centroid based clustering model. This method operates an iterative clustering algorithm for partitioning a given relevant data into a set of k groups in which k is assigned the proper number of clusters pre-specified by the analyst. It assorts objects in multiple groups, such that these items within the cluster are similar (high intra-class similarity), while other objects outward clusters are dissimilar (low inter-class similarity). (Hartigan & Wong, 1979). Algorithm prescribed the total within-cluster variation in Equation as:
\[W(C_{k}) = \sum_{x_{i} \in C_{k}}^{}{(x_{i} - u_{k})}^{2}\]
where x_i denotes a data point under the cluster C_k and u_k refers to the mean value of the points belonging to the cluster C_k. The individual observation (x_i) is particularized to a given cluster such that the sum of squares (SS) distance of the observation corresponding to their imposed cluster centers (u_k) is minimized. The total within-cluster variation, which measures the concision or goodness of the clustering, is defined in Equation as:
\[tot.withiness = \sum_{k = 1}^{k}{W(C}_{k})\ \]
\(= \sum_{k = 1}^{k}{\sum_{x_{i} \in C_{k}}^{}{(x_{i} - u_{k})}^{2}}\)
Fuzzy C-Means clustering
Fuzzy logic principles can be applied to cluster multidimensional data by assigning each data point a degree of membership to each cluster center, ranging from 0 to 100 percent. This approach is more flexible and powerful compared to traditional hard-threshold clustering, where each data point is assigned a definitive, precise label. In fuzzy clustering, the degree of membership of each point to a cluster is determined based on the distance between the data point and the cluster center. The closer the data point is to a cluster center, the higher its membership value for that cluster. Importantly, the sum of the membership values for each data point across all clusters must always equal one. (Aman Gupta, 2021)
The process flow of Fuzzy C-means is enumerated below:
Assume a fixed number of clusters k.
Initialization: Randomly initialize the k-means \(\mu_{k}\) associated with the clusters and compute the probability that each data point \(x_{i}\) is a member of a given cluster k, P(point \(x_{i}\) has label k|\(x_{i}\), k).
Iteration: Recalculate the centroid of the cluster as the weighted centroid given the probability of membership of all data points \(x_{i}\):
\[\mu_{k}(n + 1) = \frac{\sum_{x_{i}\epsilon k}^{}{x_{i}*P(\mu_{k}{|x}_{i})^{b}}}{\sum_{x_{i}\epsilon k}^{}{P(\mu_{k}{|x}_{i})^{b}}}\]
Termination: Iterate until convergence or until a user-specified number of iterations has been reached (the iteration may be trapped at some local maxima or minima).
Conclusion
The study revealed that farmers in the South region perceived both internal and external risks more acutely than those in the Northeast. Among internal risks, production risks were considered the most significant, while price risk was seen as the primary external concern. Production and prices risk interact with these vigorous impacts on rubber production in both regions. Farmers are worried about the variability in crop yields, quality control, and the overall effectiveness of their farming practices. Uncertainties arise from challenges such as pest infestations and diseases, leading to doubts about their ability to produce rubber consistently. Adoption of GAP (Good Agricultural Practices) should be promoted for rubber plantations nationwide. This involves using rubber plantation technology according to academic guidelines to improve productivity, reduce costs, produce high-quality latex, and increase income. A specialized GAP promotion unit should be established, and all registered rubber farmers must undergo GAP standard training through this unit. Sub-units under the Rubber Authority of Thailand at the district/province level should be set up to monitor, control, and evaluate the use of GAP standards. Moreover, the fluctuations in rubber prices create significant financial stress for farmers. Rubber farmers raise concerns about their capacity to sell products profitably amidst global market changes. Establishing a nationwide auction and network market system for rubber is necessary to increase trade volumes and facilitate rubber trading in various regions. This should involve collaboration between the Rubber Authority of Thailand and agricultural institutions. Integrated risk management to cope with high risk is crucial. Sharing and visualizing information about risk among rubber farmers and related organizations can come up with strategies collaboratively to mitigate and manage it, an integrated approach helps make compliance and security a common priority across the board for the entire rubber industry.
Acknowledgments
The authors would like to thank financial sponsorship from the RAOT and active cooperation from Thai local rubber farmers.
References
Gupta A (2021) Fuzzy C-means clustering (FCM) algorithm. Medium. Available at: https://medium.com/geekculture/fuzzy-c-means-clustering-fcm-algorithm-in-machine-learning-c2e51e586fff
Baquet AE, Jose D & Hambleton R (1997) Introduction to risk management: understanding agricultural risks: production, marketing, financial, legal, human resources. U.S. Department of Agriculture, Risk Management Agency, Washington, DC.
*Drollette SA (2009) Managing production risk in agriculture. Department of Applied Economics, Utah State University.
FAO (2018) The impact of disasters and crises on agriculture and food security. Food and Agriculture Organization of the United Nations. Available at: https://openknowledge.fao.org/server/api/core/bitstreams/0f03a24f-8d37-4700-aef4-fc436ff32021/content
Hardaker JB, Lien G, Huirne RBM & Anderson JR (2003) Coping with risk in agriculture: applied decision analysis. 3rd edn. CABI International, Wallingford, UK.
Hartigan JA & Wong MA (1979) Algorithm AS 136: a K-means clustering algorithm. Applied Statistics 28(1): 100–108.
Huet EK, Adam M, Giller KE & Descheemaeker K (2020) Diversity in perception and management of farming risks in southern Mali. Agricultural Systems 184: 102905.
Imelda, Mulyo JH, Suryantini A & Masyhuri (2023) Understanding farmers’ risk perception and attitude: a case study of rubber farming in West Kalimantan, Indonesia. AIMS Agriculture and Food 8(1): 164–186.
Kasper R (1980) Perceptions of risk and their effects on decision making. In: Schwing RC & Albers WA Jr (eds) Societal Risk Assessment. Springer, New York, pp. 71–84.
Knight FH (1921) Risk, uncertainty and profit. Houghton Mifflin Company, Boston, MA and New York, NY, USA.
Komarek AM, De Pinto A & Smith VH (2020) A review of types of risks in agriculture: what we know and what we need to know. Agricultural Systems 178: 102738.
Kongmanee C, Ahmed F & Longpichai O (2023) Identifying farm risk management strategies of rubber farmers: a study in Southern Thailand. Australian Journal of Crop Science 17(6): 498–526.
Kongmanee C & Ahmed F (2026) Risks and risk management strategies in rubber farming: evidence from new areas of Northeastern Thailand. Journal of Cultural Analysis and Social Change 11(1): 1647–1658. https://doi.org/10.64753/jcasc.v11i1.4150
Landau S & Chis Ster I (2010) Cluster analysis: overview. In: International Encyclopedia of Education. pp. 72–83. https://doi.org/10.1016/B978-0-08-044894-7.01315-4
Laura G (2012) Risks in agriculture and opportunities of their integrated evaluation. Procedia - Social and Behavioral Sciences 62: 783–790.
Meraner M & Finger R (2018) Risk perceptions, preferences and management strategies: evidence from a case study using German livestock farmers. Journal of Risk Research 22(1): 110–135.
Muhammad R, Saboor A & Umar IA (2019) Measuring rice farmers’ risk perceptions and attitude: evidence from Pakistan. Human and Ecological Risk Assessment 26(7): 1–16.
Musser WN & Patrick GF (2002) How much does risk really matter to farmers? In: Just RE & Pope RD (eds) A Comprehensive Assessment of the Role of Risk in U.S. Agriculture. Kluwer Academic Publishers, pp. 537–556.
OECD (2013) Smallholder risk management in developing countries. Organisation for Economic Co-operation and Development, Paris.
OAE (2023) Rubber plantation area. Office of Agricultural Economics. Available at: https://www.oae.go.th
Osiemo J, Ruben R & Girvetz E (2021) Farmer perceptions of agricultural risks: which risk attributes matter most for men and women. Sustainability 13: 12978.
Riwthong S, Schreinemachers P, Grovermann C & Berger T (2017) Agricultural commercialization: risk perceptions, risk management and the role of pesticides in Thailand. Kasetsart Journal of Social Sciences 38: 264–272.
Rubber Division (2023) Rubber statistics for the year 2023. Available at: https://www.doa.go.th/rubber/?p=2140
Shi M, Huang J & Waibel H (2017) Rubber specialization vs crop diversification: the roles of perceived risks. China Agricultural Economic Review 9(2): 188–210. https://doi.org/10.1108/CAER-07-2016-0097
Siegel J (2005) Perspective on the equity risk premium. Financial Analysts Journal 61(6): 61–73.
Sitkin SB & Weingart LR (1995) Determinants of risky decision-making behavior: a test of the mediating role of risk perceptions and propensity. Academy of Management Journal 38(6): 1573–1592.
Solomon B & Ruiz I (2012) Political risk, macroeconomic uncertainty, and the patterns of foreign direct investment. International Trade Journal 26(2): 181–198.
Sulewski P & Kłoczko-Gajewska A (2014) Farmers’ risk perception, risk aversion and strategies to cope with production risk: an empirical study from Poland. Studies in Agricultural Economics 116(3): 140–147.
Tran TL (2020) Risk assessment of the economic efficiency of rubber production: case of smallholder rubber production in Quang Binh Province, Vietnam. African Journal of Agricultural Research 16(5): 567–573.
Yim O & Ramdeen KT (2015) Hierarchical cluster analysis: comparison of three linkage measures and application to psychological data. The Quantitative Methods for Psychology 11(1): 8–21.