Australian Journal of Crop Science
Article | https://doi.org/10.21475/ajcs.26.20.09.pne245
Submitted: 22 January 2026 | Revised: 25 July 2026 | Accepted: 06 August 2026
Pages 749-758
Multi-location evaluation and specific selection of elite common bean lines for grain yield and quality
Eduardo Almeida Alves1*, Saulo Muniz Martins2, Luis Claudio de Faria2, Marcelo Sfeir de Aguiar2, Patrícia Guimarães Santos Melo1, Helton Santos Pereira2, Leonardo Cunha Melo2
1Universidade Federal de Goiás, Escola de Agronomia, Campus Samambaia, Avenida Esperança, s/n°, 74690-900, Goiânia, GO, Brazil.
2Embrapa Arroz e Feijão, Rodovia GO-462, Km 12, Fazenda Capivara, Zona Rural, 75375-000, Santo Antônio de Goiás, GO, Brazil.
*Corresponding author: eduardoalmeidaalves10@gmail.com
ORCID: 0000-0001-9085-0292
Abstract: Common bean cultivation occurs under high environmental variation, highlighting the marked effect of the interaction between genotypes and environments (G×E). This effect complicates the indication and recommendation of common bean lines. From this perspective, this study aimed to evaluate the effect of the G×E interaction and estimate the stability and adaptability of common bean lines for grain yield and commercial quality. A total of 22 genotypes were evaluated in 56 environments. The parameters estimated were grain yield (GY), stored grain color (SGC), sieve yield (SY), and 100-grain mass (100M). The analysis of variance revealed a significant effect for the genotypes, environments, and the G×E interaction. For GY, genotype IPR Campos Gerais was the most adaptable and CNFC 16564 the most stable; for SGC, genotype CNFC 16484 showed adaptability and CNFC 16497 showed stability; for SY, genotypes ANFC 09 and CNFC 16636 were the most adapted and stable, in that order; and for 100M, genotype CNFC 16564 and the cultivar Pérola stood out. Genotypes CNFC 16564 and CNFC 16567 were launched as cultivars, receiving the respective names of BRS FC416 and BRS FC422.
Keywords: Phaseolus vulgaris L., Stability, Adaptability, Genotype-by-environment interaction.
Introduction
Common bean stands out among cultivated species due to its short cycle and the possibility of yielding up to three harvests per year, allying flexibility regarding planting seasons with optimization in the use of production areas. Brazilian production of this crop varies with the region, with the South, Southeast, and Central-West regions being responsible for two or even three harvests every year, whereas the Northeast region only produces one. The cultivation range of common bean varies from small production areas with little use of inputs to large, business-ran areas counting on highly technological practices (Melo et al., 2007).
Environmental variations and genotypic variability result in an interaction between genotypes and environments (G×E interaction), especially in the final evaluation stages of common bean lines (Melo et al., 2007; Torga et al., 2013). Due to the G×E interaction, the average phenotypic performance of common bean genotypes is not consistent and stable in different environments, thus complicating selection and the recommendation of cultivars (Eberhart and Russel, 1966).
Successive increases in yield are the main objective in breeding programs. In that regard, Faria et al. (2013) achieved an annual yield increase of 0.72% in the common bean breeding program developed at Embrapa. However, commercial grain quality is a parameter has gained importance and is often determinant in the adoption of a cultivar. Furthermore, the Brazilian consumer is regionally demanding with regard to grain color and quality (Pereira et al., 2017), associating parameters such as visual quality with cooking time in their evaluation (Pereira et al., 2021).
The effect of the G×E interaction is important for traits such as commercial grain quality (Pereira et al., 2021; Dias et al., 2021; Carloni et al., 2022) and grain yield (Melo et al., 2018; Mondo et al., 2019; Katuuramu et al., 2020). In this scenario, studies on the effect of the G×E interaction and the regionalization of cultivar recommendation can assist in developing new common bean lines.
One of the ways to evaluate the effect of the G×E interaction is to estimate stability and adaptability. The method of Nunes et al. (2005) enables this estimation using two indices: Zi, which measures the phenotypic standard deviation, a measure of adaptability, and the coefficient of phenotypic variation, CVZi, which estimates stability. The method proposes a graphical analysis, facilitating the evaluation in multi-environments, which constitutes an advantage, especially given the large number of environments in the final stages of a breeding program.
The improvement of cultivar performance in common bean production areas can be achieved through specific recommendations by taking advantage of the phenotypic effect of the G×E interaction (Duarte and Vencovsky, 1999), or even using the recommendation of widely adaptable genotypes while aiming at genotype stability (Melo et al., 2007). From this perspective, this study aimed to analyze the effect of the G×E interaction and measure adaptability and stability in relation to the yield and grain quality in elite common bean lines. The purpose was to identify cultivars with wide or specific adaptability to the different producing regions and planting seasons.
Results and discussion
For grain yield, 78.57% of the individual experiments showed significant differences between genotypes, with a mean yield of 2439 kg ha-1 and a low coefficient of variation (16.03%) (Table S1). There were significant differences between genotypes in all environments for stored grain color (Table S2) and sieve yield (Table S3), with the mean of the coefficient of variation amounting to 15.75% and 6.92%, respectively. For the 100-grain mass (g), a significant difference between genotypes was observed in 90% of the assays, with a mean coefficient of variation of 5.08% (Table S4).
Regarding the acceptance of a cultivar, commercial quality traits are essential for a successful market launch (Pereira et al., 2017), showing importance for producers, industries, and the final consumer. In this scenario, consumers prefer specific types of grains, whereas producers seek greater production values (Pereira et al., 2017). Consumer acceptance is based on grain color, with lighter grains being associated with shorter shelf life and fast cooking (Pereira et al., 2021). However, the market has regional demands with regard to grain color, size, and shape (Pereira et al., 2017). For common beans, the 100-grain mass should be greater than 25 grams, the sieve yield above 90%, and grains should show brown stripes and a light beige background (Pereira et al., 2017). Therefore, it is necessary to combine commercial grain quality traits in order to launch new lines (Pereira et al., 2021).
The main producing regions of common bean in Brazil (regions I, II, and III) (Pereira et al., 2010a) encompass 20 states and concentrate more than 98% of the national production (Embrapa Arroz e Feijão, 2023). In that regard, the marked environmental variation and the need for experiments conducted as a function of a representative sample of the various regions (Melo et al., 2007; Pereira et al., 2010b) require the conduction of assays in a network.
The advantage of numerous assays consists of the possibility of exposing genotypes to environmental variations, thus effectively taking into account the effects of the G×E interaction. This statement has been verified in the present study since there was a significant G×E interaction for all traits (Table S5) in the three regions (I, II, and III) (Table S6), which indicates a differential response of the genotypes in relation to the environments. Considering planting seasons, the G×E interaction was significant in one season of region I and two seasons of region II (Table S7). The presence of the G×E interaction has already been reported by some studies in states that constitute region I (Melo et al., 2007, Pereira et al., 2010b) and region II (Pereira et al., 2011; Torga et al., 2013; Melo et al., 2018).
Stability and adaptability
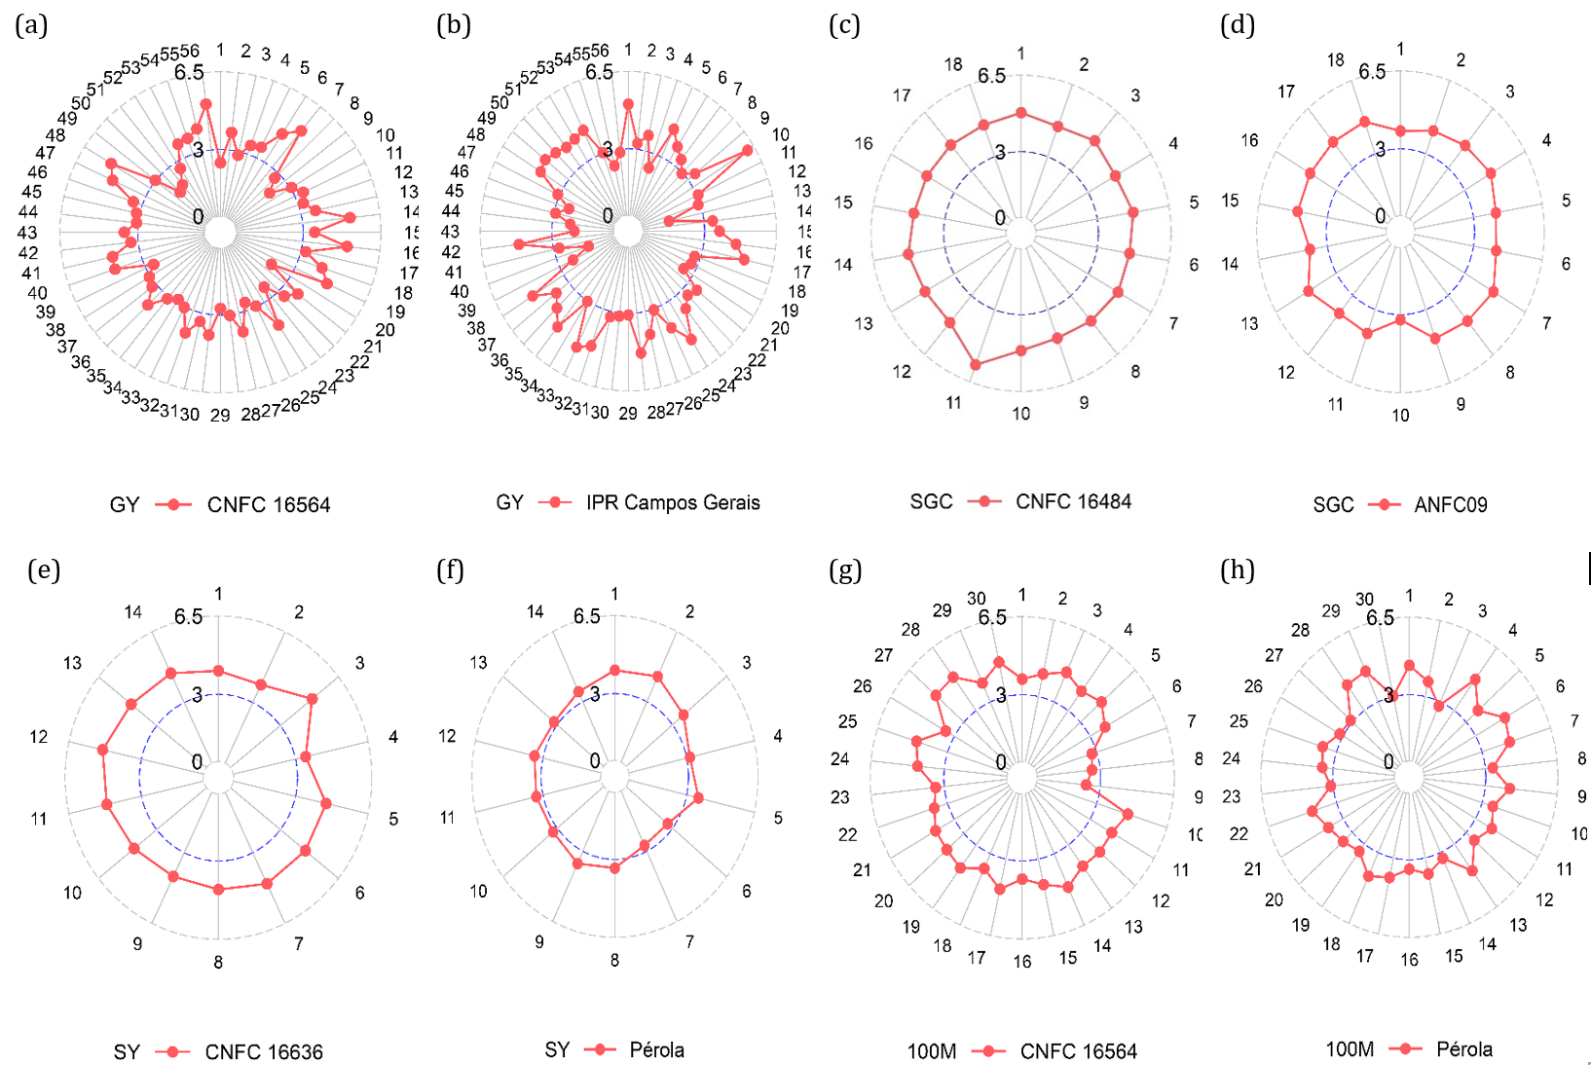
The stability and adaptability results for grain yield indicate that the cultivar IPR Campos Gerais showed the highest Zi, followed by lines CNFC 16611, CNFC 16562, and CNFC 16564 (Table 1). For the coefficient of variation (CVZi), line CNFC 16564, with the lowest value, showed greater production stability. In the present study, in the joint consideration of the Zi and CVZi parameters, line CNFC 16564 showed performance superiority in relation to the other genotypes, a behavior that can also be seen graphically (Figure 1a). IPR Campos Gerais had the highest performance among the cultivars (Figure 1b).
Pereira et al. (2021) evaluated 54 genotypes by the method of Nunes et al. (2005) and concluded that cultivar BRS Estilo was the most adaptable and stable for grain yield. Pereira et al. (2020) highlighted the adequate adaptation of the cultivar Pérola with the same method. However, these cultivars did not show the same behavior in the present study, which could be expected since the set of lines is different in the two studies. Furthermore, the present study indicates that the new breeding lines developed by the breeding program exhibited superior trait-specific performance compared with standard cultivars, especially older cultivars currently grown in Brazil.
With regard to quality, the grains were evaluated for stored grain quality (SGC) (Table 1), with lines CNFC 16484, CNFC 16496, and CNFC 16497 showing the highest adaptive value (Zi) and surpassing cultivars BRS Estilo and Pérola. For stability, line CNFC 16484 obtained the third lowest coefficient of variation (CVZi), 6.01, with lines CNFC 16496 and CNFC 16497 showing 4.16 and 3.52. Therefore, these three genotypes have high constancy of phenotypic performance, especially line CNFC 16484, which stood out for both indices.
Dias et al. (2021) used the method of Nunes et al. (2005) and observed results close to the present study, for both stability and adaptability, for cultivars BRS Estilo (Zi = 3.29; CVZi = 10.4) and Pérola (Zi = 2.82; CVZi = 16.5). Pereira et al. (2021) found slightly different values, compared to this study, for the cultivar BRS Estilo (Zi = 2.4; CVZi = 25.1). Furthermore, Pereira et al. (2021) used the cultivar BRSMG Madrepérola as a control, whose grains show slow darkening, obtaining a mean of 2.1. In the present study, line CNFC 16484 showed a mean of 1.11 (Table 1). Similarly, the graphical analysis for SGC (Figure 1c) highlighted line CNFC 16484 with the highest stability. Among the cultivars ANFC09 had the best result (Figure 1d).
Cultivars BRS Estilo and Pérola have a grain standard and sieve yield in accordance with market demands (Pereira et al., 2017). For sieve yield (SY) (%) (Table 1), line CNFC 16636 showed the best stability (Zi) among lines and an SY mean of 89.33%, exceeding cultivars Pérola and BRS Estilo. In turn, the ANFC09 control reached the best result among all genotypes, with a Zi and a mean of 4.46 and 89.68%, respectively. Although neither genotype reached the 90% threshold, their values were close to the established standard. This should also be interpreted considering that sieve yield (SY) is a quantitative trait strongly affected by environmental variation. In the stability evaluation, line CNFC 16636 obtained the best result, with 8.74, higher than the other lines and controls. Figure 1e shows the performance of line CNFC 16636 in relation to cultivar Pérola (Figure 1f), a control with higher performance.
Table 1. Means of grain yield (kg ha-1) (GY), stored grain color (SGC), sieve yield (%) (SY) and 100-grain mass (g) (100M) and estimates of adaptability (Zi) and phenotypic stability (CVZi), by the method of Nunes et al. (2005).
| Genotype | GY | SGC | SY | 100M | ||||||||
|---|---|---|---|---|---|---|---|---|---|---|---|---|
| GY* | Zi | CVZi | SGC* | Zi | CVZi | SY* | Zi | CVZi | 100M* | Zi | CVZi | |
| IPR Campos Gerais | 2685 a | 3.56 | 28.65 | 3.07 f | 2.29 | 24.73 | 83.21 b | 3.65 | 13.58 | 24.62 e | 2.02 | 38.02 |
| CNFC 16611 | 2626 a | 3.48 | 27.21 | 2.91 e | 2.49 | 14.56 | 84.92 b | 3.88 | 10.04 | 26.90 c | 3.29 | 21.44 |
| CNFC 16564 | 2610 a | 3.47 | 23.82 | 2.46 c | 3.03 | 18.32 | 77.77 d | 3.18 | 23.10 | 28.20 a | 4.00 | 15.20 |
| CNFC 16562 | 2593 a | 3.48 | 25.88 | 2.98 f | 2.36 | 27.47 | 74.06 e | 2.58 | 20.69 | 27.28 b | 3.51 | 17.78 |
| CNFC 16563 | 2551 b | 3.35 | 27.31 | 2.44 c | 3.03 | 16.60 | 74.88 e | 2.77 | 19.29 | 27.66 a | 3.70 | 16.62 |
| BRS FC402 | 2547 b | 3.25 | 30.49 | 2.81 e | 2.58 | 14.86 | 66.20 f | 1.70 | 56.28 | 23.82 f | 1.62 | 60.75 |
| CNFC 16567 | 2537 b | 3.26 | 27.57 | 2.69 d | 2.77 | 13.92 | 73.31 e | 2.60 | 43.28 | 26.96 c | 3.31 | 17.18 |
| Pérola | 2507 b | 3.17 | 27.19 | 3.09 f | 2.19 | 17.50 | 81.02 c | 3.43 | 12.65 | 27.71 a | 3.79 | 13.91 |
| BRSMG Uai | 2445 c | 3.04 | 33.22 | 2.93 e | 2.47 | 19.52 | 77.61 d | 2.88 | 28.22 | 24.93 e | 2.22 | 28.89 |
| CNFC 16484 | 2444 c | 3.06 | 31.41 | 1.11 a | 4.66 | 6.01 | 73.71 e | 2.40 | 29.35 | 24.60 e | 2.03 | 32.03 |
| CNFC 16561 | 2431 c | 3.01 | 29.39 | 2.57 d | 2.87 | 12.67 | 80.22 c | 3.29 | 17.64 | 27.86 a | 3.77 | 23.09 |
| ANFC09 | 2423 c | 2.97 | 27.12 | 1.43 b | 4.26 | 8.52 | 89.68 a | 4.46 | 11.69 | 26.84 c | 3.26 | 21.64 |
| CNFC 16183 | 2406 c | 2.99 | 32.39 | 3.61 g | 1.57 | 23.12 | 74.15 e | 2.64 | 34.34 | 27.83 a | 3.87 | 18.30 |
| CNFC 16566 | 2402 c | 2.88 | 26.98 | 2.94 e | 2.41 | 18.15 | 80.21 c | 3.36 | 10.37 | 26.52 c | 3.09 | 19.46 |
| CNFC 16496 | 2397 c | 2.93 | 28.83 | 1.15 a | 4.62 | 4.16 | 66.50 f | 1.66 | 36.66 | 25.05 e | 2.27 | 20.87 |
| CNFC 16636 | 2389 c | 2.86 | 32.21 | 3.04 f | 2.30 | 18.64 | 89.33 a | 4.37 | 8.74 | 27.31 b | 3.49 | 20.61 |
| BRS Estilo | 2366 d | 2.84 | 38.09 | 2.35 c | 3.11 | 10.20 | 78.17 d | 2.99 | 23.99 | 25.88 d | 2.74 | 18.32 |
| CNFC 16558 | 2361 d | 2.78 | 33.67 | 2.50 c | 2.93 | 11.53 | 74.20 e | 2.50 | 29.82 | 26.16 d | 2.92 | 21.19 |
| CNFC 16522 | 2331 d | 2.65 | 29.69 | 2.46 c | 3.00 | 12.49 | 73.39 e | 2.55 | 41.42 | 25.65 d | 2.61 | 21.66 |
| CNFC 16497 | 2326 d | 2.62 | 30.42 | 1.17 a | 4.58 | 3.52 | 76.48 d | 2.79 | 19.67 | 25.86 d | 2.72 | 16.99 |
| CNFC 16495 | 2247 d | 2.39 | 39.62 | 1.50 b | 4.21 | 21.92 | 75.08 e | 2.66 | 35.40 | 24.45 e | 1.96 | 31.26 |
| CNFC 16548 | 2034 e | 1.96 | 43.30 | 3.02 f | 2.28 | 25.29 | 83.09 b | 3.66 | 12.49 | 27.72 a | 3.79 | 27.93 |
| Mean | 2439 | 2.47 | 77.60 | 26.35 | ||||||||
* Means followed by the same letter do not differ significantly according to the Scott–Knott test at p ≤ 0.05.
Figure 1. Graphical representation of the performance of cultivars (IPR Campos Gerais, ANFC09, and Pérola) and lines (CNFC 16564, CNFC 16484, and CNFC 16636) for grain yield (GY), stored grain color (SGC), sieve yield (SY), and 100-grain mass (100M), according to the methodology of Nunes et al. (2005). The circle represents the mean of the environment (value of the constant associated with variable Z) and the axes represent each of the environments evaluated.
Table 2. Grain yield means (kg ha-1) of producing regions I (REG I), II (REG II), and III (REG III) and estimates of adaptability (Zi) e and phenotypic stability (CVZi) by the method of Nunes et al. (2005).
| Genotype | REG I | REG II | REG III | ||||||
|---|---|---|---|---|---|---|---|---|---|
| REG I* | Zi | CVZi | REG II* | Zi | CVZi | REG III* | Zi | CVZi | |
| ANFC09 | 2964 b | 3.08 | 25.37 | 2225 b | 2.94 | 29.27 | 1341 b | 2.67 | 20.95 |
| BRS Estilo | 2968 b | 2.96 | 28.94 | 2120 c | 2.69 | 41.77 | 1312 b | 3.21 | 52.43 |
| BRS FC402 | 3218 a | 3.62 | 22.59 | 2268 b | 3.03 | 35.94 | 1406 a | 3.06 | 22.20 |
| BRSMG Uai | 3002 b | 3.08 | 33.43 | 2268 b | 3.11 | 32.27 | 1175 b | 2.39 | 37.39 |
| IPR Campos Gerais | 3298 a | 3.80 | 26.32 | 2465 a | 3.50 | 28.76 | 1427 a | 2.91 | 35.97 |
| Pérola | 3074 b | 3.38 | 23.07 | 2315 b | 3.14 | 25.78 | 1274 b | 2.40 | 49.51 |
| CNFC 16183 | 2823 c | 2.71 | 28.45 | 2268 b | 3.09 | 33.15 | 1477 a | 3.52 | 34.09 |
| CNFC 16484 | 2817 c | 2.65 | 26.67 | 2346 b | 3.27 | 30.86 | 1470 a | 3.57 | 32.56 |
| CNFC 16495 | 2707 c | 2.16 | 43.88 | 2112 c | 2.59 | 38.09 | 1133 b | 2.19 | 20.03 |
| CNFC 16496 | 2945 b | 2.96 | 27.07 | 2187 c | 2.86 | 30.58 | 1360 b | 3.22 | 29.46 |
| CNFC 16497 | 2844 c | 2.55 | 36.16 | 2125 c | 2.65 | 27.27 | 1349 b | 2.68 | 29.68 |
| CNFC 16522 | 2990 b | 2.95 | 24.07 | 2059 c | 2.54 | 31.27 | 1196 b | 2.07 | 32.55 |
| CNFC 16548 | 2531 d | 1.91 | 40.04 | 1789 d | 1.83 | 42.08 | 1420 a | 2.92 | 39.99 |
| CNFC 16558 | 2869 c | 2.81 | 32.92 | 2149 c | 2.67 | 35.92 | 1498 a | 3.39 | 22.86 |
| CNFC 16561 | 2857 c | 2.72 | 35.70 | 2269 b | 3.07 | 24.07 | 1613 a | 3.89 | 20.71 |
| CNFC 16562 | 3124 a | 3.61 | 27.73 | 2402 a | 3.36 | 26.55 | 1507 a | 3.60 | 10.27 |
| CNFC 16563 | 2956 b | 3.11 | 28.12 | 2416 a | 3.43 | 26.93 | 1658 a | 3.86 | 23.36 |
| CNFC 16564 | 3064 b | 3.29 | 26.88 | 2470 a | 3.59 | 23.25 | 1542 a | 3.56 | 11.94 |
| CNFC 16566 | 3055 b | 3.27 | 24.21 | 2134 c | 2.66 | 26.87 | 1268 b | 2.57 | 17.64 |
| CNFC 16567 | 3112 a | 3.49 | 29.01 | 2345 b | 3.23 | 24.38 | 1272 b | 2.47 | 25.62 |
| CNFC 16611 | 3116 a | 3.34 | 29.69 | 2470 a | 3.61 | 23.85 | 1495 a | 3.23 | 40.26 |
| CNFC 16636 | 2753 c | 2.54 | 36.35 | 2321 b | 3.12 | 28.41 | 1268 b | 2.62 | 28.72 |
| Mean | 2959 | 2251 | 1385 | ||||||
* Means followed by the same letter do not differ significantly according to the Scott–Knott test at p ≤ 0.05.
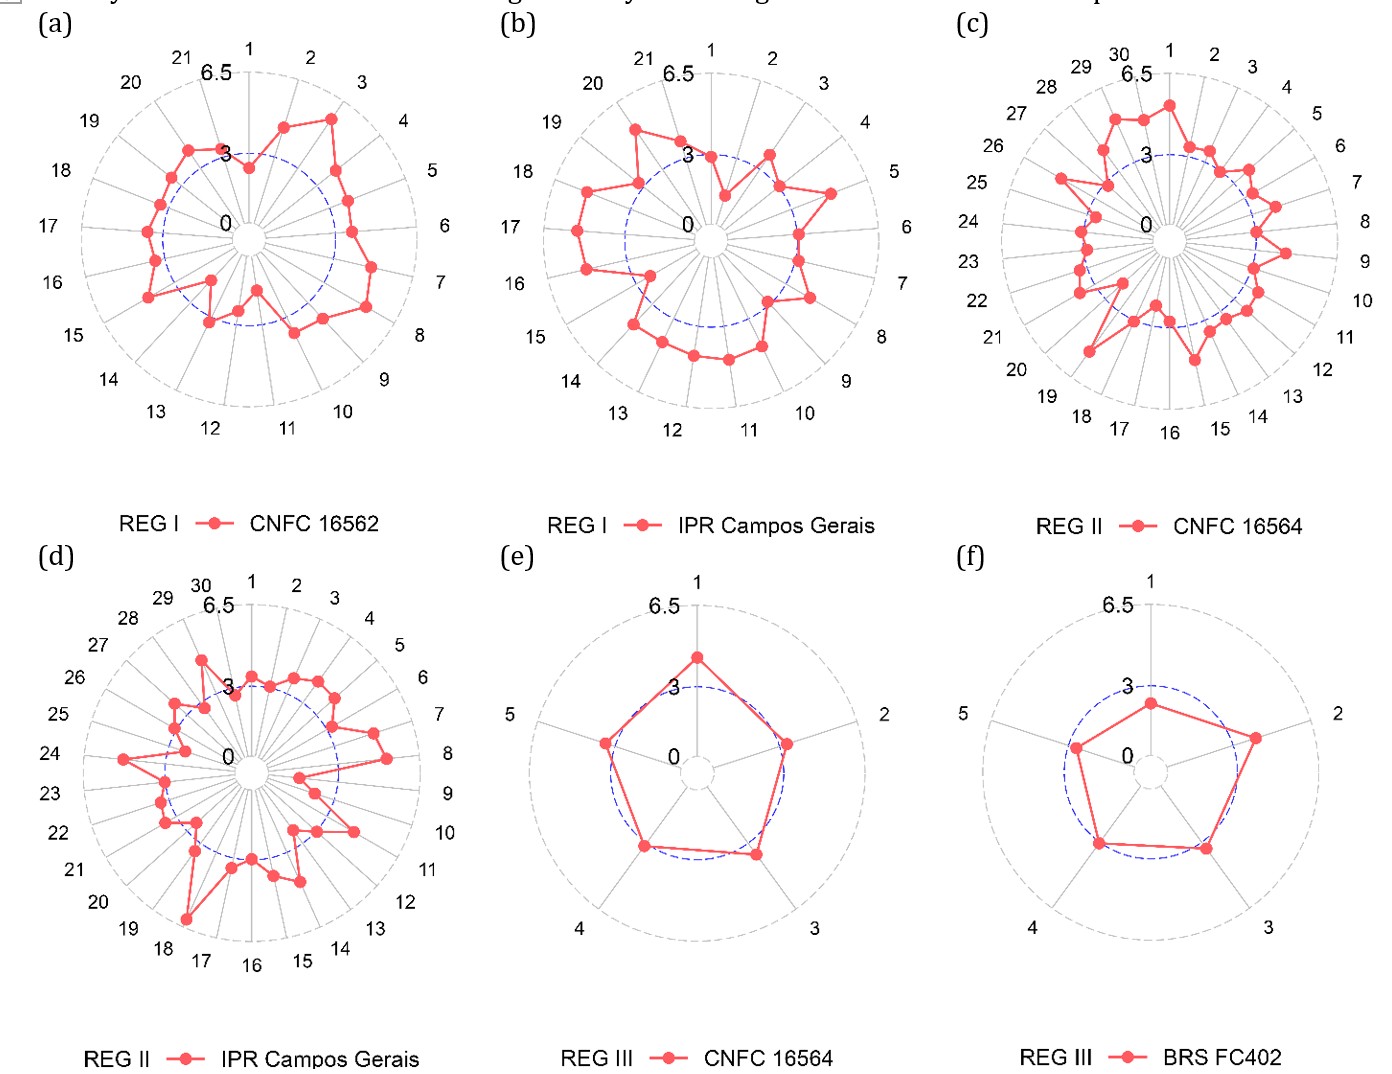
Figure 2. Graphical representation of the performance of cultivars (IPR Campos Gerais and BRS FC402) and lines (CNFC 16562 and CNFC 16564) for the grain yield of common bean in regions I (REG I), II (REG II), and III (REG III) according to Nunes et al. (2005). The circle represents the mean of the environment (value of the constant associated with variable Z) and the axes represent each of the environments evaluated.
According to Table 1, considering the 100-grain mass (g), for which the commercial standard is above 25 g/100M (Dias et al., 2021), line CNFC 16564 stood out from the other genotypes for adaptability, with a Zi equal to 4.00 and a mean of 28.20 g, surpassing the controls Pérola and BRS Estilo, which have grains that meet market demands (Pereira et al., 2021). The cultivar Pérola was the most stable, with a CVZi of 13.91, standing out from the other genotypes and reinforcing the grain quality of this cultivar and the difficulty to surpass it. In that case, line CNFC 16564 achieved good performance, with a CVZi of 15.20, very close to cultivar Pérola. These results show that line CNFC 16564 has high stability and adaptability, performing better than cultivars ANFC09, BRS Estilo, BRSMG Uai, IPR Campos Gerais, and BRS FC402. Graphically, line CNFC 16564 (Figure 1g) showed greater phenotypic stability compared to the cultivar Pérola (Figure 1h) in most environments.
Common bean shows low seed use by farmers and high variability of production systems. In 2021, the rate of use of certified seeds was 18% (Abrasem, 2024). Due to the reduced seeds commercialization, companies and industries show low interest in commercializing a large number of cultivars. From this perspective, the strategy adopted by breeders is to recommend a wide range of cultivars, which makes it possible to extrapolate the positioning of the same genotype to various environments. However, although favorable, this strategy implies little utilization of the production potential, achieving sub-optimal results (Duarte and Vencovsky, 1999). The joint indication of cultivars based on the specific adaptation to a group of environments, e.g., locations or planting seasons, making a better use of the G×E interaction, implies a better use of production areas and the genetic potential of genotypes.
Stratification by region
Considering the regional stratification proposed by Pereira et al. (2010a) for the yield in producing region I, cultivar IPR Campos Gerais obtained the highest adaptability index, followed by BRS FC402 and lines CNFC 16562, CNFC 16567, and CNFC 16611 (Table 2). For stability, cultivar BRS FC402 stood out in the best place, obtaining the lowest coefficient of variation. Pereira et al. (2018) used the method of Nunes et al. (2005) when working with states of region I, and classified the cultivar BRS Estilo as a genotype with good adaptability and stability. In the present study, lines CNFC 16562 and CNFC 1657 surpassed the cultivar BRS Estilo in adaptability, and genotypes BRS FC402 and CNFC 16522 were superior in stability. In the graphs, it is seen that the cultivar CNFC 16562 (Figure 2a) and IPR Campos Gerais (Figure 2b) showed constancy of performance.
In region II, lines CNFC 16564 and CNFC 16611 stood out with regard to adaptability, performance, and stability (Table 2). The stability analysis highlighted that line CNFC 16564 obtained the best result. Among genotypes, CNFC 16564 (Figure 2c) showed the most graphically constant phenotypic result, with genotype IPR Campos Gerais being the best control (Figure 2d).
For region III (Table 2), line CNFC 16561 obtained the best result for adaptability, with a Zi of 3.89, whereas CNFC 16562 was the most stable, with a CVZi of 10.27. In the graph, CNFC 16564 (Figure 2e) showed the most constant performance compared to BRS FC402 (Figure 2f) and the other lines and cultivars.
As observed by Pereira et al. (2011), the planting season is one of the factors that influence the G×E interaction. Regions I and II possess, in their states, two to three planting seasons per agricultural year. Torga et al. (2013) evaluated the decomposition of the effect of the G×E interaction in locations and planting seasons and found a strong effect of the interaction between genotypes with planting seasons. Therefore, the production stability and adaptability results of different genotypes evaluated in various regions and planting seasons are important for selections restricted to groups of environments.
Stratification by region and season
For region I, in the ‘Rains’ season (Table 3), CNFC 16562 stood out among lines and IPR Campos Gerais among genotypes. With regard to stability, line CNFC 16522 had the lowest CVZi, with 20.39, followed by CNFC 16496, with a CVZi of 21.88. The graphic representation highlighted that cultivar IPR Campos Gerais (Figure 3a) performed better than the other genotypes, whereas among lines, CNFC 16567 showed the best performance (Figure 3b).
In region II (Table 3), in the ‘Rains’ season, genotypes CNFC 16611, CNFC 16564, CNFC 16563, and IPR Campos Gerais obtained greater stability. Among these, line CNFC 16564 was the most stable. This behavior was confirmed in the graphical analysis (Figure 3c) along with genotype IPR Campos Gerais (Figure 3d).
Once more the CNFC 16484 genotype stood out for yield in region II, but in the ‘Winter’ season (Table 3). The BRSMG Uai achieved the best position among all materials for stability, whereas line CNFC 16497 stood out among cultivars, with the lowest value compared to cultivars BRS FC402 and IPR Campos Gerais, for example. In the graphical representation, CNFC 16484 (Figure 3e) and IPR Campos Gerais (Figure 3f) obtained the best results.
The specific recommendation of genotypes for planting seasons and producing regions leads to better efficiency compared to broad recommendations. Despite the safer indication of a broadly adaptable cultivar, taking advantage of the G×E interaction to increase production efficiency favors the recommendation and indication of new cultivars.
Among all genotypes evaluated, line CNFC 16564 showed wide adaptability and a stable performance for the yield and 100-grain mass, in addition to showing good performance for the other traits and adequate yields in regions I, II, and III. Due to that, CNFC 16564 was the line chosen for launching as the new cultivar of Embrapa, registered with the National Cultivar Registry (RNC) under the name BRS FC416 (Pereira et al., 2024). Due to the good performance for yield and specific adaptability to region I, the highest producing region in Brazil, line CNFC 16567 was also launched as a new cultivar of Embrapa, under the name BRS FC422 (Melo et al., 2024).
Table 3. Grain yield means (kg ha-1) of producing region I in the ‘Rains’ (REG I – R), and of region II in the ‘Rains’ (REG II – R), and ‘Winter’ seasons (REG II – W) and estimates of adaptability (Zi) and phenotypic stability (CVZi), by the method of Nunes et al. (2005).
| Genotype | REG I – R | REG II – R | REG II - W | ||||||
|---|---|---|---|---|---|---|---|---|---|
| REG I - R* | Zi | CVZi | REG II - R* | Zi | CVZi | REG II - W* | Zi | CVZi | |
| ANFC09 | 3180 b | 3.00 | 27.43 | 2352 a | 3.34 | 25.85 | 2280 b | 2.52 | 25.85 |
| BRS Estilo | 3233 b | 3.02 | 30.89 | 2143 b | 2.93 | 37.66 | 2319 b | 2.59 | 47.32 |
| BRS FC402 | 3469 a | 3.55 | 23.87 | 2305 a | 3.15 | 22.01 | 2465 a | 3.07 | 42.66 |
| BRSMG Uai | 3233 b | 3.02 | 37.40 | 2169 b | 2.97 | 47.17 | 2514 a | 3.14 | 19.76 |
| IPR Campos Gerais | 3541 a | 3.69 | 27.45 | 2475 a | 3.53 | 30.40 | 2658 a | 3.51 | 29.92 |
| Pérola | 3325 b | 3.36 | 23.96 | 2295 a | 3.10 | 29.25 | 2570 a | 3.32 | 23.80 |
| CNFC 16183 | 3070 c | 2.71 | 29.29 | 2316 a | 3.32 | 30.04 | 2413 a | 2.89 | 28.85 |
| CNFC 16484 | 3049 c | 2.64 | 25.94 | 2215 b | 2.99 | 32.95 | 2687 a | 3.62 | 25.06 |
| CNFC 16495 | 2991 c | 2.30 | 42.42 | 1853 c | 2.02 | 41.54 | 2533 a | 3.11 | 29.79 |
| CNFC 16496 | 3236 b | 3.16 | 21.88 | 2111 b | 2.76 | 29.04 | 2462 a | 3.01 | 34.73 |
| CNFC 16497 | 3138 c | 2.72 | 32.48 | 1917 c | 2.18 | 30.42 | 2494 a | 3.05 | 20.70 |
| CNFC 16522 | 3304 b | 3.11 | 20.39 | 2174 b | 2.90 | 26.08 | 2140 c | 2.22 | 36.57 |
| CNFC 16548 | 2719 d | 1.80 | 43.20 | 1783 c | 1.94 | 51.05 | 1955 c | 1.67 | 35.57 |
| CNFC 16558 | 3145 c | 2.90 | 31.93 | 2198 b | 2.81 | 36.97 | 2307 b | 2.58 | 38.73 |
| CNFC 16561 | 3084 c | 2.70 | 38.00 | 2303 a | 3.26 | 16.95 | 2456 a | 2.99 | 29.89 |
| CNFC 16562 | 3366 a | 3.62 | 30.73 | 2199 b | 2.94 | 19.74 | 2720 a | 3.60 | 23.03 |
| CNFC 16563 | 3180 b | 3.10 | 30.54 | 2447 a | 3.62 | 26.66 | 2601 a | 3.34 | 30.42 |
| CNFC 16564 | 3314 b | 3.33 | 28.71 | 2467 a | 3.68 | 16.60 | 2604 a | 3.34 | 27.74 |
| CNFC 16566 | 3237 b | 3.05 | 23.67 | 2185 b | 2.85 | 28.27 | 2287 b | 2.54 | 21.98 |
| CNFC 16567 | 3351 a | 3.43 | 28.82 | 2318 a | 3.23 | 24.29 | 2566 a | 3.23 | 27.89 |
| CNFC 16611 | 3373 a | 3.40 | 25.88 | 2486 a | 3.78 | 26.92 | 2596 a | 3.34 | 22.29 |
| CNFC 16636 | 2957 c | 2.40 | 37.09 | 2124 b | 2.71 | 22.24 | 2628 a | 3.33 | 25.92 |
| Mean | 3204 | 2220 | 2466 | ||||||
* Means followed by the same letter do not differ significantly according to the Scott–Knott test at p ≤ 0.05.
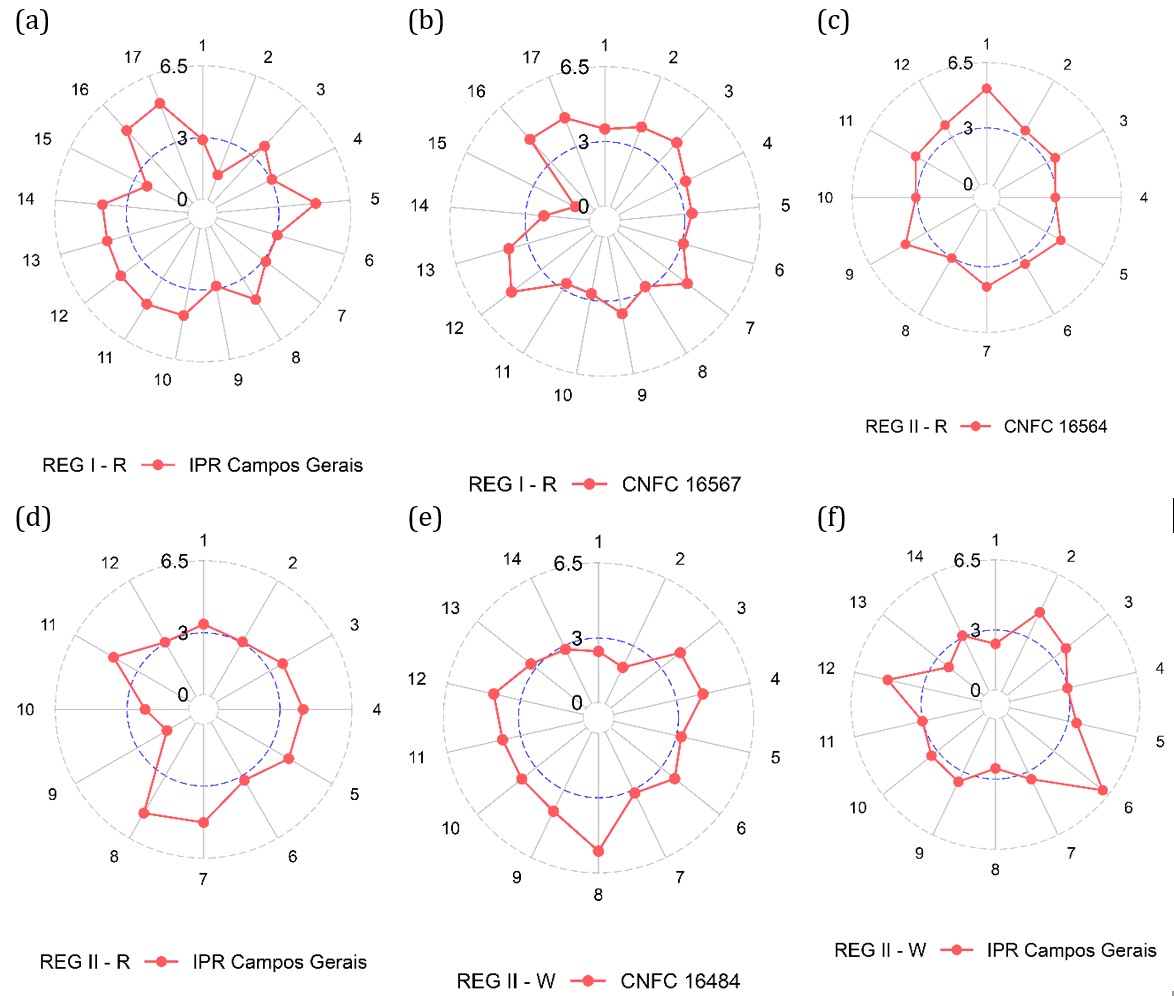
Figure 3. Graphical representation of the performance of one cultivar (IPR Campos Gerais) and lines (CNFC 16567, CNFC 16564 and CNFC 16484) for the grain yield of common bean in region I, in the ‘Rains’ (REG I – R), and region II, in the ‘Rains’ (REG II - R) and “Winter” seasons (REG II – W), according to the methodology of Nunes et al. (2005). The circle represents the mean of the environment (value of the constant associated with variable Z) and the axes represent each of the environments evaluated.
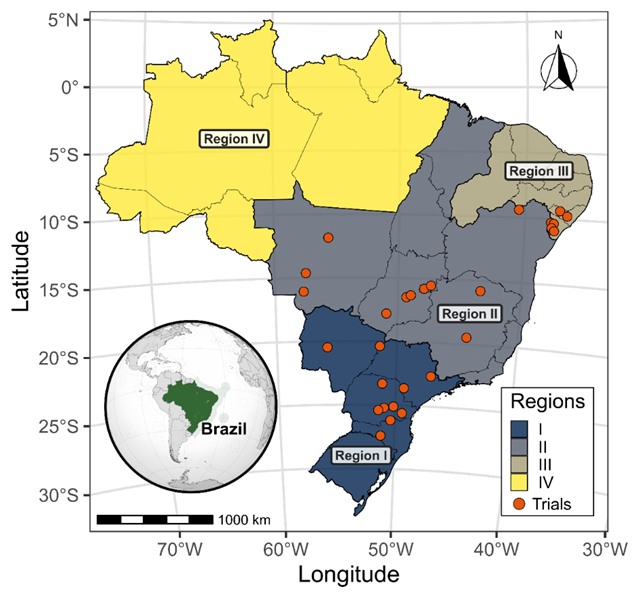
Figure 4. Regionalization of common bean production areas for cultivar recommendation and trial locations in Brazil.
Material and methods
Experimental network, regional stratification, and trial management
The experiments were conducted in a Brazilian network for the evaluation of trials of Value for Cultivation and Use - VCU, totaling 56 environments in the following States: Santa Catarina, Paraná, São Paulo, Minas Gerais, Mato Grosso, Mato Grosso do Sul, Distrito Federal, Bahia, Sergipe, Pernambuco, and Alagoas, in 2018 and 2019, in the harvest seasons named ‘Rains,’ ‘Drought,’ and ‘Winter’. The composition of states in the four producing regions follows the regional characterization and stratification proposed by Pereira et al. (2010a) (Figure 4). The greater representation of states within Regions I, II, and III reflects their importance in common bean production, as these states together account for more than 98% of Brazil’s total common bean production (Embrapa Arroz e Feijão, 2023). The altitude ranged from 149 m to 1171 m, the latitude ranged from 9º 22’ 40’’ to 27º 5’ 42’’, and the longitude ranged from 36º 39’ 39’’ to 57º 40’ 44’’. The geographical coordinates from all cities where the experiments were conducted are available in Table S1 to S4.
The experiments were composed of 16 elite lines (CNFC 16183, CNFC 16484, CNFC 16495, CNFC 16496, CNFC 16497, CNFC 16522, CNFC 16548, CNFC 16558, CNFC 16561, CNFC 16562, CNFC 16563, CNFC 16564, CNFC 16566, CNFC 16567, CNFC 16611 and CNFC 16636) from the common bean breeding program of the Brazilian Agricultural Research Corporation (EMBRAPA), and six commercial cultivars (ANFC09, BRS Estilo, BRS FC402, BRSMG Uai, IPR Campos Gerais and Pérola) of common bean widely used by farmers. The 22 genotypes were evaluated in Embrapa’s National Network of Common Bean Final Trials for cultivar evaluation and release. The pedigree information of the genotypes is presented on Table S8. The experimental design was in randomized blocks with three replications, with plots consisting of four lines of four meters, and 12 seeds per linear meter spaced 0.45 to 0.50 m between rows. All agronomic practices were applied as per the recommendations for the area.
Traits and phenotypic evaluation
The traits evaluated were the yield (GY), stored grain color (SGC), sieve yield (SY), and 100-grain mass (100M). The number of trials in which each trait was evaluated, as well as their distribution across regions, is presented in Tables S5 and S9; differences among traits resulted from logistical constraints within Embrapa’s multi-environment trial network. The yield was estimated by harvesting the two central rows of each plot, whose grains were weighed and the moisture corrected to 13%.
The evaluation of stored grain color was performed using a grade scale from one to five, 90 days after sowing. The grains were stored in a controlled environment (cold room). The evaluation method for SGC was proposed by Silva et al. (2008), adapted by Silva et al. (2014), and used for common bean by Dias et al. (2021) and Pereira et al. (2021): grade 1 corresponds to grains with a very light beige background and light brown streaks; grade 2 corresponds to grains with a light beige background and light brown streaks; grade 3 corresponds to a beige grain background or with brown streaks; grade 4 corresponds to a grain background with a dark beige/grayish color or with dark brown streaks; grade 5 corresponds to a very dark beige grain background or with very dark brown streaks, showing a non-commercial pattern.
Commercial grain quality was determined using 300 g of seeds per sample. A sieve with oblong holes (4.5-mm thick and 22-mm long) was used, and the grains retained in the mesh were weighed. Then, the value obtained was divided by the initial value of the sample to obtain the sieve yield, expressed in percentage. Then, the grains used to determine the sieve yield were used to obtain the 100-grain mass (expressed in grams) using a precision balance.
Statistical analysis
The data obtained for each trait were subjected to individual and joint analysis of variance, where the genotype effect was considered fixed and the environment random. For the individual analysis within each environment, the following randomized complete block design model was fitted (Eq. 1):
\(y_{ij} = \mu\ + \ g_{i} + b_{j}\ + \ e_{ij}\) (Eq. 1)
where \(y_{ij}\) is the observation of the \(i\)-th genotype in the \(j\)-th block; \(\mu\) is the overall mean of the trial; \(g_{i}\) is the fixed effect of the \(i\)-th genotype \((i = 1,\ldots,G)\); \(b_{k}\) is the effect of the \(k\)-th block \((k = 1,\ldots,B)\); and \(e_{ij}\) is the random residual error. When blocks are regarded as random, \(b_{k} \sim N\left( 0,\sigma_{b}^{2} \right)\) and \(e_{ik} \sim N\left( 0,\sigma_{e}^{2} \right)\).
For the combined analysis across environments, the following mixed model was fitted (Eq. 2):
\(y_{ijk} = \mu\ + \ b_{k(j)} + g_{i}\ + \ a_{j}\ + \ {(ga)}_{ij} + e_{ijk}\) (Eq. 2)
where \(y_{ijk}\) is the observation of the \(i\)-th genotype in the \(k\)-th block within the \(j\)-th environment; \(\mu\) is the overall mean; \(g_{i}\) is the fixed effect of the \(i\)-th genotype \((i = 1,\ldots,G)\); \(a_{j}\) is the random effect of the \(j\)-th environment \((j = 1,\ldots,A)\); \(b_{k(j)}\) is the random effect of the \(k\)-th block nested within the \(j\)-th environment \(\left( k = 1,\ldots,B_{j} \right)\); \((ga)_{ij}\) is the random genotype-by-environment interaction effect; and \(e_{ijk}\) is the random residual error. The random effects were assumed to be independent and normally distributed, with \(a_{j} \sim N\left( 0,\sigma_{a}^{2} \right)\), \(b_{k(j)} \sim N\left( 0,\sigma_{b(a)}^{2} \right)\), \((ga)_{ij} \sim N\left( 0,\sigma_{ga}^{2} \right)\), and \(e_{ijk} \sim N\left( 0,\sigma_{e}^{2} \right)\).
Joint analysis of variance was carried out by observing the homogeneity of variances, corrected using the 7:1 ratio of the residual mean squares, as reported by Pimentel-Gomes (2000).
Selection accuracy (AS) was determined according to Resende and Duarte (2007). For the interpretation of the values and limits of the selection accuracy class, the following scale was used for the accuracy classes, according to Resende and Duarte (2007): ≥0.90, very high; <0.90 and ≥0.70, high; <0.70 and ≥0.50, moderate; and <0.50 low. The means were compared using the Scott-Knott test, at 5% probability (Scott and knott, 1974).
Stability and adaptability were measured for the traits and the decompositions of regions and seasons that had a set of more than five assays. The decomposition of crop seasons within regions was defined based on the importance of each growing season for common bean production: region I, ‘rains’ season; region II, ‘rains’ and ‘winter’ seasons; and region III, a single growing season.
The method of Nunes et al. (2005) was employed, in which the means of the genotypes in each environment are standardized using the following expression (Eq. 3):
\(Z_{ij} = \frac{{(x}_{ij} - {\overline{x}}_{.j})}{s_{.j}}\) (Eq. 3)
Where: \(Z_{ij}\): value of the standardized variable corresponding to genotype i in environment j; \(x_{ij}\): mean of genotype i in environment j; (i = 1, 2, ..., n); (j = 1, 2, ..., n); \({\overline{x}}_{.j}\): mean of the environment j; (j = 1, 2, ..., n); \(s_{.j}\): phenotypic standard deviation.
The phenotypic standard deviation can be obtained by the following expression (Eq. 4):
\(S_{.j} = \sqrt{\sum_{i = 1}^{t}\frac{{({\overline{x}}_{ij} - {\overline{x}}_{.j})}^{2}}{t - 1}}\) (Eq. 4)
The values of the standardized variable \(z_{ij}\)were used to construct graphs for each genotype, with the dimensions of the axes (environments) corresponding to the values of each genotype i in environment j. The visualization of the graphs was standardized to evaluate the best line and control.
All statistical analyses were performed using the software R (R Core Team, 2024) and GENES (Cruz, 2016).
Conclusions
There was a significant G×E interaction for all traits in the three regions (I, II, and III).
Line CNFC 16567 was launched for region I and II under the name BRS FC422, due to its yield and wide adaptability.
Line CNFC 16564 was launched and recommended for all producing regions under the name BRS FC416, due to its good performance for grain quality and yield, with stability and wide adaptability.
Acknowledgements
We thank the entire common bean breeding staff at Embrapa, especially the research assistants and field workers, and thank CNPq, for granting a scholarship to the first author.
Author contribution information
Eduardo Almeida Alves: Data curation; Conceptualization; Formal analysis; Investigation; Methodology; Software; Validation; Visualization; Writing-original draft; Writing-review and editing. Saulo Muniz Martins: Formal analysis; Investigation; Writing-review and editing. Luis Claudio de Faria: Investigation. Marcelo Sfeir de Aguiar: Investigation. Patrícia Guimarães Santos Melo: Formal analysis; Investigation; Methodology; Supervision; Validation; Writing-review and editing. Helton Santos Pereira: Conceptualization; Data curation; Formal analysis; Investigation; Methodology; Resources; Validation; Visualization; Writing-review and editing. Leonardo Cunha Melo: Conceptualization; Data curation; Formal analysis; Funding acquisition; Investigation; Methodology; Project administration; Resources; Supervision; Validation; Visualization; Writing-review and editing.
Founding
The authors are grateful to the National Council for Scientific and Technological Development (CNPq) for the Grants to Eduardo Alves, Patrícia Melo, Helton Pereira and Leonardo Melo. This work was supported by the Brazilian Agricultural Research Corporation (EMBRAPA; Grant Number: 20.18.04.008.00.00) and the National Council for Scientific and Technological Development (CNPq; Grant Number: 307171/2022-1).
Declarations
Declaration of Artificial Intelligence (AI)
No AI models were used to prepare this manuscript.
Conflict of interest
The authors declare no conflict of interest.
Consent for publication
The authors give consent for the publication.
Ethics approval and consent to participate
The study followed national/institutional guidelines during the research. All permissions and licenses were obtained in both public and private contexts. All sampling conducted on public and private lands was performed with the required permissions. All directives were conducted with consideration for evaluation in final trials breeding programs.
Data availability
The data that support the findings of this study are not openly available due to reasons of sensitivity and are available from the corresponding author upon reasonable request. Data are located in controlled-access data storage at the Brazilian Agricultural Research Corporation (EMBRAPA).
References
Abrasem (2024) Associação Brasileira de Sementes e Mudas. https://www.abrasem.com.br/estatisticas/
Carloni PR, Melo PGS, Melo LC, Faria LC, Souza TLPO, Almeida VM, Carvalho HWL, Pereira Filho IA, Aguiar MS, Pereira HS (2022) Genotype by environment interaction in common bean cultivars for iron and zinc concentration in grains. Semina:Ciencias Agrarias, 43(4), 1787-1803. https://doi.org/10.5433/1679-0359.2022V43N4P1787
Cruz CD (2016) Genes Software-extended and integrated with the R, Matlab and Selegen. Acta Scientiarum. Agronomy, 38(4), 547-552.
Dias PAS, Almeida DV, Melo PGS, Pereira HS, Melo LC (2021) Effectiveness of breeding selection for grain quality in common bean. Crop Science, 61(2), 1127-1140. https://doi.org/10.1002/csc2.20422
Duarte JB, Vencovsky R (1999) Interação genótipos x ambientes: uma introdução à análise “AMMI”. Série Monografias, (9). Sociedade Brasileira de Genética.
Eberhart SA, Russell WA (1966) Stability Parameters for Comparing Varieties. Crop Science, 6(1), 36-40. https://doi.org/10.2135/cropsci1966.0011183x000600010011x
Embrapa Arroz e Feijão (2023) Dados conjunturais da produção de feijão comum (Phaseolus vulgaris L.) e caupi (Vigna unguiculata (L.) Walp) no Brasil (1985 a 2020): área, produção e rendimento. https://www.cnpaf.embrapa.br/socioeconomia/index.htm
Faria LC, Melo PGS, Pereira HS, Del Peloso MJ, Brás AJBP, Moreira JAA, Carvalho HWL, Melo LC (2013) Genetic progress during 22 years of improvement of carioca-type common bean in Brazil. Field Crops Research, 142, 68-74. https://doi.org/10.1016/j.fcr.2012.11.016
Katuuramu DN, Luyima GB, Nkalubo ST, Wiesinger JA, Kelly JD, Cichy KA (2020) On-farm multi-location evaluation of genotype by environment interactions for seed yield and cooking time in common bean. Scientific Reports, 10(1), 1-12. https://doi.org/10.1038/s41598-020-60087-2
Melo LC, Melo PGS, Faria LC, Diaz JLC, Del Peloso MJ, Rava CA, Costa JGC (2007) Interação com ambientes e estabilidade de genótipos de feijoeiro-comum na Região Centro-Sul do Brasil. Pesquisa Agropecuária Brasileira, 42(5), 715–723. https://doi.org/10.1590/s0100-204x2007000500015
Melo LC, Souza TLPO, Aguiar MS, Faria LC, Costa JGC, Torga PP, Guimarães CM, Carvalho HWL, Almeida VM, Pontes Júnior VA, Pereira HS (2024) BRS FC422: Common bean cultivar with large carioca bean grain and resistance to diseases. Functional Plant Breeding Journal, 6(6). http://dx.doi.org/10.35418/2526-4117/v6a06
Melo PGS, Alvares RC, Pereira HS, Braz AJBP, Faria LC, Melo LC (2018) Adaptability and stability of common bean genotypes in family farming systems. Pesquisa Agropecuaria Brasileira, 53(2), 189–196. https://doi.org/10.1590/S0100-204X2018000200007
Mondo JM, Kimani PM, Narla RD (2019) Genotype x Environment Interactions on Seed Yield of Inter-racial Common Bean Lines in Kenya. World Journal of Agricultural Research, 7(3), 76-87. https://doi.org/10.12691/wjar-7-3-1
Nunes JAR, Ramalho MAP, Abreu ÂFB (2005) Graphical Method in Studies of adaptability and stability of cultivars. Annual Report of the Bean Improvement cooperative. 48, 182-183.
Pereira DG, Faria LC, Torga PP, Souza TLPO, Melo LC, Pereira HS (2020) Genetic potential of fusarium wilt-resistant elite common bean lines assessed in multiple environments. Genetics and Molecular Research, 19(2), 1-13.
Pereira HS, Alvares RC, Silva FC, Faria LC, Melo LC (2017) Genetic, environmental and genotype x environment interaction effects on the common bean grain yield and commercial quality. Semina:Ciencias Agrarias, 38(3), 1241-1250. https://doi.org/10.5433/1679-0359.2017v38n3p1241
Pereira HS, Melo LC, Del Peloso MJ, Faria LC, Wendland A (2011) Complex interaction between genotypes and growing seasons of carioca common bean in Goiás/Distrito Federal. Crop Breeding and Applied Biotechnology, 11(3), 207-215. https://doi.org/10.1590/s1984-70332011000300002
Pereira HS, Melo LC, Faria LC, Del Peloso MJ, Díaz JLC, Wendland A (2010b) Indicação de cultivares de feijoeiro-comum baseada na avaliação conjunta de diferentes épocas de semeadura. Pesquisa Agropecuaria Brasileira, 45(6), 571-578. https://doi.org/10.1590/S0100-204X2010000600006
Pereira HS, Melo LC, Silva SC, Del Peloso MJ, Faria LC, Costa JGC, Magaldi MCS, Wendland A (2010a) Regionalização de áreas produtoras de feijão comum para recomendação de cultivares no Brasil. Embrapa Arroz e Feijão. Comunicado técnico, 187.
Pereira HS, Mendonça FR, Rodrigues LL, Melo LC, Melo PGS, Faria LC, Costa AF, Carvalho HWL, Pereira Filho IA, Almeida VM (2021) Selection of carioca common bean lines with slow darkening. Pesquisa Agropecuaria Brasileira, 56(4). https://doi.org/10.1590/S1678-3921.PAB2021.V56.02471
Pereira HS, Souza TLPO, Aguiar MS, Faria LC, Costa JGC, Torga PP, Martins SM, Guimarães CM, Almeida VM, Melo LC (2024) ‘BRS FC416’: carioca common bean cultivar with high commercial quality of grain and resistance to Fusarium wilt, anthracnose, and common bacterial blight. Functional Plant Breeding Journal, 6(3). http://dx.doi.org/10.35418/2526-4117/v6a03
Pereira, HS, Faria LC, Wendland A, Costa JGC, Souza TLPO, Melo LC (2018) Genotype by environment interaction for disease resistance and other important agronomic traits supporting the indication of common bean cultivars. Euphytica, 214(1), 12. https://doi.org/10.1007/s10681-017-2093-z
Pimentel-Gomes FP (2000) Curso de estatística experimental. Nobel.
R Core Team (2024) R: A language and environment for statistical computing. Foundation for Statistical Computing, Vienna.
Resende MDV, Duarte JB (2007) Precisão e controle de qualidade em experimentos de avaliação de cultivares. Pesquisa Agropecuária Tropical, 37(3), 182-194.
Scott AJ, Knott M (1974) A cluster analysis method for grouping means in the analysis of variance. Biometrics. 30, 507-512. https://doi.org/10.2307/2529204
Silva FC, Melo PGS, Pereira HS, Melo LC (2014) Genetic control and estimation of genetic parameters for seed-coat darkening of carioca beans. Genetics and Molecular Research, 13(3), 6486-6496.
Silva GS, Ramalho MAP, Abreu ÂFB, Silva FB (2008) Genetic control of early grain darkening of carioca common bean. Crop Breeding and Applied Biotechnology, 8(4), 299-304.
Torga PP, Melo PGS, Pereira HS, Faria LC, Del Peloso MJ, Melo LC (2013) Interaction of common beans cultivars of the black group with years, locations and sowing seasons. Euphytica, 189(2), 239-248. https://doi.org/10.1007/s10681-012-0793-y