Australian Journal of Crop Science
Article | https://doi.org/10.21475/ajcs.26.20.10.pne318
Submitted: 07 May 2026 | Revised: 05 August 2026 | Accepted: 06 August 2026
Pages 879–895
A rapid screening approach to assess rice varietal responses to mercury stress
Yummama Karmaita1, Munif Ghulamahdi2*, Didy Sopandie2, Hariyadi2, Irdika Mansur3
1Graduate Program of Agronomy and Horticulture, Department of Agronomy and Horticulture, Faculty of Agriculture, Institut Pertanian Bogor. Jl. Meranti, Kampus IPB Darmaga, Bogor 16680, West Java, Indonesia
2Department of Agronomy and Horticulture, Faculty of Agriculture, Institut Pertanian Bogor. Jl. Meranti, Kampus IPB Darmaga, Bogor 16680, West Java, Indonesia
3Department of Silviculture, Faculty of Forestry and Environment, Institut Pertanian Bogor. Jl. Meranti, Kampus IPB Darmaga, Bogor 16680, West Java, Indonesia
Corresponding author: munif@apps.ipb.ac.id
Abstract: Heavy metal pollutants such as mercury can inhibit rice growth and increase trimercury accumulation in plant tissues. Using a two-stage hydroponic screening method, we assessed varietal tolerance to mercury stress and identified potential cultivars based on their growth response, mercury accumulation, and translocation characteristics. 25 rice types were assessed in the first phase using a split-plot design at five HgCl₂ concentrations (0, 2, 4, 6, and 8 ppm), with three replications per treatment. In the second stage, a completely randomized design was used to assess 16 plants of each variety at 6 ppm HgCl₂ with four replications. Hg uptake, tolerance index (TI), and physical characteristics were among the measured traits. Growth parameters were significantly affected by Hg exposure, with a significant treatment-variety interaction. In the second stage, 16 plants of each variety were evaluated at 6 ppm HgCl₂ with four replications using a completely randomized design. The tolerance index (TI), Hg uptake, and morphological characteristics were among the traits measured. Mercury exposure had a significant impact on growth metrics, with a strong treatment-variety interaction. Varietal responses to Hg stress varied significantly. The Batang Pariaman, IR 64, IPB 9G, Harum, and Sertani stems showed greater tolerance, with TI values of > 0.85. Pariaman, IR 64, and Sertani stems also showed more consistent root growth with increasing Hg concentrations, as indicated by the RRL parameter. Hierarchical clustering, integrating growth characteristics, Hg concentration, and uptake, identified distinct varietal adaptation mechanisms to Hg stress. Batang Pariaman, Bakwan, Srikandi, Banang Pulau and Junjuang stems stood out as attractive choices because they maintained biomass while limiting Hg transport from roots to shoots, indicating greater Hg retention in root tissues. Further validation in Hg-contaminated soil and during the reproductive phase is required to confirm their potential in preventing Hg deposition in rice grains.
Keywords: Nutrient culture; Heavy metal accumulation; Rice plant growth; Rice variety testing; Principal Component Analysis (PCA).
Abbreviations: HgCl₂, mercury(II) chloride; NaOH, sodium hydroxide; HCl, hydrochloric acid.
Contemporary agricultural development often leads to heavy metal pollution of agricultural land (Zwolak et al., 2019), affecting rice, a staple food consumed daily in Asia (Hussain et al., 2021). Recently, many researchers have studied the accumulation of heavy metals in rice. Mercury (Hg) accumulation has attracted worldwide attention owing to its impact on human health and ecosystems (Chen et al., 2024). Gold mining is the primary factor contributing to total Hg contamination (Enamorado-Montes et al., 2021). A recent study in Indonesia examined productive community-owned rice fields used for gold mining in the Sijunjung Regency, West Sumatra. Hg is used in the mining process as an amalgamation agent, resulting in Hg concentrations of 32 mg kg⁻1 in the soil (Gusmini et al., 2023). China's national food safety standard, GB 2762-2022 (Maximum Limits of Contaminants in Food), sets a maximum limit of mercury in cereals and rice of 20 µg kg⁻1, as part of a strategy to manage risks to human health.
Owing to its detrimental impact on human health, mercury-contaminated rice is harmful. Owing to flooding and anaerobic circumstances, when inorganic mercury transforms into methylmercury, the most hazardous and bioaccumulative form, mercury pollution in rice is more complicated. Rice soil is a major reservoir for mercury accumulation, and methylation in this setting raises mercury concentrations in rice (Hang et al., 2018). This condition adversely affects rice growth and development, including inhibition of root growth (Wang et al., 2018), suppression of photosynthesis, yield reduction, disruption of transport systems and water uptake, leaf chlorosis (yellowing), necrosis (tissue death), and inhibition of potassium uptake (Arunrat et al., 2024).
Exposure to Hg can reduce the nutritional quality of rice, rendering it unsafe for consumption. Continuous consumption of Hg-contaminated rice leads to Hg accumulation in the body. The World Health Organization (WHO) considers mercury to be among the 10 most hazardous substances worldwide. Hg in the form of methylmercury at chronic high doses can cause irreversible neurological disorders and impaired fetal neurodevelopment, while chronic exposure to low doses can cause severe pneumonia and respiratory and gastrointestinal disorders (Shi et al., 2026).
Based on the aforementioned issues, an adaptive approach is needed to test the tolerance of rice varieties to Hg stress. The success of this development depends on the selection methods, environments, and criteria used. An effective selection method should be repeatable and easy to apply. The most widely used method is hydroponic culture because it is an effective, rapid screening method and is commonly used for abiotic stress at the early seedling stage, which is the most sensitive phase. Previous research has used this method for rapid selection in rice plants under abiotic stress, such as salinity (Anshori et al., 2021), Fe stress (Nugraha et al., 2016), and Cadmium (Cd) stress in tomato plants (Piotto et al., 2014).
Previous research by Triyanti et al. (2024) conducted Hg tolerance screening during the early vegetative phase using HgCl₂ treatments (0 and 60 mg HgCl₂) on 23 local and national rice varieties grown in soil media. The intricacy of the soil matrix can influence Hg bioavailability and plant responses by altering soil physicochemical properties, such as pH, organic matter content, cation exchange capacity, microbial activity, and the presence of other elements, even though the soil-based approach more closely mimics natural environmental conditions. These circumstances may make it more difficult to precisely link physiological changes to Hg exposure and increase the diversity of plant responses.
The intricacy of the soil matrix can influence Hg bioavailability and plant responses by altering soil physicochemical properties, such as pH, organic matter content, cation exchange capacity, microbial activity, and the presence of other elements. The soil-based approach more closely mimics natural environmental conditions. These circumstances may make it more difficult to precisely link physiological changes to Hg exposure and increase the diversity of plant responses. The creation of a two-stage hydroponic screening framework based on a gradient of HgCl₂ concentration makes this study novel.
The first stage evaluated the initial growth response based on relative root length (RRL), root growth characteristics, biomass, and leaf greenness index (SPAD) to obtain a more comprehensive genotype dose-response pattern at concentrations of 0, 2, 4, 6, and 8 ppm. The second stage integrates the characterization of Hg accumulation and distribution by measuring Hg concentration in roots and shoots, Hg uptake, and translocation factor (TF), thereby allowing separation between growth-maintenance-based tolerance mechanisms and mechanisms regulating Hg accumulation and translocation in plant tissues. The results of this study provide a scientific basis for identifying potential candidate varieties for further validation under Hg-contaminated soil conditions, including evaluation during the reproductive phase and measurement of Hg accumulation in grains as an indicator of relevance to food safety.
Table 2 shows a significant interaction between Hg concentration and rice variety for all observed variables, namely root length, dry weight of the shoot (combination of stem and leaves), dry weight of the root, biomass, root volume, SPAD, relative root length (RRL), relative biomass, and tolerance index (TI). These findings indicate that the physiological responses and growth of rice to Hg stress are genotype-specific, with each variety showing different levels of tolerance to Hg accumulation and toxicity. The negative responses across most parameters indicated that increased Hg concentrations consistently suppressed plant growth and physiological activity. This is in line with the mechanism of Hg toxicity that can disrupt nutrient absorption and water transport, thereby inhibiting root development (Triyanti et al., 2024) and inducing the formation of reactive oxygen species (ROS), which then causes extensive damage to proteins, nucleic acids, and lipids, ultimately leading to cell death (Yang et al., 2023). Significant variations across all metrics suggest a genotype-dependent response, with some cultivars retaining superior growth and physiological functions under mercury stress.
Table 2. Analysis of variance (ANOVA) for evaluating the effects of Hg concentration, rice varieties, and their interaction on growth, physiological, and stress indices.
| Response | Source | Degrees of freedom | F value | p value | Significance |
|---|---|---|---|---|---|
| Root Length (cm) | Hg | 4 | 131.84 | 0.00 | * |
| Error (a) | 10 | - | - | - | |
| Varieties | 24 | 54.80 | 0.00 | * | |
| Hg x Varieties | 96 | 9.04 | 0.00 | * | |
| Error (b) | 240 | - | - | - | |
| Shoot dry weight (g) | Hg | 4 | 2749.55 | 0.00 | * |
| Error (a) | 10 | - | - | - | |
| Varieties | 24 | 260.70 | 0.00 | * | |
| Hg x Varieties | 96 | 48.22 | 0.00 | * | |
| Error (b) | 240 | - | - | - | |
| Root dry weight (g) | Hg | 4 | 68.82 | 0.00 | * |
| Error (a) | 10 | - | - | - | |
| Varieties | 24 | 20.87 | 0.00 | * | |
| Hg x Varieties | 96 | 6.13 | 0.00 | * | |
| Error (b) | 240 | - | - | - | |
| Biomass (g) | Hg | 4 | 955.79 | 0.00 | * |
| Error (a) | 10 | - | - | - | |
| Varieties | 24 | 185.8 | 0.00 | * | |
| Hg x Varieties | 96 | 35.53 | 0.00 | * | |
| Error (b) | 240 | - | - | - | |
| Root Volume (mL) | Hg | 4 | 4462.35 | 0 | * |
| Error (a) | 10 | - | - | - | |
| Varieties | 24 | 597.08 | 0 | * | |
| Hg x Varieties | 96 | 96.13 | 0 | * | |
| Error (b) | 240 | - | - | - | |
| SPAD value / Chlorophyll content index | Hg | 4 | 3294.56 | 0 | * |
| Error (a) | 10 | - | - | - | |
| Varieties | 24 | 383.41 | 0 | * | |
| Hg x Varieties | 96 | 91.19 | 0 | * | |
| Error (b) | 240 | - | - | - | |
| Relative root length (% | Hg | 4 | 120.26 | 0 | * |
| Error (a) | 10 | ||||
| Varieties | 24 | 17.41 | 0 | * | |
| Hg x Varieties | 96 | 4.29 | 0 | * | |
| Error (b) | 240 | - | - | - | |
| Relative biomass (%) | Hg | 4 | 505.99 | 0 | * |
| Error (a) | 10 | - | - | - | |
| Varieties | 24 | 48.15 | 0 | * | |
| Hg x Varieties | 96 | 12.47 | 0 | * | |
| Error (b) | 240 | - | - | - | |
| TI | Hg | 4 | 505.99 | 0 | * |
| Error (a) | 10 | - | - | - | |
| Varieties | 24 | 48.15 | 0 | * | |
| Hg x Varieties | 96 | 12.47 | 0 | * | |
| Error (b) | 240 | - | - | - |
Values are marked with * indicating significance at p < 0.05.
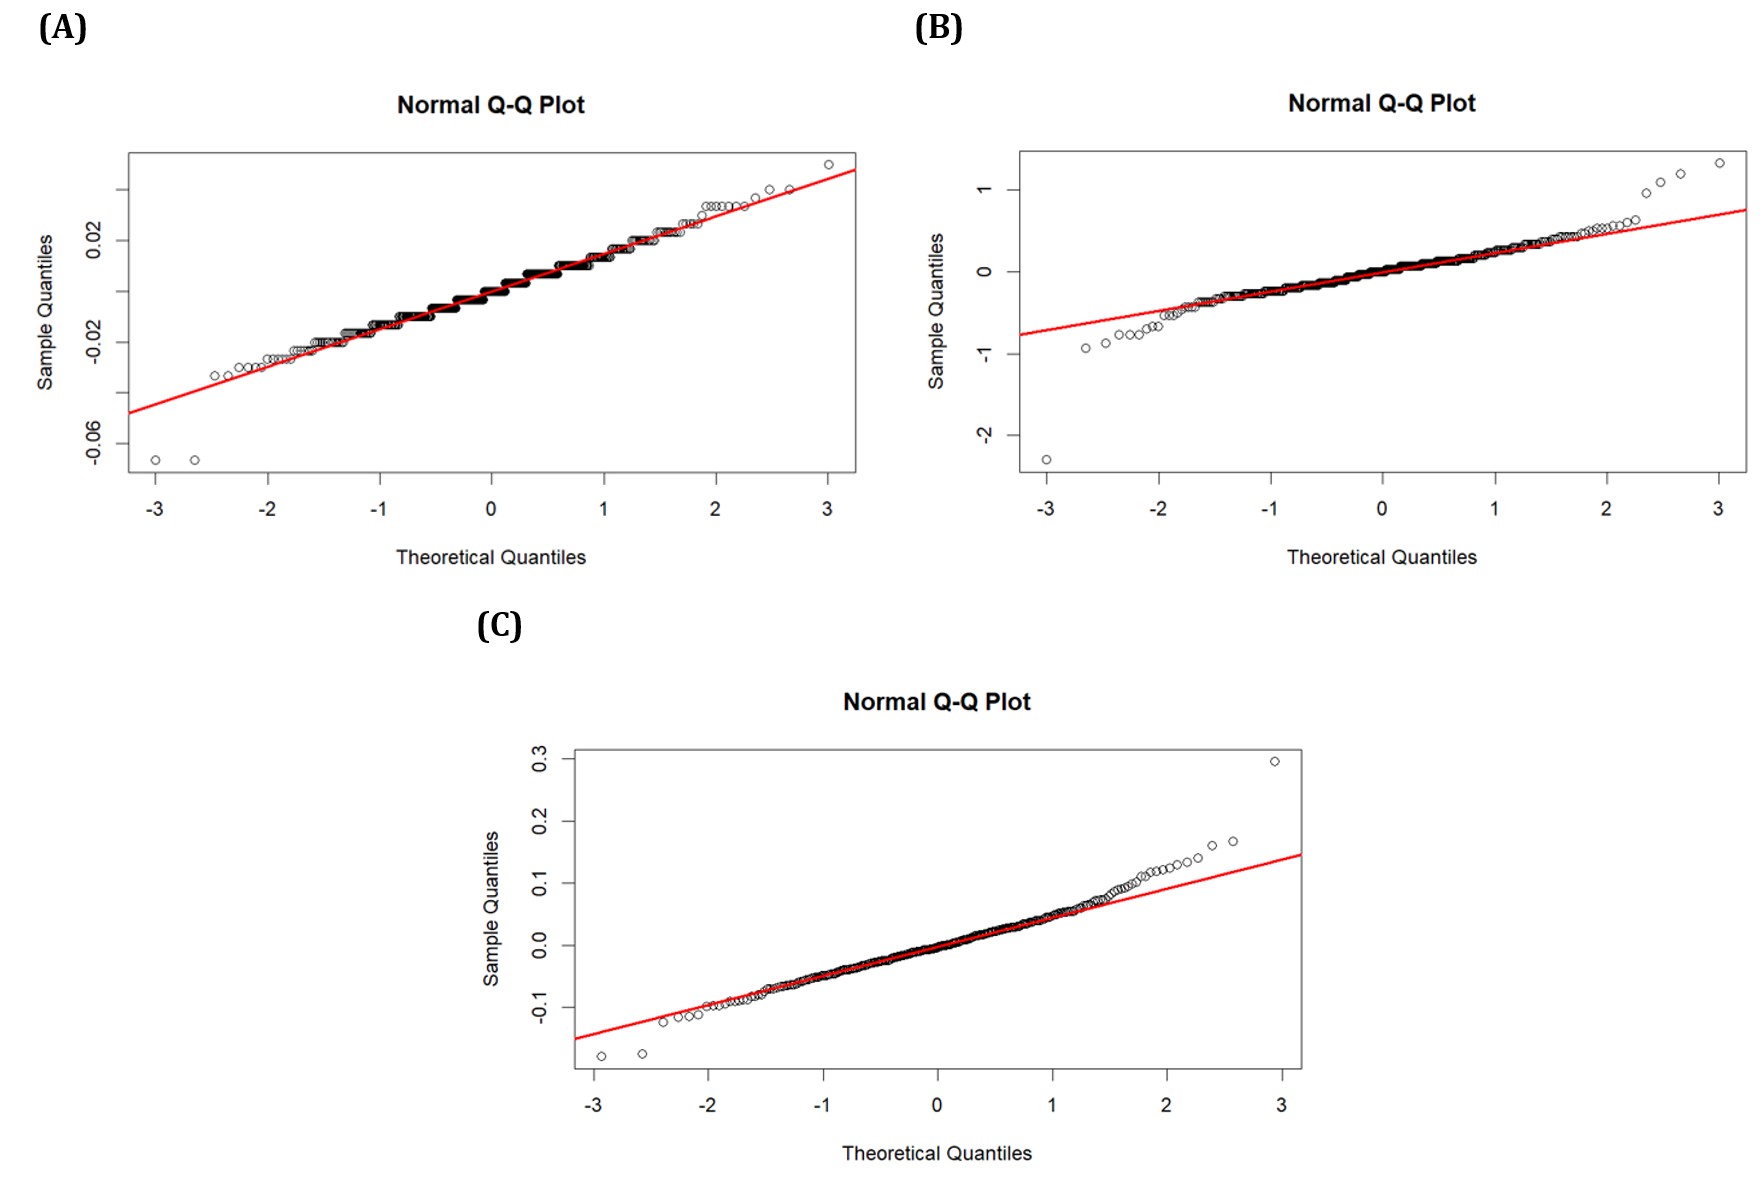
The majority of the parameter variables had p-values > 0.05, according to the Shapiro-Wilk test results, suggesting that the residuals were normally distributed (Table 3). Nevertheless, p-values < 0.05 for root volume, SPAD, and relative root length indicate that the residual data are not normally distributed. The residual distributions for these three parameters typically remained approximately normal, as indicated by the normal probability plot (Q–Q plot), with slight deviations at the heads and tails of the distributions (Fig. 1). This suggests that the deviation from normalcy is minimal and remains within the ANOVA's tolerance bonds. The assumption of homogeneity of variances is also supported by Levene's test, which yields a p-value of > 0.05, indicating that the variances across the treatments are homogeneous. All things considered, the ANOVA model was appropriate for further analysis.
Table 3. Results of Shapiro–Wilk and Levene tests for ANOVA assumption checking.
| Response | Shapiro–Wilk (p value) | Levene (p value) | CV (a) (%) | CV (b) (%) | Transformation |
|---|---|---|---|---|---|
| Root Length (cm) | 0.39ns | 1.00ns | 20.87 | 4.83 | Not required |
| Shoot dry weight (g) | 0.11ns | 1.00ns | 6.43 | 4.47 | Not required |
| Root dry weight (g) | 0.06ns | 1.00ns | 30.36 | 12.98 | Not required |
| Biomass (g) | 0.45ns | 1.00 ns | 10.26 | 4.97 | Not required |
| Root Volume (mL) | 0.0004* | 1.00 ns | 2.32 | 1.63 | square-root transformation, not successful |
| SPAD value / Chlorophyll content index | 0.0001* | 0.999 ns | 1.65 | 1.21 | square-root transformation, not successful |
| Relative root length (RRL) (%) | 0.0004* | 0.993 ns | 17.98 | 6.63 | square-root transformation, not successful |
| Relative Biomass (RB) (%) | 0.1009 ns | 1.00 ns | 8.26 | 3.72 | square-root transformation |
| Tolerance Index (TI) | 0.1008ns | 0.996 ns | 8.26 | 3.72 | square-root transformation |
Note: ns = not significant (p > 0.05), indicating that the assumption of normality (Shapiro–Wilk test) or homogeneity of variance (Levene’s test) was met; * = significant (p < 0.05), indicating a violation of the corresponding assumption. coefficient of variation (CV).
Fig. 1. Normal probability (Q–Q) plots for (A) root volume at HgCl₂ concentrations (0, 2, 4, 6, and 8 ppm), (B) SPAD at HgCl₂ concentrations (0, 2, 4, 6, and 8 ppm), and (C) RRL at HgCl₂ concentrations (2, 4, 6, and 8 ppm).
The integration of multiple analytical techniques, such as RRL response (Table 4), data variation indicated by CV values (Table 4), separation patterns between varieties through boxplots (Fig. 2), and clustering patterns based on PCA analysis (Fig. 3), was used to determine the most discriminative Hg concentration. All the rice types studied showed a significant decrease in relative root length (RRL) with increasing mercury levels. In general, the 2-ppm treatment had the highest RRL, which dropped to 4 and 6 ppm before reaching the lowest value at 8 ppm. This trend suggests a dose-dependent response, in which physiological disruptions in the root system led to greater restriction of root growth at higher levels of Hg toxicity. Additional testing reveals that some varieties, Batang Pariaman, Ciherang, Harum, IPB 3S, IR 64, Jeliteng, Kuniang Aro, Sertani, and Srikandi, consistently maintain higher RRL values at all Hg levels, while other varieties, Ceredek, Payuang Onam-onam, Putiah, and Putri Minang, experience a decline.
Table 4. Effects of Hg concentration and rice varieties interaction on relative root length (RRL).
| Variety | 2 ppm | 4 ppm | 6 ppm | 8 ppm | ||||
|---|---|---|---|---|---|---|---|---|
| RRL (%) | Class | RRL (%) | Class | RRL (%) | Class | RRL (%) | Class | |
| Bakwan | 86.47±2.011 a-e | T | 69.65±3.69 b-d | M | 72.76±1.57 b-f | T | 39.65±1.96 c-e | S |
| Banang Pulau | 76.14±3.86 e-f | T | 66.64±1.23 b-d | M | 73.98±3.05 b-f | T | 45.48±0.36 b-e | S |
| Batang Pariaman | 79.45±3.01 c-f | T | 73.66± 0.87 a-c | T | 85.93±3.97 a-b | T | 45.24±1.46 b-e | S |
| Bujang Marantau | 80.76±2.37c-f | T | 61.77±4.05 c-d | S | 68.06±4.46 d-g | M | 38.39±2.88 e | S |
| Cakra Buana | 75.15±1.75e-f | T | 68.88±0.33 b-d | M | 69.32±4.05 c-g | M | 51.37±6.80 a-e | S |
| Ceredek | 75.44±2.31e-f | T | 69.74±2.45 b-d | M | 56.25±2.38 g | S | 38.67±1.47 e | S |
| Ciherang | 78.21±2.35 c-f | T | 71.72±0.66 b-d | T | 73.52± 3.83 b-f | T | 52.40±4.93 a-d | S |
| Cisokan | 74.81±0.77e-f | T | 63.96±0.67 c-d | M | 63.73±1.45 e-g | M | 41.70±2.28 c-e | S |
| Harum | 90.03±2.19 a-d | T | 72.23± 2.72 b-d | T | 75.98±0.70 a-e | T | 47.36±6.25 a-e | S |
| IPB 3S | 82.06±3.30 b-f | T | 74.29±2.28 a-c | T | 82.03±5.04 a-c | T | 53.14±0.23 a-c | S |
| IPB 9G | 85.34±1.78 a-e | T | 66.53±0.90 b-d | M | 80.99±1.86 a-d | T | 55.43±2.67 a-b | S |
| IR 64 | 98.14±2.12 a | T | 87.23±2.41 a | T | 88.66±5.86 a | T | 59.73±1.91 a | S |
| Jeliteng | 90.82±3.89 a-d | T | 72.53± 2.23 b-d | T | 85.58±4.58 a-b | T | 52.62±4.83 a-d | S |
| Junjuang | 81.92±3.05 b-f | T | 68.25±4.81 b-d | M | 73.93± 1.77 b-f | T | 43.28±3.63 b-e | S |
| Kuniang Aro | 81.55±3.74 c-f | T | 79.01±6.02 a-b | T | 71.74±2.00 c-f | T | 50.90±1.32 a-e | S |
| Kuniang Pinang | 91.91±1.60 a-c | T | 59.26±1.91 d | S | 66.29±1.07 e-g | M | 39.76±4.73 c-e | S |
| Kuniang Tambago | 91.49±1.54 a-c | T | 64.55±1.05 c-d | M | 81.47±1.53 a-d | T | 44.60±2.07 b-e | S |
| Kuriak Kusuik | 88.08±1.31 a-e | T | 70.77±1.42 b-d | M | 69.31±2.31 c-g | M | 41.61±1.61 c-e | S |
| Pandan Wangi | 80.09±0.56 c-f | T | 74.97±4.12 abc | T | 68.55±1.16 c-g | M | 49.54±2.18 a-e | S |
| Payuang Onam-onam | 82.27±2.07 b-f | T | 70.15±2.62 bcd | M | 61.20±2.49 f-g | S | 46.15±2.75 a-e | S |
| Putiah | 95.44±1.84 a-b | T | 61.99±1.17 cd | S | 62.28±2.87 e-g | S | 38.99±6.22 d-e | S |
| Putri Minang | 77.68±1.64 d-f | T | 59.39±1.39 d | S | 60.86±1.71 f-g | S | 39.37±1.96 d-e | S |
| Sertani | 87.80±2.55 a-e | T | 78.88±4.31 ab | T | 82.26±3.02 a-c | T | 56.22±1.93 a-b | S |
| Srikandi | 80.69±1.59 c-f | T | 74.29±2.52 abc | T | 72.62±2.14 b-f | T | 43.57±1.77 b-e | S |
| Tarabas | 69.02±3.09 f | M | 72.57±3.25 bcd | T | 72.44±3.50 b-f | T | 47.65±3.72 a-e | S |
| CV (%) | 9.43 | 10.71 | 13.86 | 16.71 | ||||
Note: Values are presented as mean ± standard error (SE), coefficient of variation (CV). Different letters within the same column indicate significant differences among treatments based on Tukey’s HSD test at p < 0.05. Rice varieties were classified into tolerance groups based on relative root length (RRL) thresholds under Hg stress conditions: T, tolerant (>71%); M, moderate (63–70%); and S, sensitive (<63%) (Triyanti et al., 2024).
Based on the tolerance classification, varieties that showed a relatively small decrease in RRL were categorized as tolerant (RRL>71%), while varieties with moderate decreases were classified as moderate (RRL>63-70%) and sensitive (RRL<63%). These results indicate a diversity in tolerance levels among the 25 tested rice varieties, which can serve as a basis for selecting potential varieties for Hg-contaminated soils. The most tolerant varieties were IR 64, Batang Pariaman, and Jeliteng, which had RRL values above 85% in the 6 ppm treatment. The most sensitive are Ceredek, Kuriak Kusuik, Putiah, and Putri Minang. At high concentrations, Hg exposure reduces important growth parameters and affects plant metabolic processes, including decreases in carbohydrate and protein levels and antioxidant enzyme activity (Mani et al., 2024; Mani et al., 2025). The reduction in root length at high Hg concentrations may also indicate inhibition of physiological processes in plants, such as water and nutrient transport, which depend heavily on root integrity (Meng et al., 2014). Wang et al. (2013) also reported that relative root length is used as an indicator of mercury tolerance in rice plants. Varieties that are more tolerant to Hg can be more efficient in translocating and accumulating heavy metals, allowing them to survive under more contaminated conditions. Among the tested concentrations, 6 ppm HgCl₂ provided the highest discriminatory capacity for varietal screening. This concentration showed greater phenotypic variation based on CV analysis (13.86%) than 2 and 4 ppm, while maintaining sufficient variation among the genotypes. In contrast, 2 ppm induced mild stress with limited differentiation, whereas 8 ppm caused severe growth inhibition across most varieties, reducing the ability to distinguish genotypic variations.
Boxplot analysis also showed that 6 ppm produced the widest interquartile range and clearer median separation between varieties, indicating stronger differentiation in growth performance at this stress level (Fig. 2). Furthermore, this was reinforced by the PCA results (Fig. 3), which showed a clearer, more dispersed genotype distribution at 6 ppm compared with a more clustered pattern at 2 ppm and a highly compressed distribution at 8 ppm. Overall, this supporting evidence indicates that 6 ppm Hg is the optimal intermediate stress level, because it can balance the intensity of physiological stress and genotypic resolution. Therefore, this concentration provides the most informative conditions for distinguishing responses to Hg exposure and identifying differences in tolerance mechanisms.
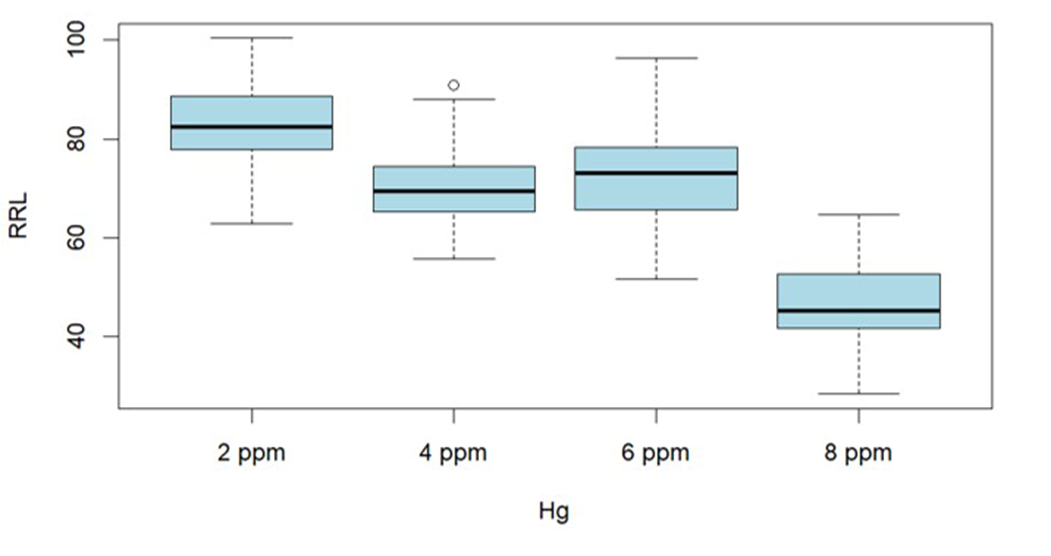
Fig. 2. Distribution of relative root length (RRL) across treatments using box plot analysis at HgCl₂ concentrations (2, 4, 6, and 8 ppm).
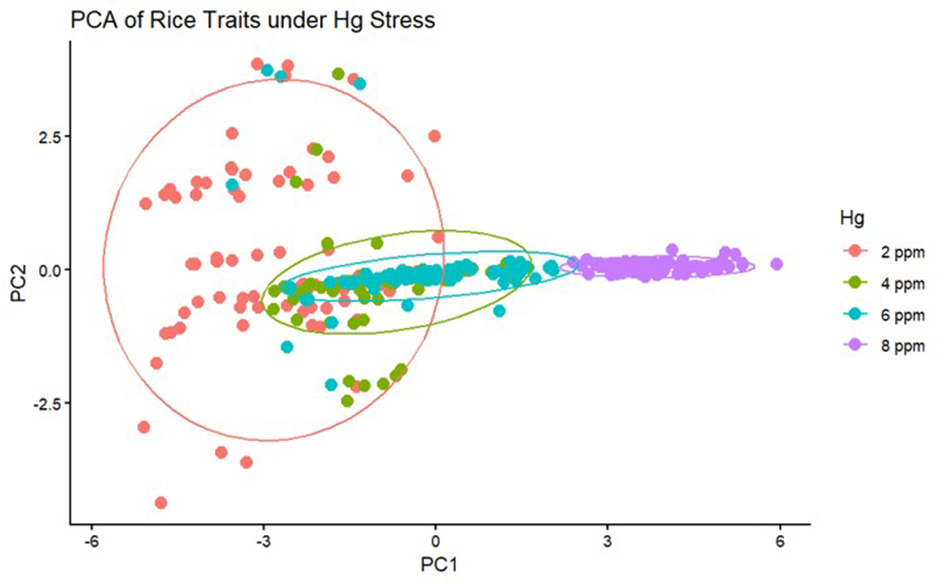
Fig. 3. PCA of rice traits under Hg stress at HgCl₂ concentrations (2, 4, 6, and 8 ppm).
Compared with the other cultivars, Harum and Batang Pariaman showed better growth performance under 6 ppm Hg stress (Table 5), as evidenced by increased biomass accumulation, root development, and physiological activity. Batang Pariaman maintained higher root length, biomass production, and leaf greenness (SPAD), while Harum displayed the highest root and shoot biomass and root volume. Payuang Onam-onam and Tarabas, on the other hand, showed diminished growth responses, especially in biomass accumulation and root development. As evidenced by a decrease in root length of approximately 61.20% compared with the best-performing genotype and a lower RRL value, Payuang Onam-onam's inferior growth performance suggested a greater inhibitory effect of Hg poisoning on root growth (Table 4). This result is consistent with that of Huang et al. (2022), who discovered that under 160 μM Hg stress, root length drastically decreased by 27.9%. However, it did sustain good root length performance with an RRL value of 72.44% at 6 ppm Hg, in contrast to the Tarabas variety, which showed poor growth performance.
Table 5. Growth characteristics of rice varieties at 6 ppm HgCl₂.
| Variety | Root length | Shoot dry weight | Root dry weight | Biomass | Root volume | SPAD |
|---|---|---|---|---|---|---|
| Bakwan | 19.87 ±0.55 b-d | 0.16±0.003 e-g | 0.047±0.007 a-d | 0.210±0.010 d-g | 0.620±0.010 f-g | 31.033±0.145 b-c |
| Banang Pulau | 20.23 ±1.07 a-c | 0.15±0.003 g-j | 0.040±0.006 b-e | 0.187±0.009 g-i | 0.547±0.012 h-j | 31.800±1.150 b |
| Batang Pariaman | 22.93 ±1.05 a | 0.20±0.003 a-b | 0.063±0.003 a | 0.267±0.003 a-b | 0.757±0.009 c | 33.100±0.173 a |
| Bujang Marantau | 18.30 ±1.31 c-g | 0.12±0.003 k | 0.033±0.003 d-e | 0.150±0.006 j-k | 0.447±0.007 m | 25.033±0.088 j |
| Cakra Buana | 17.23 ±1.07 d-i | 0.11±0.003 k | 0.033±0.003 d-e | 0.147±0.003 k | 0.463±0.007 lm | 30.233±0.120 c-d |
| Ceredek | 15.13 ±0.68 i-j | 0.14±0.003 g-j | 0.040±0.006 b-e | 0.183±0.009 g-j | 0.513±0.007 j-l | 29.700±0.058 d-e |
| Ciherang | 16.53 ±0.80 f-i | 0.13±0.006 a-k | 0.057±0.003 a-b | 0.187±0.007 g-i | 0.527±0.015 i-k | 26.267±0.088 i |
| Cisokan | 15.27 ±0.22 h-j | 0.15±0.003 g-j | 0.050±0.006 a-d | 0.197±0.009 f-i | 0.610±0.010 g | 29.267±0.203 d-g |
| Harum | 19.43 ±0.83 c-e | 0.22±0.003 a | 0.063±0.003 a | 0.287±0.007 a | 0.933±0.009 a | 28.267±0.120 g-h |
| IPB 3S | 22.57±0.81 a-b | 0.19±0.000 b-d | 0.060±0.006 a | 0.250±0.006 b-c | 0.863±0.019 b | 28.700±0.153 e-h |
| IPB 9G | 18.97±0.77 c-g | 0.17±0.003 d-g | 0.047±0.007 a-d | 0.213±0.009 d-g | 0.493±0.007 j-m | 27.700±0.173 h |
| IR 64 | 17.37±1.08 d-i | 0.16±0.007 e-g | 0.053±0.003 a-c | 0.217±0.003 c-g | 0.727±0.015 c-d | 30.133±0.186 c-d |
| Jeliteng | 18.97±1.28 c-g | 0.15±0.007 f-i | 0.050±0.000 a-d | 0.203±0.007 e-h | 0.593±0.007 g-h | 31.500±0.208 b |
| Junjuang | 19.23±0.77 c-f | 0.18±0.009 b-e | 0.053±0.003 a-c | 0.237±0.012 b-e | 0.630±0.010 e-g | 31.133±0.033 b-c |
| Kuniang Aro | 14.70±0.30 i-j | 0.19±0.006 b-d | 0.053±0.003 a-c | 0.243±0.007 b-d | 0.727±0.003 c-d | 28.433±0.120 f-h |
| Kuniang Pinang | 18.00±0.00 c-h | 0.20±0.003 b-c | 0.047±0.003 a-d | 0.243±0.007 b-d | 0.667±0.017 e-f | 24.467±0.176 j-k |
| Kuniang Tambago | 22.30±0.56 a-b | 0.16±0.003 f-h | 0.050±0.006 a-d | 0.207±0.009 e-h | 0.750±0.006 c | 29.667±0.176 d-e |
| Kuriak Kusuik | 20.3±0.97 a-c | 0.17±0.003 c-f | 0.060±0.006 a | 0.233±0.007 b-e | 0.850±0.012 b | 33.333±0.233 a |
| Pandan Wangi | 17.00±0.40 e-i | 0.14±0.003 h-k | 0.037±0.007 c-e | 0.173±0.009 h-k | 0.483±0.017 k-m | 21.567±0.273 l |
| Payuang Onam-onam | 13.63±0.90 j | 0.11±0.003 k | 0.033±0.003 d-e | 0.147±0.003 k | 0.360±0.010 n | 29.500±0.115 d-f |
| Putiah | 16.30±0.15 g-j | 0.19±0.000 b-d | 0.060±0.006 a | 0.250±0.012 b-c | 0.683±0.009 d-e | 23.833±0.033 k |
| Putri Minang | 18.43±0.76 c-g | 0.13±0.003 j-k | 0.040±0.000 b-e | 0.167±0003 i-k | 0.450±0.017 m | 29.667±0.233 de |
| Sentani | 18.47±1.25 c-g | 0.17±0.003 c-f | 0.053±0.003 a-c | 0.227±0.007 c-f | 0.753±0.003 c | 26.200±0.058 i |
| Srikandi | 20.57±0.47 a-c | 0.16±0.003 f-h | 0.047±0.003 a-d | 0.203±0.007 e-h | 0.577±0.015 g-i | 29.267±0.219 d-g |
| Tarabas | 16.40±0.10 g-i | 0.08±0.003 l | 0.027±0.003 e | 0.110±0.006 i | 0.293±0.007 o | 27.733±0.133 h |
| CV (%) | 14.49 | 21.01 | 25.072 | 20.84 | 25.84 | 9.97 |
Values are presented as mean ± standard error (SE). Different lowercase letters within the same column indicate significant differences among treatments based on Tukey’s HSD test at p < 0.05. Different uppercase letters indicate significant differences among Hg concentrations at p <0.05 (if applicable). CV (%) = coefficient of variation; SE = standard error.
Through a variety of processes, including altering membrane composition, activating antioxidant defense systems, and controlling osmolytes and protein metabolism, tolerant cultivars can enhance their tolerance to mercury (Yang et al., 2023). By promoting cell wall lignification, increasing Hg binding in root tissues, and reducing Hg transit into the circulatory system, cysteine (Cys) and glutathione (GSH) also play crucial roles in Hg detoxification (Kim et al., 2026). Moreover, Hg sequestration and reduced cellular oxidative damage are facilitated by increased activity of antioxidant enzymes, such as superoxide dismutase (SOD), catalase (CAT), and peroxidase (POD), as well as by increased glutathione and phytochelatin metabolism (Huang et al., 2022). The Harum and Batang Pariaman varieties showed better growth, but this does not necessarily indicate that the plants were exposed to low levels of Hg or did not experience metabolic disturbances. Plants can maintain growth through physiological compensation mechanisms, but toxic processes still occur at the cellular level. Therefore, the evaluation of Hg tolerance should be supported by indicators of Hg content in tissues
Table 6 shows that the Batang Pariaman, IPB 9G, IR-64, Harum, and Sertani varieties had relatively high RB (>85%) and TI (>0.85) values, and relatively low SSI (<0.35) values. The response pattern indicates that these varieties have a better ability to adapt to stress conditions, as they can maintain biomass relatively well, even under environmental pressure. A high TI value reflects the genotype's capacity to maintain growth and basic metabolic functions under stress conditions, whereas a negative SSI value indicates that the reduction in biomass under stress is lower than that under normal conditions. This phenomenon indicates the presence of tolerance mechanisms that involve resource-use efficiency, maintenance of photosynthetic activity, and regulation of physiological and biochemical processes to minimize the negative impact of stress. In contrast, the Payuang Onam-onam, Putri Minang, and Ceredek cultivars had SSI values greater than 2.00, TI values less than 0.55, and RB values less than 55.00%. This suggests that under mercury stress, these three types have a comparatively poor capacity to sustain growth. Their detoxification and oxidative stress regulatory systems, photosynthetic activity, metabolite use efficiency, and other critical physiological processes may contribute to their greater vulnerability to Hg toxicity.
Table 6. Relative biomass, tolerance index and stress susceptibility index of rice varieties at 6 ppm HgCl₂
| Variety | RB | TI | SSI |
|---|---|---|---|
| Bakwan | 53.869±2.663 f-h | 0.539±0.027 f-h | 1.792 |
| Banang Pulau | 54.461±3.175 f-h | 0.545±0.032 f-h | 1.755 |
| Batang Pariaman | 106.782±2.859 a | 1.068±0.029 a | -0.131 |
| Bujang Marantau | 53.532±0.959 f-h | 0.535±0.010 f-h | 1.812 |
| Cakra Buana | 65.839±3.064 d-f | 0.658±0.031 d-f | 1.093 |
| Ceredek | 50.049±2.754 g-h | 0.501±0.028 g-h | 2.091 |
| Ciherang | 74.855±4.314 c-e | 0.749±0.043 c-d | 0.709 |
| Cisokan | 73.694±2.475 c-e | 0.737±0.025 c-d | 0.744 |
| Harum | 89.583±2.083 a-c | 0.896±0.021 a-c | 0.243 |
| IPB 3S | 60.976±1.408 e-g | 0.610±0.014 e-g | 1.338 |
| IPB 9G | 93.152±6.036 a-b | 0.932±0.060 a-b | 0.163 |
| IR 64 | 89.256±3.305 a-c | 0.893±0.033 a-c | 0.257 |
| Jeliteng | 74.542±3.734 c-e | 0.745±0.037 c-e | 0.720 |
| Junjuang | 54.193±2.648 f-h | 0.542±0.026 f-h | 1.767 |
| Kuniang Aro | 77.655±1.877 b-d | 0.777±0.019 b-d | 0.601 |
| Kuniang Pinang | 75.236±0.521 c-e | 0.752±0.005 c-e | 0.687 |
| Kuniang Tambago | 76.543±3.266 b-d | 0.765±0.033 b-d | 0.641 |
| Kuriak Kusuik | 67.429±3.159 d-f | 0.674±0.032 d-f | 1.016 |
| Pandan Wangi | 74.759±6.470 c-e | 0.748±0.065 c-e | 0.724 |
| Payuang Onam-onam | 46.433±2.198 h-i | 0.464±0.022 h-i | 2.424 |
| Putiah | 76.471± 2.328 b-d | 0.765±0.023 b-d | 0.641 |
| Putri Minang | 37.593±0.663 i | 0.376±0.007 i | 3.471 |
| Sertani | 86.135±3.216 b-c | 0.861±0.032 b-c | 0.338 |
| Srikandi | 58.752±2.707 f-h | 0.588±0.027 f-h | 1.474 |
| Tarabas | 86.752±2.802 b-c | 0.868±0.028 b-c | 0.317 |
| CV (%) | 24.25 | 24.25 | - |
Values are presented as mean ± standard error (SE). Different lowercase letters within the same column indicate significant differences among treatments based on Tukey’s HSD test at p < 0.05. Different uppercase letters indicate significant differences among Hg concentrations at p <0.05 (if applicable). CV (%) = coefficient of variation; SE = standard error.
To assess the connections between the growth and physiological traits of the rice plants under observation, Pearson correlation analysis was performed. Based on the correlation coefficients (r), the correlation matrix (Fig. 4) shows the relationships between the parameters. Root development, biomass accumulation, and physiological performance were weakly to moderately positively correlated with root length (RL), root dry weight (RDW) (r = 0.30), shoot dry weight (SDW) (r = 0.35), root volume (RV) (r = 0.37), and SPAD value (r = 0.25). Root dry weight (RDW) exhibited strong positive correlations with shoot dry weight (SDW) (r = 0.85) and root volume (RV) (r = 0.88). In contrast, RDW showed a weak positive association with the SPAD value (r = 0.19). These findings show that while there is little correlation between root biomass accumulation and leaf physiological state, it is strongly linked to increased shoot biomass output and root system growth. There was a significant positive correlation (r = 0.80) between shoot dry weight (SDW) and root volume (RV). In contrast, there was a marginally positive correlation (r = 0.08) between SDW and SPAD. These results show that while there is little correlation between shoot biomass and leaf physiological conditions, as measured by SPAD values, there is a strong correlation between shoot biomass accumulation and root system development. Growth-related characteristics and SPAD values had a weakly positive connection (r = 0.20). This suggests a limited linear correlation between changes in plant growth characteristics and variations in leaf chlorophyll status, as indicated by the SPAD values.
Kaiser–Meyer–Olkin (KMO) and Bartlett's sphericity tests were used to evaluate data adequacy before principal component analysis (PCA). They assessed sample adequacy and confirmed the presence of sufficient correlations between variables. With an Overall Measure of Sampling Adequacy (MSA) of 0.78 and significant findings (p < 0.001), the results show that the observed correlation matrix between characters is sufficiently adequate (acceptable) for PCA. Additionally, the Bartlett test showed significant results, with a chi-square value of 77.23, 10 degrees of freedom, and a p-value of 1.7 × 10⁻¹², indicating that the data were suitable for PCA analysis. The principal components have eigenvalues greater than 2, specifically 3.11, and can explain 62.21% of character variance. Two other principal components had eigenvalues less than 2 (Table 7). This indicates that the first component is the most significant in explaining the variation in rice varieties.
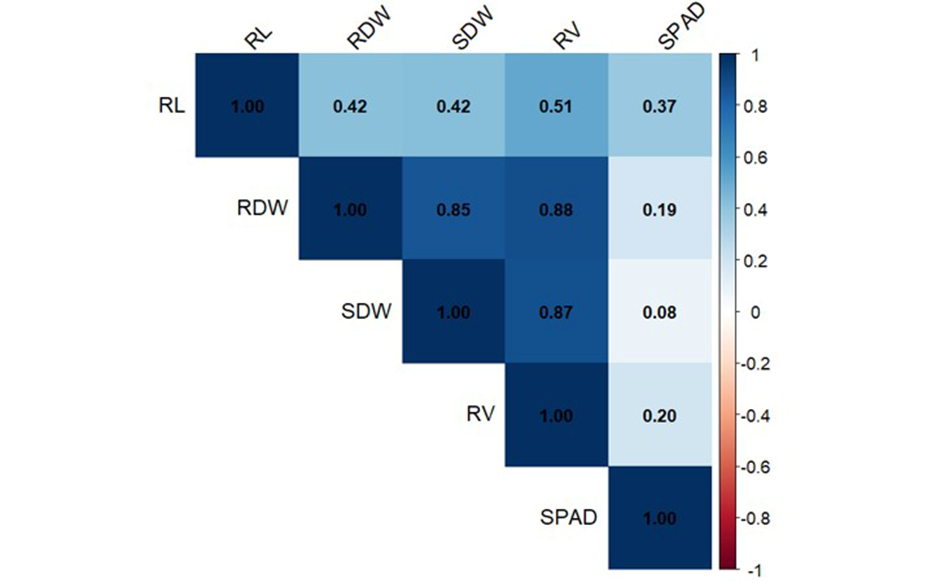
Fig. 4. Correlation analysis showing significant parameters associated with vegetative growth in rice under mercury stress at 6 ppm HgCl₂. A total of 5 parameters were evaluated: leaf greenness measured using a SPAD meter, root length (RL), root volume (RV), root dry weight (RDW), and shoot dry weight (SDW).
Table 7. Eigenvalues, explained variance and cumulative variance from principal component analysis at 6 ppm HgCl₂.
| Dimension | Eigenvalue | Variance (%) | Cumulative (%) |
|---|---|---|---|
| comp 1 | 3.110 | 62.21 | 62.21 |
| comp 2 | 1.096 | 21.93 | 84.14 |
| comp 3 | 0.548 | 10.96 | 95.10 |
| comp 4 | 0.140 | 2.80 | 97.89 |
| comp 5 | 0.105 | 2.11 | 100.00 |
Factor loading analysis showed that Dim1 made a dominant contribution to character diversity, with a factor loading≥ |0.60| (Table 8). Most of the plant's morphological characteristics, namely root length, root dry weight, shoot dry weight, and root volume, had relatively large negative loading values on Dim1. This indicates that the main differences between the rice varieties exposed to Hg stress are closely related to their vegetative growth characteristics. On the other hand, SPAD showed a dominant contribution in Dim 2, with a loading value of 0.861, indicating that it reflects aspects of the plant's physiological status and photosynthetic ability.
Table 8. Factor loadings from principal component analysis (PCA) at 6 ppm HgCl₂.
| Variable | Dim. 1 | Dim. 2 | Dim. 3 | Dim. 4 | Dim. 5 |
|---|---|---|---|---|---|
| Root volume | -0.652 | 0.461 | -0.600 | 0.017 | 0.031 |
| Root dry weight | -0.923 | -0.192 | 0.171 | 0.246 | 0.147 |
| Shoot dry weight | -0.909 | -0.288 | 0.060 | -0.276 | 0.106 |
| Root volume | -0.950 | -0.148 | 0.056 | 0.028 | -0.267 |
| SPAD | -0.324 | 0.861 | 0.389 | -0.042 | 0.006 |
The distribution of individuals in the PCA biplot showed variations in response among rice varieties based on the combination of growth and physiological traits, namely root length, root dry weight, shoot dry weight, root volume, and SPAD value under Hg stress (Fig. 5). Several variety groups showed similar positions, such as Sertani and Cisokan, with IPB 9G, indicating similar growth patterns and physiological responses to Hg stress. On the other hand, Tarabas, Banang Pulau, Pandan Wangi, and Putiah were positioned differently. Variable contributions in the PCA were evaluated to determine the importance of and relationships among traits contributing to principal component formation (Fig. 6). The PCA results showed that root volume (RV) had a relatively large contribution to the formation of principal components, as indicated by the higher contribution of color intensity and longer vector length. Root dry weight (RDW) and shoot dry weight (SDW) also contributed significantly, indicating substantial correlations.
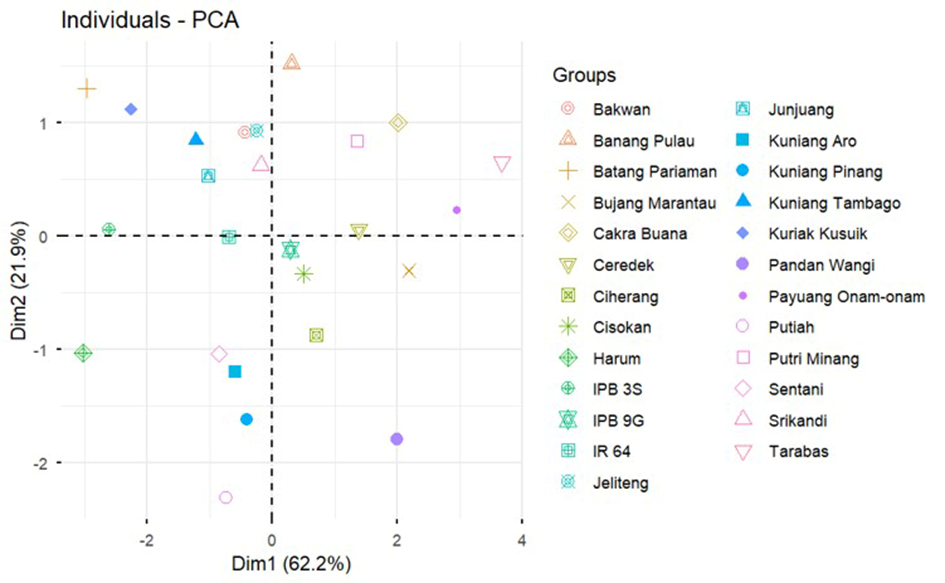
Fig. 5. Individual PCA score plot illustrating the distribution and similarity patterns of rice varieties based on SPAD value, root length, root volume, root dry weight, and shoot dry weight under HgCl₂ stress conditions, 6 ppm.
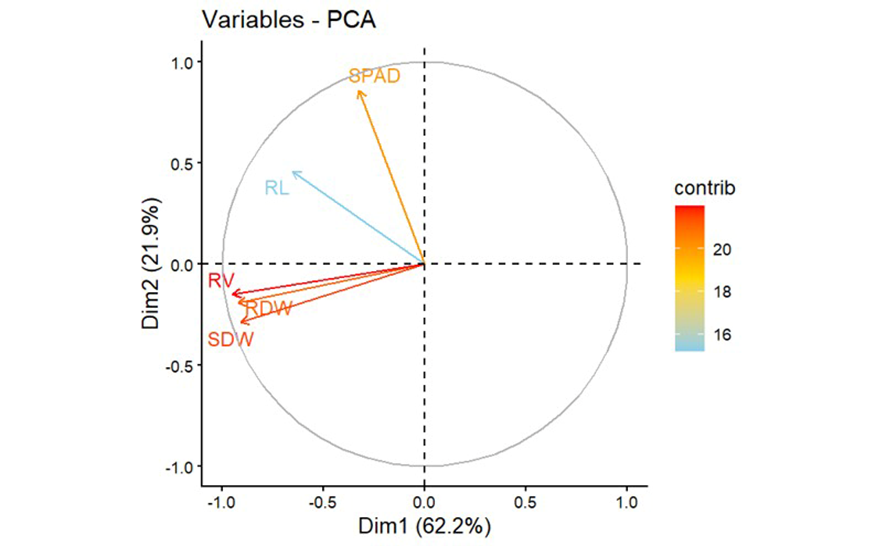
Fig. 6. Contribution and relationship of growth and physiological traits of rice varieties based on PCA analysis at 6 ppm HgCl₂. Parameters: SPAD, root length (RL), root volume (RV), root dry weight (RDW), and shoot dry weight (SDW).
Rice cultivars differ significantly in terms of root and shoot dry weight (RDW and SDW), according to a statistical study (Table 9). These findings suggest that the root is the primary organ for the entrance and initial storage of mercury. Varieties that could sustain higher RDW and SDW values during mercury stress exhibited greater physiological adaptability. Therefore, changes in these characteristics are crucial markers for identifying rice genotypes that are more resistant to Hg, while also perhaps lowering the likelihood of Hg transfer to the upper portions of the plant.
Table 9. Kruskal–Wallis analysis for growth and Hg-related traits among rice varieties at 6 ppm HgCl₂.
| Parameter | Chi-square | Degrees of freedom | p value |
|---|---|---|---|
| Shoot dry weight | 62.576 | 15 | 9.05 × 10⁻⁸* |
| Root dry weight | 61.592 | 15 | 1.34 × 10⁻⁷* |
Note: ns = not significant (p > 0.05); * = significant (p < 0.05)
The lack of significant differences in the paired comparison test with Holm correction for RDW and SDW (Table 10) suggests little heterogeneity in the growth response between types under Hg-stress conditions. This implies that, rather than variations in biomass, variations in tolerance between cultivars are more likely to be associated with Hg-regulation mechanisms, such as retention in roots and control of translocation to the shoot. Batang Pariaman had the highest root mercury concentration, suggesting that root tissue may accumulate more mercury. In contrast, IPB 9G and Putri Minang showed the highest shoot Hg concentrations, suggesting differences in the capacity to transport Hg from the roots to higher plant tissues. This pattern suggests that two factors affect how different types respond to Hg: the amount ingested and the plant's capacity to control its distribution among tissues.
Table 10. Growth performance, Hg uptake, and translocation characteristics among rice varieties under Hg stress at 6 ppm HgCl₂.
| Variety | Root Hg concentration (mg kg⁻¹) | Shoot Hg concentration (mg kg⁻¹) | Shoot dry weight (g) | Root dry weight (g) | Root Hg uptake (mg plant⁻¹) | Shoot Hg uptake (mg plant⁻¹) | Hg TF |
|---|---|---|---|---|---|---|---|
| Bakwan | 591.0950 | 4.3850 | 0.3360±0.0011 | 0.1430±0.0004 | 0.0845 | 0.0015 | 0.0074 |
| Banang Pulau | 390.0500 | 4.0500 | 0.3310±0.0004 | 0.1410±0.0007 | 0.0550 | 0.0013 | 0.0105 |
| Batang pariaman | 734.9350 | 7.5300 | 0.2810±0.0004 | 0.1406±0.0001 | 0.1034 | 0.0021 | 0.0102 |
| Ciherang | 479.3300 | 6.7200 | 0.1730±0.0007 | 0.1140±0.0004 | 0.0546 | 0.0012 | 0.0140 |
| Harum | 463.5600 | 5.4750 | 0.2430±0.0004 | 0.1130±0.0004 | 0.0524 | 0.0013 | 0.0118 |
| IPB 9 G | 447.0450 | 10.6250 | 0.1860±0.0004 | 0.0830±0.0004 | 0.0371 | 0.0020 | 0.0248 |
| IR 64 | 435.1500 | 9.1050 | 0.2755±0.0003 | 0.1290±0.0002 | 0.0561 | 0.0025 | 0.0214 |
| Jeliteng | 536.4500 | 5.8850 | 0.2470±0.0004 | 0.1156±0.0001 | 0.0620 | 0.0015 | 0.0111 |
| Junjuang | 382.0850 | 4.0400 | 0.2710±0.0003 | 0.1183±0.0004 | 0.0452 | 0.0011 | 0.0106 |
| Kuniang Aro | 380.4550 | 5.8500 | 0.2780±0.0007 | 0.1406±0.0004 | 0.0535 | 0.0016 | 0.0154 |
| Putri Minang | 525.5700 | 10.2250 | 0.2190±0.0004 | 0.0796±0.0002 | 0.0418 | 0.0022 | 0.0340 |
| Kuniang tambago | 177.6650 | 5.8800 | 0.2650±0.0004 | 0.1140±0.0008 | 0.0203 | 0.0016 | 0.0116 |
| Pandan wangi | 440.6100 | 5.0950 | 0.2810±0.0004 | 0.1223±0.0001 | 0.0539 | 0.0014 | 0.0195 |
| Sertani | 485.2950 | 4.5500 | 0.2968±0.0009 | 0.1313±0.0000 | 0.0637 | 0.0014 | 0.0094 |
| Srikandi | 636.1900 | 3.8350 | 0.2760±0.0004 | 0.1253±0.0002 | 0.0797 | 0.0011 | 0.0063 |
| Tarabas | 534.7900 | 7.8450 | 0.2570±0.0004 | 0.1130±0.0002 | 0.0604 | 0.0020 | 0.0151 |
Note: Root dry weight and shoot dry weight values are presented as mean ± standard error (SE) based on four biological replicates. Root and shoot Hg concentrations, root and shoot Hg uptake, and Hg translocation factor values represent the mean of duplo ICP-MS measurements for each rice variety. TF, Hg translocation factor.
The highest shoot dry weight was found in Bakwan (0.3360±0.0011 g), Banang Pulau (0.3310±0.0004 g), Batang Pariaman (0.2810±0.0004 g), and Sertani (0.2968±0.0009 g), while the highest root dry weight was found in Bakwan (0.1430±0.0004 g), Banang Pulau (0.1410±0.0007 g), Batang Pariaman (0.1406±0.0001 g), and Kuniang Aro (0.1406±0.0004 g). This indicates that these varieties have a better ability to maintain growth under Hg stress. Root Hg uptake is higher in the roots compared to the shoots. This indicates that these varieties have a better ability to maintain growth under Hg stress. This is in line with the research by Enamorado-Montes et al. (2021), who found that Hg accumulation in roots is higher than that in other organs, such as shoots, husks, and rice. The highest root Hg uptake was found in Batang Pariaman (0.1034 mg plant⁻¹), Srikandi (0.0797 mg plant⁻¹), and Bakwan (0.0845 mg plant⁻¹), while the highest shoot Hg uptake was found in IR 64 (0.0025 mg plant⁻¹), Batang Pariaman (0.0021 mg plant⁻¹), and Kuniang Pinang (0.0022 mg plant⁻¹). High root Hg uptake does not always indicate sensitivity, because it may reflect a mechanism of Hg retention in the roots if it is followed by low translocation.
The highest translocation factor (TF) values were found in Putri Minang (0.0340) and IPB 9G (0.0248), whereas the lowest values were found in Srikandi (0.0063) and Bakwan (0.0074). Low TF indicates the ability of the variety to limit the translocation of Hg to the shoots; therefore, varieties with a combination of high biomass, low Hg uptake in the shoots, and low TF are potentially more tolerant to Hg stress and have a lower risk of Hg accumulation in the grain. Du et al. (2023) stated that TF is an important indicator of nutrient accumulation efficiency in plants. The higher the TF value, the greater the capacity of the plant to accumulate nutrients and its accumulation potential. In this study, all rice varieties showed greater mercury (Hg) accumulation in roots than in shoots (stems and leaves). This is in line with the research by Strickman et al. (2024) and Yang et al. (2023), who also found higher Hg concentrations in root organs.
It is worth noting that IR 64 showed a high tolerance index in the first screening phase, suggesting that it may continue to develop under mercury stress. Nevertheless, additional analyses showed a different pattern of Hg partitioning, with substantial shoot Hg uptake and a comparatively large translocation factor. This result implies that limited Hg mobility in plant tissues does not always correlate with growth-based tolerance. As a result, even though IR 64 demonstrated a high level of physiological tolerance, its greater ability to translocate Hg may restrict its use as a potential variety for lowering Hg migration toward edible tissues.
Based on the features of SDW, RDW, root and shoot Hg content, root and shoot Hg uptake, and TF, the hierarchical clustering analysis was divided into two groups (Fig. 7). Under mercury stress, Clusters 1 (red) and 2 (green) displayed different response patterns, suggesting that different rice types have different strategies for maintaining growth and distributing mercury. Higher biomass production, greater Hg accumulation in roots, lower Hg concentration in shoots, and lower TF were all indicators that Cluster 1 had better Hg response characteristics than Cluster 2. Cluster 2, on the other hand, had higher shoot Hg concentrations and TF values, indicating increased Hg mobility toward shoot tissues. These variations imply that each cluster type responds to Hg exposure in different ways.
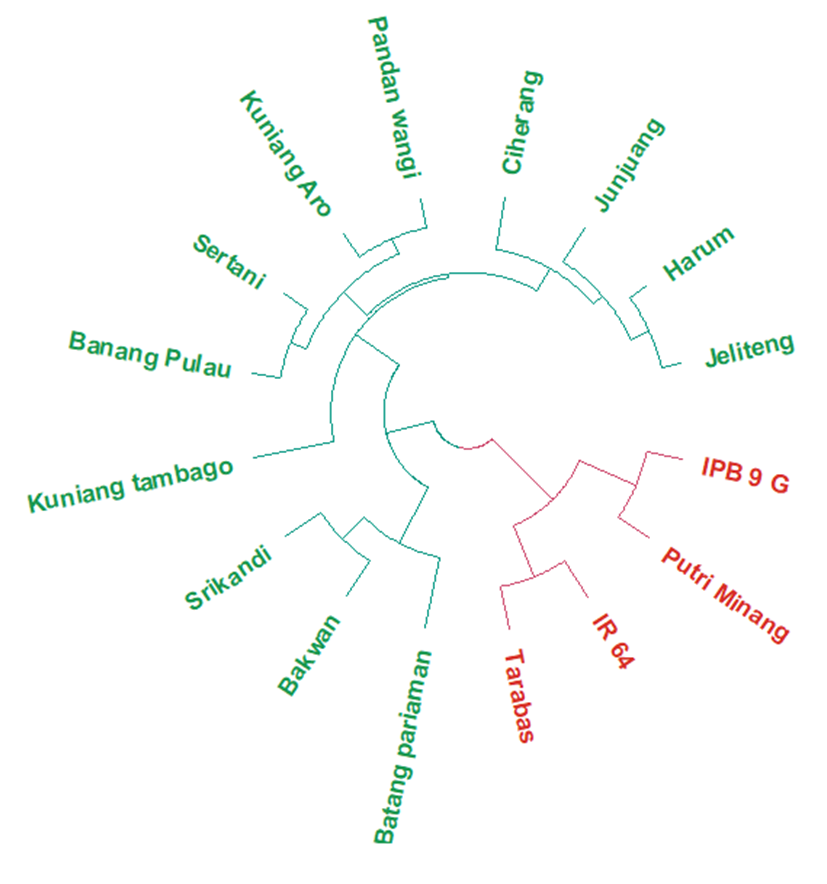
Fig. 7. Hierarchical clustering dendrogram shows the grouping of 16 rice varieties based on traits related to Hg uptake in shoots at 6 ppm HgCl₂. The varieties were grouped into two clusters, shown in green and red.
This combination of characteristics implies that Cluster 1 cultivars are better at maintaining Hg in root tissues while preventing it from moving toward organs above ground. By lowering Hg exposure in photosynthetically active tissues, this response approach enables plants to sustain growth under Hg stress. Cluster 1 varieties are, therefore, more viable candidates for Hg tolerance; nevertheless, additional testing during the reproductive stage is necessary to ascertain their capacity to restrict Hg deposition in rice grains.
This study was conducted at Bogor Agricultural University's Cikabayan Greenhouse. There was conducted in two phases of the study. The first phase took place between March and April 2025, while the second phase took place between June and August of the same year. Rice varietals, 1 N NaOH, 1 N HCl, AB mix, and sand were among the ingredients utilized. Styrofoam buckets (55 cm by 35 cm by 8 cm), air compressors, cutting instruments, pH meters, measurement instruments, an analytical balance, ovens, cameras, pipettes, and a measuring tape were among the gear used. Ambient temperature fluctuations followed natural climatic variations because the experiment was conducted in a basic greenhouse without an automated temperature control system, which is a limitation of this study. The mean temperature ranged from 25.7 °C to 41.3 °C, whereas the mean humidity ranged from 39.2% to 90.3%. The pH of the nutrient solution was maintained at 4.5–4.8 and monitored every 2 days until harvest. When the pH exceeded the upper threshold, adjustment was performed with 5 M HCl, and pH values below the lower threshold were corrected with 1 N NaOH. Electrical conductivity (EC) of the nutrient solution was maintained between 1.8 and 2.0 mS cm⁻¹ throughout the experimental period.
The experimental design used was a two-factor split plot. The main plot consisted of HgCl₂ doses (0 ppm, 2 ppm, 4 ppm, 6 ppm, and 8 ppm), and the subplot consisted of 25 rice varieties: IR 64, Jeliting, Cakra Buana, Sertani, Ciherang (national superior varieties), Pandan Wangi and Tarabas (local rice varieties from West Java), Junjuang, Cisokan, Ceredek, Srikandi, Banang Pulau, Batang Pariaman, Kuriak Kusuik, Bakwan, Putri Minang, Harum, Putiah, Kuniang Tambago, Kuniang Pinang, Kuniang Aro, Payuang Onam-onam, Bujang Marantau (local varieties from West Sumatera), IPB 9G, and IPB 3S (superior rice varieties from IPB University). The treatment was repeated three times, resulting in 15 Styrofoam containers. Each Styrofoam container contained 25 varieties of rice. Each rice variety was planted with three seedlings. Total plants: 375 plants.
Rice seedlings were screened using a hydroponic system containing AB mix nutrient solution (3 mL L⁻¹ concentrate A and 3 mL L⁻¹ concentrate B) supplemented with HgCl₂ according to the treatment concentrations described in Table 1. The HgCl₂-containing nutrient solution was renewed on the seventh day after treatment initiation to maintain stable Hg exposure throughout the screening period. For the first three days, the rice seeds were germinated on wet tissue paper. Based on radicle development, uniform seedlings with radicle lengths of roughly 0.5–1.0 cm were chosen, and they were then moved to a sand substrate for ten days of early seedling growth. Prior to hydroponic transplantation, each seedling was inserted through apertures in floating Styrofoam sheets after the roots had been meticulously cleaned to remove any sand particles that might have stuck to them. Plastic tubing attached to an air compressor was used to continuously aerate the hydroponic system while maintaining static conditions. Throughout the screening experiment, porous air stones were affixed to aeration outlets to enhance oxygen diffusion by producing tiny bubbles. This increased the air–solution interaction and maintained sufficient oxygen availability in the root zone.
Table 1. Preparation of HgCl₂ solutions for different Hg treatment concentrations.
| Target Hg concentration (mg L⁻¹) | Nutrient solution volume (L) | HgCl₂ required (mg) |
|---|---|---|
| 0 ppm | 12 | 0 |
| 2 ppm | 12 | 24 |
| 4 ppm | 12 | 48 |
| 6 ppm | 12 | 72 |
| 8 ppm | 12 | 96 |
Based on the relative root length (RRL) response, all seedlings were collected 10 days after exposure to Hg and categorized into tolerant, moderately tolerant, or sensitive groups. According to the classification standards provided by Triyanti et al. (2024), varieties with RRL values above 71% were classified as tolerant, those with values between 63 and 70% as moderately tolerant, and those with values below 63% as sensitive. Growth and physiological traits were evaluated based on root length (cm), measured from the root collar to the root tip using a ruler; root and shoot dry weights (g), determined after oven-drying samples at 80 °C for 48 h and weighing using an analytical balance; and total plant biomass (g), calculated as the sum of root and shoot dry weights. Leaf greenness was measured using a SPAD chlorophyll meter.
Relative root length (RRL) was calculated to evaluate the inhibitory effect of Hg stress on root development as the ratio of root length under Hg treatment to the root length of the corresponding control, expressed as a percentage:
\[RRL(\%) = \frac{{RL}_{Hg}}{{RL}_{Control}} \times 100\]
where RLHg represents root length under Hg exposure and RLControl represents root length of non-Hg-treated seedlings. Higher RRL values indicate a greater ability of rice genotypes to maintain root growth under Hg stress.
Relative biomass (RB) was calculated to determine the ability of the rice genotypes to maintain biomass production under Hg stress. RB was calculated as the ratio of dry biomass under Hg exposure to that of the corresponding control treatment and was expressed as a percentage:
\[RB(\%) = \frac{{Biomass}_{Hg}}{{Biomass}_{Control}} \times 100\]
where BiomassHg represents the total dry biomass of seedlings exposed to Hg, and BiomassControl represents the biomass of non-Hg-treated seedlings. Higher RB values indicate greater biomass maintenance capacity and improved tolerance to Hg stress.
The tolerance index (TI) was calculated to quantify the ability of rice genotypes to maintain biomass production under Hg stress. TI was calculated as the ratio between biomass under Hg exposure and biomass under non-stressed conditions:
\[TI = \frac{{Biomass}_{Hg}}{{Biomass}_{Control}}\]
where BiomassHg represents the dry biomass of rice seedlings exposed to Hg, and BiomassControl represents the biomass of non-Hg-treated seedlings. Higher TI values indicate greater biomass maintenance capacity and improved Hg tolerance.
The stress susceptibility index (SSI) was calculated based on biomass reduction to evaluate the relative sensitivity of rice genotypes to Hg stress. SSI was calculated according to Fischer and Maurer (1978) as follows:
\[SSI = \frac{1 - (Y_{s}/Y_{p})}{1 - (\overline{Y_{s}}/\overline{Y_{p}})}\]
where Ys and Yp represent the dry biomass of the individual genotypes under Hg stress and control conditions, respectively. Biomass was calculated as the sum of root dry weight and shoot dry weight (RDW + SDW). Lower SSI values indicate greater biomass stability and higher tolerance to Hg stress.
Data were analyzed using split-plot analysis of variance (ANOVA). The residual assumptions of normality and homogeneity of variance were evaluated using the Shapiro–Wilk and Levene tests. Data that did not meet the ANOVA assumptions were transformed using square root transformation (√x). If the treatment showed a significant effect (p < 0.05), the differences between treatments were further tested using Tukey’s Honestly Significant Difference (HSD) significance test (p < 0.05). ANOVA analysis was conducted using STAR software 2.0.1. Correlation analysis was performed using the Pearson method with the corrplot package, and Principal Component Analysis (PCA) was performed in R version 4.6.1 (2026-06-24 ucrt) using the ggplot2, FactoMineR, factoextra, and dplyr packages. Before the PCA analysis, all variables were standardized using z-score transformation (mean = 0 and standard deviation = 1) to eliminate differences in measurement scales between parameters.
This study uses a Completely Randomized Design (CRD) with a single factor: rice varieties. Sixteen rice varieties were evaluated for their response to 6 ppm HgCl₂ stress in the first experiment, with classification based on relative root length (RRL) values. Tolerant varieties included IR 64, Sentani, Ciherang IR 64, Sentani, Ciherang, Junjuang, Srikandi, Banang Pulau, Batang Pariaman, Bakwan, Harum, Kuniang Tambago, Kuniang Aro, Jeliteng, Tarabas, dan IPB 9G. Variety yang moderat was Pandan Wangi, sedangkan variety yang sensitif was Putri Minang. Each variety consisted of four biological replicates. Each variety was placed in a single unit of a hydroponic system made of Styrofoam consisting of 20 netpots. The netpots were divided into four groups of repetitions, namely netpot rows 1–5 as the first repetition, rows 6–10 as the second repetition, rows 11–15 as the third repetition, and rows 16–20 as the fourth repetition. Each netpot contained 15 plants, so each variety consisted of 300 plants (20 netpots × 15 plants). The second experimental stage was the same as the first, except that the seedlings were transplanted two weeks after sowing. Planting was performed in each planting hole (net pot) at the base of the Styrofoam with 15 seedlings. Two weeks after transplanting, HgCl₂ was applied at 6 ppm (72 mg in 12 liters of water). The HgCl₂ solution was replaced every week with the ABmix solution. The plants were harvested three weeks after treatment when they were three weeks old. The observed variables include the following:
Three weeks after exposure to HgCl₂, the plants were harvested for the analysis of Hg content. The root tissues were carefully washed using deionized water to remove any residual nutrient solution and external Hg adhering to the root surface. Next, the roots and shoots were separated and dried in an oven at 70 °C for 48 h until a constant weight was achieved. The dry samples were then weighed to obtain root dry weight (RDW) and shoot dry weight (SDW). All plants from each biological replicate were pooled to generate a composite sample, and ICP-MS analysis was conducted in duplicate. The composite samples were then thoroughly homogenized and analyzed in duplicate using an ICP-MS instrument to ensure the accuracy of the analytical measurements. The analysis of Hg concentration in plant tissues was conducted using AOAC Method 971.21 (AOAC, 2012), with modifications to the detection stage, via Inductively Coupled Plasma–Mass Spectrometry (ICP-MS). Approximately 0.5 g of homogenized dry plant samples were weighed and subjected to a digestion process using a microwave-assisted digestion system with the addition of concentrated nitric acid (HNO₃) and hydrogen peroxide (H₂O₂). A gold (Au) solution was added during digestion to stabilize Hg and reduce Hg loss due to volatility, and lutetium (Lu) was used as a marker to monitor potential analyte loss during sample preparation. The solution obtained from digestion was diluted to a specific volume with ultrapure deionized water and analyzed by ICP-MS, with Rh, In, and Tm as internal standards. A multi-element standard solution was used to generate the calibration curve. To ensure the precision and reliability of the measurement results, quality assurance and quality control (QA/QC) were carried out using analytical blanks, calibration standard verification, and Certified Reference Materials (sCRMs) with matrix characteristics matching those of the plant samples. Hg concentration data was used to describe the accumulation and distribution patterns of Hg among varieties in the root and shoot tissues.
Mercury uptake in roots and shoots was calculated based on the Hg concentration and corresponding dry biomass. Root Hg uptake and shoot Hg uptake were determined using the following equations:
\[{Hg}_{root} = C_{Hg(root)} \times {DW}_{root}\]
\[{Hg}_{shoot} = C_{Hg(shoot)} \times {DW}_{shoot}\]
where CHg represents Hg concentration in plant tissues (mg kg⁻¹ dry weight), and DW represents dry biomass (kg plant⁻¹). Total Hg uptake was calculated as the sum of Hg accumulated in the roots and shoots.
The translocation factor (TF) was calculated to evaluate the ability of rice plants to transport Hg from the roots to the aboveground tissues. TF was calculated as the ratio between the Hg concentration in the shoots and roots:
\[TF = \frac{C_{Hg(shoot)}}{C_{Hg(root)}}\]
where CHg(shoot) and CHg(root) represent Hg concentrations in shoot and root tissues (mg kg⁻¹ dry weight), respectively. TF values below one indicate limited Hg translocation from the roots to shoots, whereas TF values above 1 indicate greater Hg mobility within the plant (Strickman et al., 2024).
Plant growth data, namely root and shoot dry weights, were analyzed using a non-parametric approach. Differences in growth responses among varieties were evaluated using the Kruskal–Wallis test; if a significant effect was observed (p < 0.05), the analysis was continued with pairwise Wilcoxon rank-sum test with Holm adjustment at the 5% significance level. Root Hg concentration, shoot Hg concentration, root Hg uptake, shoot Hg uptake, and translocation factor, were not analyzed using inferential tests because these values were obtained from composite samples of each variety and ICP-MS measurements in duplo. Hierarchical clustering analysis was conducted using the parameters root dry weight, shoot dry weight, root Hg concentration, shoot Hg concentration, root Hg uptake, shoot Hg uptake, and translocation factor after data standardization via z-score transformation. The degree of similarity between varieties was calculated based on the Euclidean distance, while the hierarchical clustering structure was built using the Ward D2 linkage method. The silhouette coefficient determined the optimal number of clusters, and the dendrogram identified groupings of types with comparable Hg accumulation, distribution, and translocation patterns. R software version 4.6.1 (2026-06-24 ucrt) was used for all statistical analyses and visualizations.
In conclusion, our study showed that the responses of 25 different rice cultivars to Hg stress varied significantly. Relative root length (RRL), tolerance index (TI), and stress susceptibility index (SSI) were used in the initial screening to identify tolerant and sensitive varieties based on their responses to increasing doses of HgCl₂, especially at 6 mg L⁻¹. Root dry weight, shoot dry weight, and root volume were among the main characteristics influencing variability in Hg tolerance responses, as indicated by the principal component analysis (PCA) of the initial screening experiment, suggesting their significance as early selection markers. Subsequent analysis of the 16 selected cultivars under mercury stress revealed distinct strategies for preserving growth and controlling mercury distribution in plant tissues. These findings show that integrating growth-based tolerance with Hg partitioning features is crucial for identifying more trustworthy candidates, and that growth-based tolerance alone is insufficient for selecting Hg-tolerant rice varieties. The types were divided into two main groups with different Hg response methods based on hierarchical clustering of biomass output, tissue Hg content, Hg absorption, and translocation factor (TF). Higher biomass output, greater Hg retention in roots, less Hg buildup in shoots, and less Hg translocation were among the most advantageous tolerance traits observed in the first cluster. Batang Pariaman, Bakwan, Srikandi, Banang Pulau and Junjuang were identified as promising Hg-tolerant candidate varieties based on their integration of growth performance and Hg partitioning features.
Under the Research Program Implementation Contract for Fiscal Year 2025 (Contract No. 006/C3/DT.05.00/PL/2025), the Indonesian government provided funding for this study through the Ministry of Higher Education, Science, and Technology, Directorate General of Research and Development.
During the development of this publication, artificial intelligence (AI) (ChatGPT) techniques were used exclusively for language refinement, such as standardizing scientific terminology, improving academic writing styles, refining grammar, and assisting translation from Indonesian to English. AI has only been used for language editing and clarity improvement. The authors independently created, confirmed, and validated all scientific hypotheses, experimental design, data analysis, interpretation of results, and conclusions.
Conceptualization: YK and MG; Methodology: YK, MG, DS, H, and IM; Data curation: YK, MG, and DS; Funding acquisition: MG and YK; Writing—original draft: YK; Writing—review and editing: YK, MG, DS, IM, and H. All authors have read and agreed to the published version of the manuscript.
The authors declare that there are no conflicts of interest.
Anshori MF, Purwoko BS, Dewi IS, Ardie SW, Suwarno WB (2021) A new approach to select doubled haploid rice lines under salinity stress using indirect selection index. Rice Sci. 28(4):368–378. https://doi.org/10.1016/j.rsci.2021.05.007
AOAC (2012) Official methods of analysis of AOAC International, 19th edn. AOAC International, Gaithersburg, MD, USA. Official Method 971.21.
Arunrat N, Kongsurakan P, Sereenonchai S (2024) Heavy metal contamination and potential health risks in upland rice-producing soils of rotational shifting cultivation in northern Thailand. Environ Sci Eur. 36(1):196. https://doi.org/10.1186/s12302-024-01023-3
Chen Y, Ding Z, Yu T, Cao L, Duan Y, Zu Y, Li Z (2024) Accumulation characteristics of heavy metals in three wild rice species and adaptation of root morphology and anatomical structure to native soil heavy metals in Yunnan. Ecol Indic. 167:112601. https://doi.org/10.1016/j.ecolind.2024.112601
Du S, Wang X, Zhou Z, Zhang T, Ding C (2023) Kinetic characteristics of and critical stages for mercury accumulation in rice (Oryza sativa L.). Ecotoxicol Environ Saf. 258:114968. https://doi.org/10.1016/j.ecoenv.2023.114968
Enamorado-Montes G, Reino-Causil B, Urango-Cardenas I, Marrugo-Madrid S, Marrugo-Negrete J (2021) Mercury accumulation in commercial varieties of Oryza sativa L. cultivated in soils of La Mojana Region, Colombia. Toxics. 9(11):304. https://doi.org/10.3390/toxics9110304
Fischer RA, Maurer R (1978) Drought resistance in spring wheat cultivars. I. Grain yield responses. Aust J Agric Res. 29(5):897–912. https://doi.org/10.1071/AR9780897
Gusmini, Arlius F, Adrinal, Fauzan R, Putri EL (2023) Restoration of soil chemical and mercury content in former mining land with the application of biochar, manure and clay for the sunflower growth and production. IOP Conf Ser Earth Environ Sci. 1160(1):012029. https://doi.org/10.1088/1755-1315/1160/1/012029
Hang X, Gan F, Chen Y, Chen X, Wang H, Du C, Zhou J (2018) Evaluation of mercury uptake and distribution in rice (Oryza sativa L.). Bull Environ Contam Toxicol. 100(3):451–456. https://doi.org/10.1007/s00128-017-2237-9
Huang Y, Li F, Yi J, Yan H, He Z, Li X (2022) Transcriptomic and physio-biochemical features in rice (Oryza sativa L.) in response to mercury stress. Chemosphere. 309:136612. https://doi.org/10.1016/j.chemosphere.2022.136612
Hussain B, Umer MJ, Li J, Ma Y, Abbas Y, Ashraf MN, Tahir N, Ullah A, Gogoi N, Farooq M (2021) Strategies for reducing cadmium accumulation in rice grains. J Clean Prod. 286:125557. https://doi.org/10.1016/j.jclepro.2020.125557
Kim YO, Kim D, Safdar M, Kim J (2026) Cysteine and glutathione improve mercury tolerance in rice by modulating cell wall binding, transport, and detoxification pathways. Environ Exp Bot. 242:106312. https://doi.org/10.1016/j.envexpbot.2026.106312
Mani V, George B, Saravanan K (2024) Toxicological impacts of mercury on the growth and biochemical profiles of pumpkin (Curcurbita moschata duchesne). World J Adv Res Rev. 24(1):2596–2605. https://doi.org/10.30574/wjarr.2024.24.1.3300
Mani V, Gurusamy AK, Perumal V (2025) Toxicological effects of mercury in radish (Raphanus sativus) plants – biochemical analysis. Sch Acad J Pharm. 14(1):1–8. https://doi.org/10.36347/sajp.2025.v14i01.001
Meng M, Li B, Shao J, Wang T, He B, Shi J, Ye Z, Jiang G (2014) Accumulation of total mercury and methylmercury in rice plants collected from different mining areas in China. Environ Pollut. 184:179–186. https://doi.org/10.1016/j.envpol.2013.08.030
Nugraha Y, Utami DW, Rosdianti I, Ardie SW, Ghulammahdi M, Suwarno, Aswidinnoor H (2016) Markers-traits association for iron toxicity tolerance in selected Indonesian rice varieties. Biodiversitas. 17(2):753–763. https://doi.org/10.13057/biodiv/d170251
Piotto FA, Tulmann-Neto A, Franco MR, Boaretto LF, Azevedo RA (2014) Rapid screening for selection of heavy metal-tolerant plants. Crop Breed Appl Biotechnol. 14(1):1–7. https://doi.org/10.1590/S1984-70332014000100001
Shi Y, Wang M, Ni H, Lin S, Ma D, Zhou Z, Ji C (2026) Clinical characteristics, management, and outcomes of diseases caused by mercury overexposure: a systematic review of case reports and case series. Front Public Health. 14:1750332. https://doi.org/10.3389/fpubh.2026.1750332
Strickman RJ, Larson S, Farhat YA, Hoang VAT, Rothenberg SE, Neumann RB (2024) Effects of elevated CO₂ on MeHg and IHg in rice. Environ Adv. 16:100515. https://doi.org/10.1016/j.envadv.2024.100515
Triyanti VR, Rosmayati, Basyuni M, Damanik RIM (2024) Genetic diversity and tolerance assessment of rice varieties to mercury contamination in illegal gold mining affected areas: a case study in Mandailing Natal Regency, North Sumatra, Indonesia. Rev Gest Soc Ambient. 18(4):e07423. https://doi.org/10.24857/rgsa.v18n4-153
Wang C, Wang T, Mu P, Li Z, Yang L (2013) Quantitative trait loci for mercury tolerance in rice seedlings. Rice Sci. 20(3):238–242. https://doi.org/10.1016/S1672-6308(13)60124-9
Wang Z, Sun T, Driscoll CT, Yin Y, Zhang X (2018) Mechanism of accumulation of methylmercury in rice (Oryza sativa L.) in a mercury mining area. Environ Sci Technol. 52(17):9749–9757. https://doi.org/10.1021/acs.est.8b01783
Yang A, Feng J, Wang H, Cui L, Xie G, Li H, Luo X, Xian Y (2023) A review of mercury uptake, transport and bioaccumulation in rice. Water Air Soil Pollut. 234(6):377. https://doi.org/10.1007/s11270-023-06400-x
Zwolak A, Sarzyńska M, Szpyrka E, Stawarczyk K (2019) Sources of soil pollution by heavy metals and their accumulation in vegetables: a review. Water Air Soil Pollut. 230(7):164. https://doi.org/10.1007/s11270-019-4221-y