Australian Journal of Crop Science
Article | https://doi.org/10.21475/ajcs.26.20.10.pne267
Submitted: 02 March 2026 | Revised: 19 August 2026 | Accepted: 02 September 2026
Pages 818–833
Identification of seedling and adult plant stem rust (Puccinia graminis f. sp. tritici) resistance and associated genes in advanced wheat (Triticum aestivum L.) lines
Elizabeth Akinyi Msundi1*, James Otieno Owuoche1, Maurice Edwards Oyoo1, Mandeep Singh Randhawa2, Sridhar Bhavani2
1Department of Crops, Horticulture and Soils, P.O. Box 536-20115, Egerton University, Njoro, Kenya
2International Maize and Wheat Improvement Center (CIMMYT), World Agroforestry Centre (ICRAF house), United Nations Avenue, Gigiri, Village market, P.O. Box 1041-00621 Nairobi, Kenya
*Corresponding author: akinyiredemta2018@gmail.com
ORCID ID: 0000-0003-0864-4591
Abstract: Bread wheat (Triticum aestivum L.) cultivars with a combination of genes for seedling and adult plant resistance (APR) to stem rust (Puccinia graminis f. sp. tritici) are often effectively protected from stem rust infection. The objective of this study was to determine the genotypic variations of advanced wheat lines for stem rust seedling and adult plant resistance (APR) and postulate presence of some known resistance genes among the lines. A 3-season experiment was conducted to evaluate 168 wheat lines for stem rust infections in a 21 × 8 α-lattice design under 3 replications. The lines were evaluated under seedling infections with races TTKSK and TTKTT and under a mixed stem rust race epidemic and natural yellow rust infection. In addition, markers NB-LRR3, wMAS000005 and IWB1055 were used to identify genes Sr12, Sr2, and Sr8155B1, respectively. From this study, seedling resistance was observed on 5.95% of the lines for races TTKSK and TTKTT, on 11% of the lines for race TTKSK and only 6.55% of the lines for race TTKTT. APR was observed on 68 lines for stem rust (SR), 120 lines for yellow rust (YR) and 56 lines for both SR and YR. Among these, lines 6133, 6163 and 6164 exhibited exceptional SR APR with up to 10% severity with resistant to moderately resistant reactions. Ten lines had lower infections relative to the commercial resistant check, cultivar Kingbird. Molecular markers amplified genes Sr12 in 131 lines, Sr8155B1 in 50 lines and Sr2 in 47 lines. The identified lines with seedling and APR can be used as parents and may be considered for further multi-location agronomic evaluation.
Keywords: wheat breeding, seedling resistance, adult plant resistance, stem rust resistance genes, yellow rust, stem rust races.
Abbreviations: APR_Adult plant resistance; ITs_Infection types; OS_Off season; MS2019_Main season 2019; R_Resistant; RMR_Resistant to moderately resistant; M_Moderately resistant to moderately susceptible; MS_Moderately susceptible; MSS_Moderately susceptible to susceptible; S_Susceptible; AUDPC_Area under disease progressive curve; rAUDPC_Relative area under disease progressive curve; PBC_Pseudo black chaff; LTN_Leaf tip necrosis; GS_Growth stage.
Wheat (Triticum aestivum L.) productivity is constrained by rust diseases such as stem rust (Puccinia graminis f. sp. tritici), leaf rust (Puccinia triticina Eriks) and yellow rust (Puccinia striiformis f. sp. tritici). The search for stem rust resistance genes in wheat became crucial after the re-emergence of stem rust races with corresponding virulence to single genes deployed in most wheat cultivars (Singh et al., 2015; Periyannan et al., 2017). Consistent losses in wheat yield and quality caused by these races stimulated the concerted breeding efforts under the Green Revolution in the early 1960s towards the development and distribution of the semi dwarf high yielding wheat cultivars with stem rust resistance conferred by Sr2 gene (Rajaram, 1993; Ellis et al., 2014). However, as resistant cultivars were being developed, natural selection forced the accumulation of new virulence adaptations in stem rust populations that rapidly overcame the resistance in released cultivars towards the end of 1990s (Duplessis et al., 2021). For instance, the widespread use of CIMMYT derived triple rust resistant cultivars Veery, Kauz, Attila and their crosses protected with genes Sr31, Lr26, Yr9 and Pm8, seemed a viable solution that was yearned for, only to be negated by the new virulent races to respective genes Sr31, Yr9 and Yr27 (Rajaram et al., 2002; Hussain et al., 2017). The subsequent invasion of more grave virulent races paved way for the inception of the Borlaug Global Rust Initiative (BGRI) in 2005 whose surveillance efforts confirmed high virulence diversity in Kenyan stem rust races (McIntosh and Pretorius, 2011; Hodson et al., 2012). For example, races virulent to genes Sr24 (2006), SrTmp (2014), Sr24 + SrTmp (2014) have been since detected in wheat grown in Kenya (Singh et al., 2015).
Unlike major genes which confer qualitative resistance to stem rust, minor genes or adult plant resistance (APR) genes confer resistance quantitatively from segregation of alleles with variable effects at distinct loci that collectively provide a moderate to high level of resistance (Pilet-Nayel et al., 2017). At least 5 catalogued minor genes Sr2, Sr55, Sr56, Sr57 and Sr58 are suggested to possess effective alleles needed to confer durable resistance to stem rust in combinations (Fetch et al., 2021). Among these genes, Sr55, Sr57 and Sr58 mapped on chromosomes 4DL, 7DS and 1BL, respectively (Dyck, 1987; Singh et al., 2012; Karelov et al., 2022), co-segregate with linked loci that confers resistance to stem rust, yellow rust, leaf rust, powdery mildew (Blumeria graminis f. sp. tritici) and leaf tip necrosis phenotype (Herrera- Foessel et al., 2011; Huerta-Espino et al., 2020). The Lr46/Sr58 and Lr34/Sr57 genes have been associated with reduction in leaf rust severity by 11% and 55%, respectively, while their combination with Lr68 resulted in 88% reduction in leaf rust severity occasioning a near immunity response under Mexican and Xinxiang conditions (Herrera-Foessel et al., 2012). Similarly, Randhawa et al. (2018) observed that recombinant inbred lines possessing both Sr2 and Lr34 had enhanced APR to leaf rust, stem rust and yellow rust in wheat grown in Mexico and Kenya. Evaluation of wheat lines in Njoro, Kenya (35º 55′ 60′′ E, 0º 19′ 60′′ S), showed that Lr67/Sr55 gene had 16% severity against race TTKST (Herrera-Foessel et al., 2014). The recessive gene Sr2 that originated from tetraploid emmer wheat (Triticum turgidum) cultivar Yaroslav and introgressed into bread wheat on short arm of chromosome 3B, has been the most durable stem rust resistance gene (Juliana et al., 2015). Phenotypic expression of stem and head melanosis or pseudo black chaff pigmentation on spike and culmn of wheat with Sr2 gene indicates a tight linkage between the two (McFadden, 1930). Bhavani et al. (2011) noted that the recessive Sr2 gene provides a modest level of protection against a wide spectrum of stem rust races including Ug99 on six CIMMYT wheat. The Sr2 based resistance is durable according to the definition of Johnson (1984) since it has remained effective in different wheat cultivars that have been widely grown. The Sr56 gene mapped on chromosome 5BL has been associated with a 27% reduction in stem rust severity (Bansal et al., 2014).
High yielding and stem rust resistant wheat genotypes have been identified from several CIMMYT wheat nurseries evaluated in Kenya and outstanding lines have been used in crossing programs to improve the genetic diversity of local wheat cultivars in many countries (Bhavani et al., 2019). Njau et al. (2010) evaluated 103 CIMMYT wheat lines from the first Stem Rust Resistance Screening Nursery (1st SRRSN) for resistance to Ug99 in Njoro for 4 seasons and identified resistant wheat genotypes and similarly, Odemba et al. (2018) evaluated 744 wheat lines from the 1st, 3rd, 5th, 7th and 9th SRRSN for stem rust resistance and identified 75% lines resistant to predominant stem rust races. Unlike other studies that evaluated previous SRRSN wheat lines based only on phenotypic data (Njau et al., 2010; Odemba et al., 2018), the objective of this study was to determine the genotypic variations of advanced SRRSN wheat lines for stem rust seedling and adult plant resistance and postulate presence of known resistance genes among the lines using molecular markers. The present study builds upon a previous study that characterized the same germplasm reported here for agronomic performance under two seasons of field stem rust infections (Msundi et al., 2021), by addressing the genotypic variability as well as relationships among resistances expressed at the seedling and adult plant stages.
A range of infection types (ITs) was observed on the lines when tested against races TTKTT and TTKSK. Based upon the observed ITs, the lines were categorized into 3 distinct groups (Table 1). Group 1 consisted of lines 6045, 6114, 6120, 6132, 6133, 6135, 6136, 6161, 6163 and 6164 that were resistant to races TTKTT and TTKSK with ITs lower than 2+ (Table 2). Other lines under this group exhibited differential resistance to both races with ITs lower than 2+. In this group, line 6081 was resistant to only TTKTT while lines 6093, 6128, 6129, 6022, 6167, 6168, 6016 and 6160 were resistant only to race TTKSK. Both races were virulent on lines under group 2 with ITs ≥ 3 on 67% of the lines. Race TTKSK was singly virulent on 82% of the lines while race TTKTT was virulent on 76% of the lines. Within group 3, virulence of race TTKSK on 30 wheat lines and race TTKTT on 12 wheat lines resulted into intermediate ITs with both resistant and susceptible ITs (Table 1).
Table 1. Categories of seedling infection types (ITs) for stem rust race TTKTT and TTKSK observed on the 168 wheat lines.
| Categories of infection types | TTKTT | TTKSK | Response to TTKSK and TTKTT |
|---|---|---|---|
| No. of lines | No. of lines | No. of lines | |
Category 1: Resistant ‘1’ |
1 | 0 | 0 |
| ‘2’ ‘2-’ | 6 | 12 | 6 |
| ‘2’ ‘2+’ | 4 | 6 | 4 |
| Total | 11 (6.55%) | 18 (10.72%) | 10 (5.95%) |
| Category 2: Susceptible | |||
| ‘3’ | 23 | 17 | 9 |
| ‘3’ ‘3-’ | 2 | 2 | 1 |
| ‘3’ ‘3+’ | 102 | 119 | 102 |
| Total | 127 (75.59%) | 137 (82.14%) | 112 (66.67%) |
| Category 3: | |||
| Lines with intermediate responses | 30 (17.86%) | 12 (7.14%) | 4 (2.38%) |
Where ITs ‘0’ = no visible symptoms, ‘1’ = small uredinia surrounded by necrosis, ‘2’ = small to medium uredinia with chlorosis or necrosis, ‘3’ = medium-sized uredinia without chlorosis or necrosis, ‘4’ = Large uredinia without chlorosis or necrosis, “+” or “–” was included to indicate large and small ITs, respectively.
Generally, Off-Season of 2019 (OS2019) had warmer weather conditions with mean maximum and minimum temperatures of 26.0 ± 0.83 and 9.6 ± 0.40 compared to Main season of 2019 (MS2019) and off season of 2020 (OS2020) which experienced lower mean maximum and minimum temperatures of 22.8 ± 0.37, 9.6 ± 0.39 and 23.8 ± 0.39, 10.6 ± 0.39, respectively. The wheat grown during OS2019 showed the highest frequency of 15% compared to 11% and 5% in MS2019 and OS2020, respectively of susceptible lines with stem rust reactions in the range of 60MSS-100S. Rainfall experienced in the 3 seasons also varied. The MS2020 was wetter with a mean monthly rainfall of 120.6 ± 39.11 observed in 61 days compared to 105.7 ± 20.00 and 26.50 ± 9.00 for MS2019 and OS2019, respectively.
Table 2. Seedling infection types, adult reactions to stem rust and yellow rust infections across three seasons and presence of genes among 5.95% of lines with resistance to races TTKTT and TTKSK.
| Seedling ITs | Stem rust APR in the field | Yellow rust field APR | ||||||||||
|---|---|---|---|---|---|---|---|---|---|---|---|---|
| Line | Parentage | Genes present | TTKTT | TTKSK | OS 2019 | MS 2019 | OS 2020 | OS 2019 | MS 2019 | OS 2020 | PBC | LTN |
| 6045 | PRL/2*PASTOR*2//FH617/3/2*ATTILA*2/PBW65//MURGA | Sr12, Sr2, Sr8155B1 |
2 | 2 | 20MS | 15M | 10M | 20MS | 10M | 20M | 1 | 2 |
| 6114 | MEX94.27.1.20/3/SOKOLL//ATTILA/3*BCN/4/2*SUP152*2/TECUE #1 | Sr12 | 2+ | 22+ | 30MS | 30M | 5M | 0 | 0 | 0 | 1 | 1 |
| 6120 | KACHU/DANPHE// KENYA SUNBIRD/KACHU |
Sr12 | 22- | 2- | 30M | 30M | 20MS | 30M | 10MR | 20MS | 2 | 1 |
| 6132 | WBLL1*2/BRAMBLING*2//BAVIS/3/MISR 1 | 2- | 2- | 10RMR | 10M | 10M | 20M | 15MS | 20MS | 1 | 0 | |
| 6133 | WBLL1*2/BRAMBLING*2//BAVIS/3/MISR 1 | Sr12 | 2- | 2- | 10M | 5RMR | 5MR | 0 | 5M | 5MR | 2 | 1 |
| 6135 | WBLL1*2/BRAMBLING*2//BAVIS/3/KFA/2*KACHU | Sr8155B1 | 12- | 2- | 15RMR | 10MR | 10MS | 5MS | 0 | 0 | 1 | 2 |
| 6136 | WBLL1*2/BRAMBLING*2//BAVIS/3/KFA/2*KACHU | Sr12 | 2+ | 2 | 15M | 5RMR | 10M | 0 | 5MR | 5M | 3 | 1 |
| 6161 | KACHU*2/3/ND643//2*PRL/2*PASTOR/4/KACHU/DANPHE | Sr12 | 22+ | 2+ | 30M | 20M | 15MS | 40MS | 15M | 5M | 0 | 1 |
| 6163 | FRNCLN//KIRITATI/2*TRCH/3/FRNCLN/4/SWSR22T.B./2*BLOUK#1//WBLL1*2/KURUKU | Sr12 | 2- | 2- | 15RMR | 10RMR | 5MR | 0 | 0 | 0 | 1 | 1 |
| 6164 | FRNCLN//KIRITATI/2*TRCH/3/FRNCLN/4/SWSR22T.B./2*BLOUK#1//WBLL1*2/KURUKU | Sr12 | 2- | 2- | 10M | 10RMR | 10MR | 0 | 0 | 5R | 1 | 1 |
| KINGBIRD #1 | TAM-200/TUI/6/PAVON-76//CAR-422/ANAHUAC-75/5/ BOBWHITE/CROW//BUCKBUCK/PAVON-76/3/YEC ORA-70/4/TRAP-1 | Sr12, Sr2 | 3 | 3- | 20MS | 10MS | 5MS | 0 | 10MS | 15M | 3 | 2 |
| PBW343 | Nord Desprez/VG9144//Kalyansona/Bluebird/3/Yaco/4/Veery#5 | 3+ | 3+ | 100S | 100S | 90S | 0 | 30MS | 30MS | 0 | 0 | |
| CACUKE #1 | CANADIAN/CUNNINGHAN//KENNEDY | 3+ | 3+ | 100S | 100S | 100S | 0 | 40MS | 40MS | 1 | 0 | |
Where ITs 1 = small uredinia surrounded by necrosis, 2 = small to medium uredinia with chlorosis or necrosis, A “+” or “–” was included to indicate large and small ITs, respectively, 1, 2, 2-, 2+ = resistant infection types, 3, 3-, 3+ = susceptible infection types (Stakman et al., 1962). RMR = resistant to moderately resistant, MR= moderately resistant, M = moderately resistant to moderately susceptible, MS-moderately susceptible, MSS-moderately susceptible to susceptible, S-susceptible.
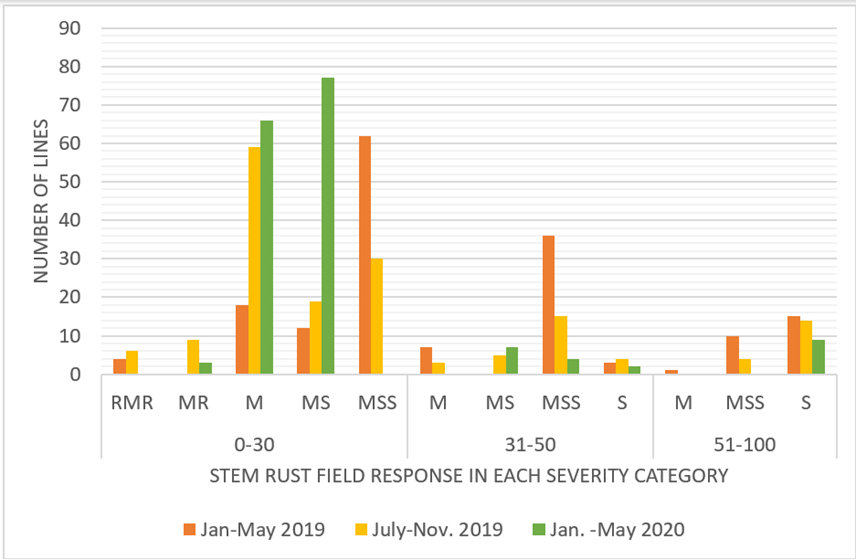
There was differential response of lines to stem rust infections, ranging from RMR to S. Infections of 5RMR to 10MR with small chlorotic pustules on stems were consistently observed on lines 6163, 6133 and 6164 over the 3 seasons while the rest reacted with 5M to 100S reactions. Only 57% of evaluated lines responded with 5RMR to 30MSS in the OS2019 compared to 73% in MS2019 and 87% in MS2020. Lines with severities \(<\) 30%, had 64% MSS infection responses in the OS2019 compared to 24% in the MS2019 and 0% in OS2020. About 56 wheat lines across all seasons had severities of 5 - 30% and RMR to MSS infection responses. High susceptibility was observed on 11% of the lines in the OS2019, 5% in the MS2019 and only on line 6093 in the OS2020 with reactions of 60MSS-100S (Figure 1). The 168 lines were classified into 3 categories. The first had lines with \(<\)30% rAUDPC which were 49% in OS2019, 80% in MS2019 and 91% in OS2020. The second category had lines with 31-50% rAUDPC which were 29%, 14% and 4% in OS2019, MS2019 and OS2020, respectively, while the third group were fast rusting, with \(>\) 51% rAUDPC which were 22%, 5% and 5% in the OS2019, MS2019 and OS2020, respectively (Table 3). Lines 6133, 6164, 6136, 6030, 6163, 6069, 6135, 6008, 6077 and 6070 had lower AUDPC across the three seasons relative to Kingbird, which represents a selection intensity of 0.996 standard deviations lower AUDPC than the mean AUDPC of 168 lines (Table 4).
Table 3. Mean and range of stem rust severity, AUDPC and rAUDPC of 168 13th SRRSN lines evaluated over three seasons at KALRO-Njoro.
| OS2019 | MS2019 | OS2020 | Means of checks across the 3 seasons | |||||
|---|---|---|---|---|---|---|---|---|
| Variables | Mean ± se | Range | Mean ± se | Range | Mean ± se | Range | Kingbird (Resistant check) | Most susceptible check (PBW343) |
| Severity (%) | 38.3 ± 1.5 | 5.0-100.0 | 31.6 ± 1.7 | 5.0-100.0 | 21.8 ± 1.7 | 5.0-100.0 | 11.7 (8) | 100.0 (168) |
| AUDPC | 404.8 ± 17.9 | 24.5-1155.0 | 421.5 ± 28.1 | 91.0-1785.0 | 316.9 ± 24.5 | 24.5-1960.0 | 120.2 (11) | 1633.3 (168) |
| rAUDPC | 36.9 ± 1.6 | 2.2-105.5 | 23.4 ± 1.6 | 0.0-100.0 | 16.5 ± 1.3 | 1.3-100 | 7.36 (11) | 100 (168) |
Figures in parenthesis represents rank of the checks among the 168 lines from the most resistant to the most susceptible, se = standard error, AUDPC-area under disease progressive curve, rAUDPC-relative AUDPC.
Table 4. Lines with lower stem rust APR relative to cultivar Kingbird along with their seedling infection types and yellow rust APR in OS2019, MS2019 and OS2020.
| Genes present | Seedling ITs | Stem rust field resistance | Yellow rust field resistance | ||||||||
|---|---|---|---|---|---|---|---|---|---|---|---|
| Lines | Parentage | TTKTT | TTKSK | OS 2019 |
MS 2019 |
OS 2020 |
OS 2019 |
MS 2019 |
OS 2020 |
AUDPC | |
| 6008 | KUTZ//KFA/2*KACHU | SR8155B1 | 1/3 | 3+ | 20MSS | 20M | 10MS | 0 | 20MS | 20M | 112.5 |
| 6030 | SAUAL/MUTUS//2*KACHU/KIRITATI | Sr12 | 3/3+ | 3/3+ | 15MSS | 10MSS | 10M | 10MR | 10MS | 15M | 207.5 |
| 6069 | ALTAR84/AE.SQUARROSA (221)//3*BORL95/3/URES/JUN//KAUZ/4/WBLL1/5/MUTUS/6/SUP152/BAJ #1 | Sr12 | 3+/3 | 2/3- | 20M | 5M | 10MS | 20M | 10RMR | 15M | 122.5 |
| 6070 | ALTAR84/AE.SQUARROSA(221)//3*BORL95/3/URES/JUN//KAUZ/4/WBLL1/5/MUTUS/6/SUP152/BAJ #1 | Sr2 | 3/3+/2- | 2/3- | 30M | 10MR | 10MS | 10M | 5MR | 5RMR | 175.0 |
| 6077 | MUCUY/3/PBW343*2/KUKUNA*2//FRTL/PIFED | Sr2 | 3+/3 | 3/3+ | 15MSS | 5MR | 10MS | 0 | 10M | 15RMR | 129.5 |
| 6133 | WBLL1*2/BRAMBLING*2//BAVIS/3/MISR 1 | Sr12 | 2- | 2- | 10M | 5RMR | 5MR | 0 | 5M | 5MR | 105.0 |
| 6135 | WBLL1*2/BRAMBLING*2//BAVIS/3/KFA/2*KACHU | SR8155B1 | 1/2- | 2- | 15RMR | 10MR | 10MS | 5MS | 0 | 0 | 122.5 |
| 6136 | WBLL1*2/BRAMBLING*2//BAVIS/3/KFA/2*KACHU | Sr12 | 2+ | 2 | 15M | 5RMR | 10M | 0 | 5MR | 5M | 157.5 |
| 6163 | FRNCLN//KIRITATI/2*TRCH/3/FRNCLN/4/SWSR22T.B./2*BLOUK#1//WBLL1*2/KURUKU | Sr12 | 2- | 2- | 15RMR | 10RMR | 5MR | 0 | 0 | 0 | 192.5 |
| 6164 | 6163 SISTERLINE | Sr12 | 2- | 2- | 10M | 10RMR | 10MR | 0 | 0 | 5R | 59.5 |
| KINGBIRD #1(6003) | TAM-200/TUI/6/PAVON-76//CAR-422/ANAHUAC-75/5/ BOBWHITE/CROW//BUCKBUCK/PAVON-76/3/YEC ORA-70/4/TRAP-1 | Sr12, Sr2 | 3 | 3- | 20MS | 10MS | 5MS | 0 | 10MS | 15M | 210.0 |
Where ITs 1 = small uredinia surrounded by necrosis, 2 = small to medium uredinia with chlorosis or necrosis, A “+” or “–” was included to indicate large and small ITs, respectively, 1, 2, 2-, 2+ = resistant infection types, 3, 3-, 3+ = susceptible infection types, and 0 = immune, RMR = resistant to moderately resistant, MR= moderately resistant, M = moderately resistant to moderately susceptible, MS-moderately susceptible, MSS-moderately susceptible to susceptible, S-susceptible.
Figure 1. Stem rust responses within severity categories observed on the lines evaluated over three seasons, where RMR = resistant to moderately resistant, MR= moderately resistant, M = moderately resistant to moderately susceptible, MS-moderately susceptible, MSS-moderately susceptible to susceptible, S-susceptible.
Natural yellow rust infection resulted in severity and response ranging from 0 to 60S and 71% of the lines displayed infections of less than 20MSS across the 3 seasons of evaluation. Lines 6054, 6062, 6067, 6076, 6092, 6101, 6105, 6107, 6108, 6110, 6114, 6117, 6137 and 6163 were totally immune to yellow rust infections over the 3 seasons. A proportion of 47%, 40% and 35% of the lines were considered slow rusting in OS2019, MS2019 and OS2020, respectively, with severity and response ranging from 0 to 5MS (Figure 2). Across all seasons, 48% of the lines had infections of less than 30MSS, while 9% were susceptible to both rusts. However, 25% of the lines had resistance to yellow rust but susceptible to stem rust while 18% were resistant to stem rust but susceptible to yellow rust. Among the 48% of lines with resistance to both rusts, lines 6163, 6135, 6164, 6136 and 6133 had reactions ranging from 0 - 15M for both rusts.
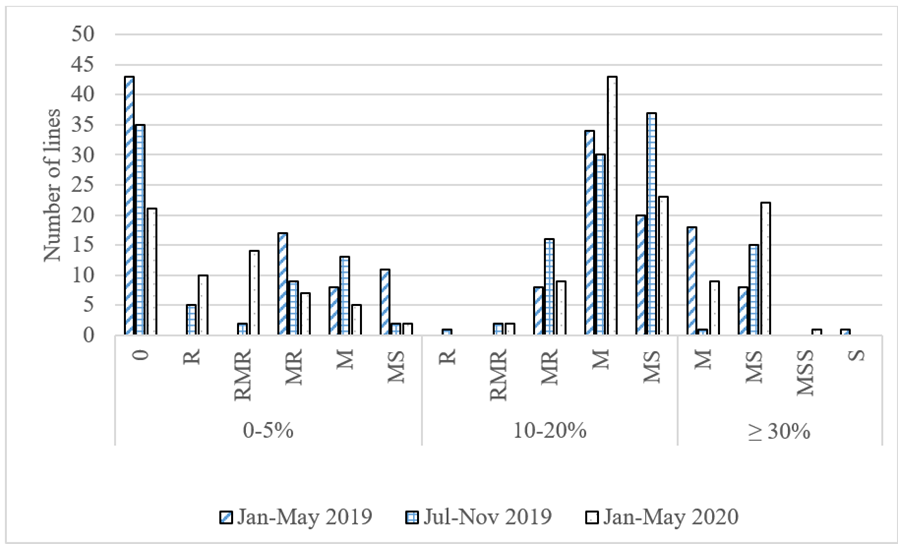
Figure 2. Response of wheat lines to yellow rust infections in the field over 3 seasons. Where R = resistant, RMR= resistant to moderately resistant, MR= moderately resistant, M = moderately resistant to moderately susceptible, MS-moderately susceptible, MSS-moderately susceptible to susceptible, S-susceptible.
The first two principal components (PC1 and PC2), explained 94.04% of the total variation and were selected for visualization. The biplot showed acute angles between MS2019 and MS2020 revealing that these seasons were correlated. The OS2019 had a longer projection from the biplot origin indicating that it accounted for the most contribution of the line × season interactions with the highest variability (Figure 3A). PC1 exhibited strong negative loadings for all three seasons. PC1 had a higher representation of the overall stem rust disease severity across seasons with an explained variance of 80.69, compared to 13.35 and 5.96 for PC2 and PC3, respectively (Table 5). The 95% confidence ellipses showed an overlap among infection responses, where susceptible group (S) had the largest ellipse compared to other group suggesting non uniform disease response across seasons (Figure 3B). Generally, lines plotted towards the negative side of PC1 exhibited higher disease severity across seasons than those plotted on the positive side.
Table 5. Principal component statistics on the three principal components evaluated for variations of 168 lines for stem rust severity across three seasons.
| Principal components | Eigen value | % variance | Cumulative Variance | Standard deviation | Variable Loadings | ||
|---|---|---|---|---|---|---|---|
| OS2019 | MS2019 | OS2020 | |||||
| PC1 | 2.42 | 80.69 | 80.69 | 1.56 | -0.55 | -0.60 | -0.59 |
| PC2 | 0.40 | 13.35 | 94.04 | 0.63 | -0.84 | 0.33 | 0.44 |
| PC3 | 0.18 | 5.96 | 100.00 | 0.42 | -0.06 | 0.73 | 0.44 |
A
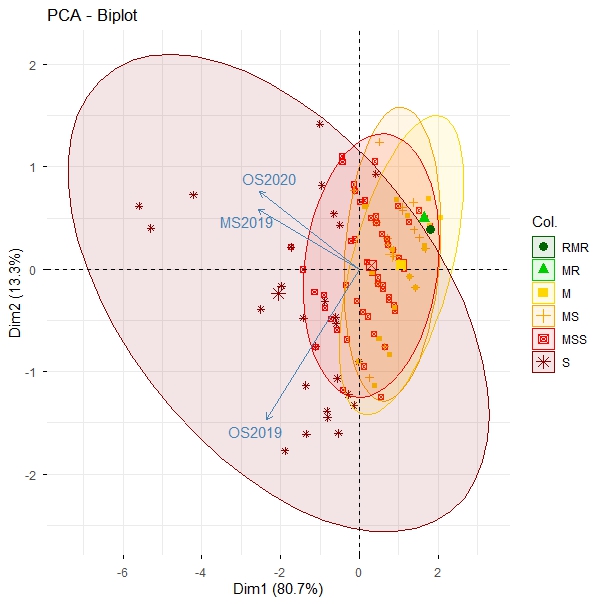
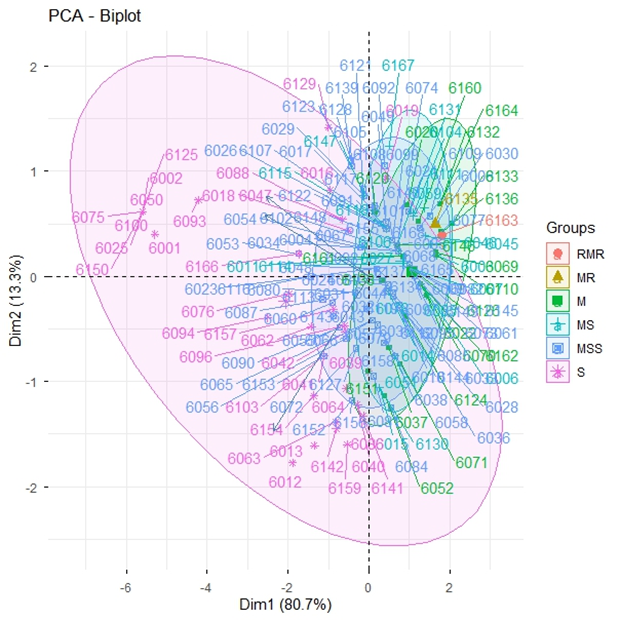
Figure 3. Biplot of the lines and line × season interactions for stem rust severity and infection response of 168 lines evaluated over three seasons, where A= a biplot of the relationships among seasons and B = a biplot of the lines by season interactions, RMR = resistant to moderately resistant, M = moderately resistant to moderately susceptible, MS-moderately susceptible, MSS-moderately susceptible to susceptible and S-susceptible.
Weak but positive relationships were observed between seedling infection type (ITs) and AUDPC ranging from ρ = 0.013 to ρ = 0.248 across seasons In OS2019, AUDPC and TTKTT seedling ITs showed a positive but not statistically significant (ρ = 0.121) association, although this correlation was significant in MS2019 (ρ = 0.215**) and OS2020 (ρ = 0.183*). Race TTKSK had a weak but significant positive correlation with AUDPC (ρ = 0.248**) in OS2019, which was also significant in OS2020 (ρ = 0.162*) but not significant in MS2019 (ρ = 0.013) (Table 6). These observations are supported on the scatter plot where most genotypes clustered within infection scores of 11–14, corresponding to susceptible ITs, yet exhibited substantial variation in AUDPC (Figure 4).
Table 6. Correlation between area under disease progression curve (AUDPC) of three seasons and infection types of races TTKSK and TTKTT at the seedling stage.
| Stem rust AUDPC OS2019 | Stem rust AUDPC MS2019 | Stem rust AUDPC OS2020 | Race TTKTT | Race TTKSK | |
|---|---|---|---|---|---|
| Stem rust AUDPC OS2019 | 1 | ||||
| Stem rust AUDPC MS2019 | 0.61*** | 1 | |||
| Stem rust AUDPC OS2020 | 0.91*** | 0.87*** | 1 | ||
| Race TTKTT | 0.12 | 0.22** | 0.18* | 1 | |
| Race TTKSK | 0.25*** | 0.01 | o.16* | 0.15* | 1 |
OS2019 is off season 2019, MS2019 is main season 2019, OS2020 is off season 2020, ***, ** and * = significance at p < 0.001, p < 0.01 and p < 0.05, respectively
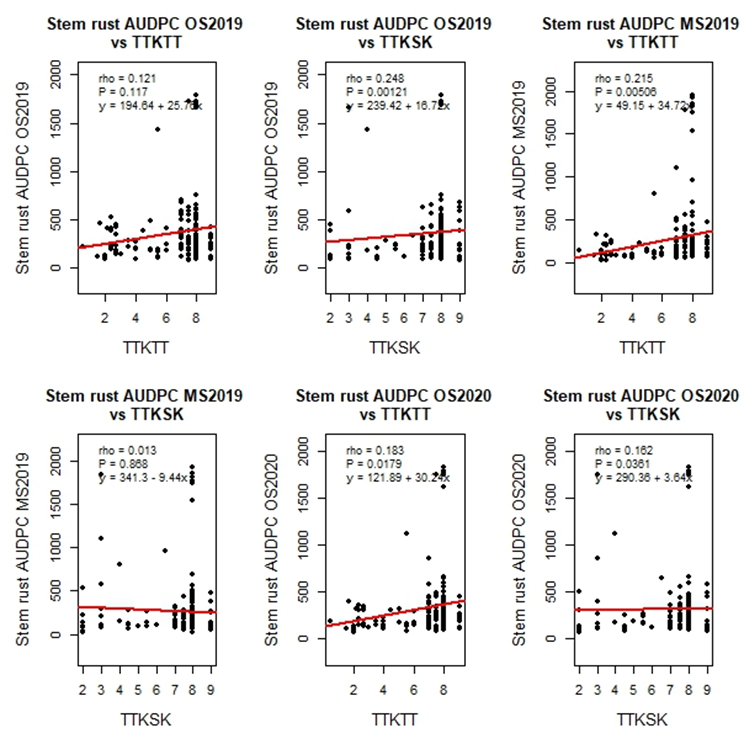
Figure 4: Correlation plots showing the relationships between races TTKSK and TTKTT with AUDPC- stem rust area under disease progression curve.
One hundred and twenty-four (74%) lines showed PBC phenotype whereas 42 (26%) did not. Among 124 lines, 52 showed slight PBC with score of 1, 42 lines showed median PBC with score of 2, 28 lines displayed high PBC with score of 3 whereas only lines 6021 and 6032 showed high PBC (score of 4). Out of 168 wheat lines, 139 (83%) lines displayed LTN whereas 17% were without any visible LTN. Of these, 98, 38 and 3 showed slight, median and high LTN with scores of 1, 2 and 3, respectively.
The stem rust resistance genes Sr2, Sr12 and Sr8155B1 were detected either singly or in combination in all lines except 6006, 6024, 6078, 6111, 6123, 6130, 6132, 6134, 6146, 6151, 6152, 6155, 6157, 6159 and 6162. The resistant allele for marker NB-LRR3 which co-segregates with Sr12 gene was present in 131 lines (78%), 28 lines could not be validated for this gene while 8 lines amplified susceptible allele. Presence of Sr2 was validated in cultivar Kingbird and other 47 lines while the susceptible allele was observed in 73 lines. Presence or absence of Sr2 was inconclusive in 48 lines. It was observed that among the 47 lines with Sr2, all except lines 6005, 6034, 6053, 6055, 6057, 6091, 6095 and 6102 had the PBC phenotype in the field, while 69% of the lines that exhibited PBC were negative for Sr2. The IWB10558 marker confirmed presence of Sr8155B1 in 50 lines while it was absent in 87 lines. Presence of this gene could not be ascertained in 31 lines.
Hierarchical clustering (Figure 5) grouped the 168 lines into four major clusters. All clusters contained present and absent marker combinations. Many lines simultaneously possess Sr12 together with LTN and occasionally Sr8155B1 especially in cluster 4 and cluster 3. Cluster one had a high frequency of missing data while cluster 2 is dominated by lines carrying Sr12 together with frequent absence of Sr2 and LTN.
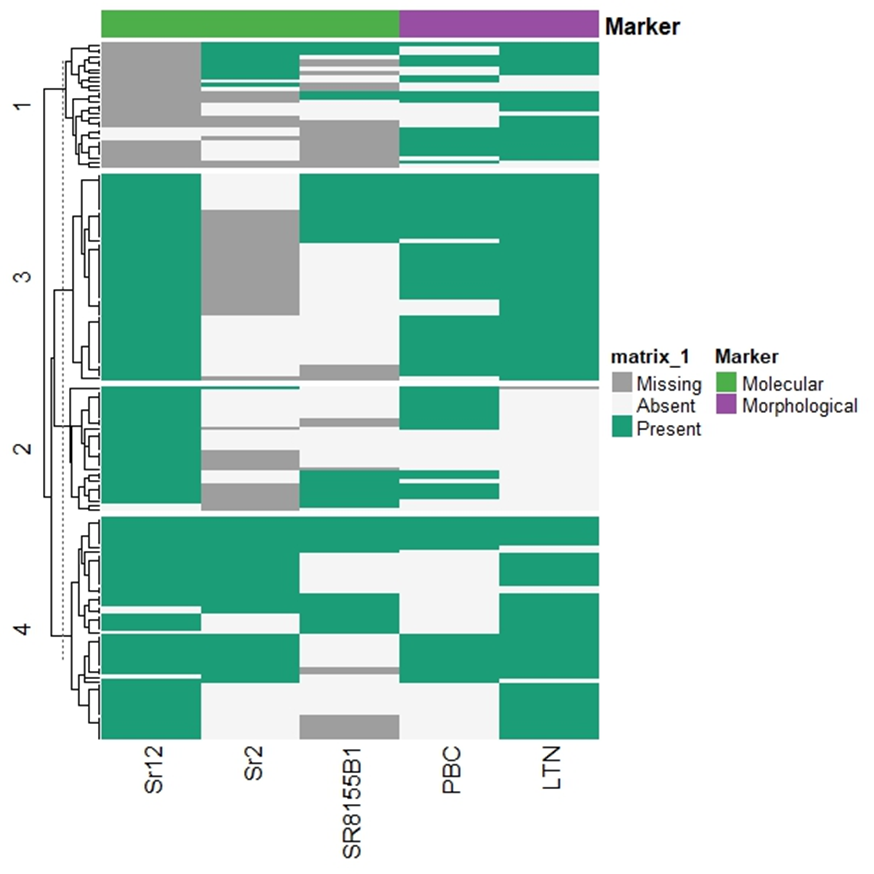
Figure 5: Hierarchical clustering heatmap of molecular and morphological markers associated with stem rust resistance, where green = presence of a resistant allele or phenotype, white = absence, and grey represents missing data. Rows = wheat lines and columns = markers (Sr12, Sr2, Sr8155B1, pseudo black chaff (PBC) and leaf tip necrosis (LTN)].
Genetic variability for stem rust resistance in wheat genotypes is important for identification and selection of resistant genotypes. Differential response of lines to stem rust races TTKTT and TTKSK in this study suggest that the genes that were present in test lines conferred different levels of resistance. A low frequency of lines resistant to the 2 races suggests that genes effective for seedling resistance to stem rust in these lines are scarce. Among these lines, sister lines 6132-6133 (Wbll1*2/Brambling*2//Bavis/3/Misr1), 6135-6136 (Wbll1*2/Brambling*2//Bavis/3/Kfa/2*Kachu) with resistance to both races TTKSK and TTKTT, constitutes a common parentage of WBLL1, Brambling and Bavis in their pedigree and this could be an indication that either one or combinations of either of these parents has resistance for both races. The study also showed that sister lines 6163-6164 (Frncln//Kiritati/2*Trch/3/Frncln/4/SwSr22T.B./2*Blouk#1//Wbll1*2/Kuruku) have the Sr22 gene in their pedigree which is reportedly still effective to the virulence of races TTKTT and TTKSK (Sharma et al., 2015) and hence could still explain their resistance phenotypes.
Race TTKTT is virulent on wheat lines carrying Sr31, Sr24 and SrTmp while TTKSK is virulent on Sr31 and Sr38 (Jin et al., 2007, 2008; Newcomb et al., 2016). Fewer lines were more resistant to TTKTT than TTKSK and this was expected given the wide virulence spectrum of TTKTT. Eight lines that were resistant to TTKSK but susceptible to TTKTT probably possess the Sr24 and SrTmp genes which are effective against the virulence of race TTKSK. This study hypothesized that line 6081 that was susceptible to TTKSK but resistance to TTKTT could be having a different resistance gene (s) effective to TTKTT, given that races TTKTT and TTKSK are both virulent on Sr31. Therefore line 6081 is a potential candidate for further genetic analysis to identify the possible sources of genetic resistance to TTKTT. Newcomb et al. (2016) identified 23% of the 169 advanced wheat lines from Kenya that were resistant to TTKSK but susceptible to TTKTT. However, they identified only 2% of the 119 lines in CIMMYT lines that were susceptible to TTKTT and resistant to TTKSK, which if compared to a proportion of 5% identified in this study further reveals limited available sources of resistance to virulence of TTKTT. However, contrary to the observations from this study and observations from Newcomb et al. (2016), Ethiopian lines had a frequency of 91% of the lines that were resistant to TTKSK but susceptible to races virulent to Sr24 and SrTmp genes (Hundie et al., 2019). The susceptible check PBW343 has the Sr31 gene in its background and as expected, lines with cultivar Attila parentage, which also carry the Sr31 gene, showed high ITs. Nonetheless, the Sr31 gene is still effective on some non-relative races of Ug99 which makes the lines identified in this investigation as susceptible to Ug99, promising genetic stocks in countries where Ug99 is not a menace. For instance, in Germany, where Ug99 is yet to be reported, Flath et al. (2018) identified 11 out of 97 German winter wheat cultivars protected from stem rust at the seedling and adult stage by Sr31.
Differential response of lines to rust infections across seasons can be attributed to the different prevailing weather conditions especially since the OS2019 had warmer temperature which normally favors stem rust infections compared to MS2019 and OS2020. Similar seasonal variations to rust infections were observed by Njau et al. (2010) after evaluating the 1st SRRSN for stem rust infections across 4 seasons. They noted that the check cultivars were more infected in the offseason of 2007 than in the main season of 2007. A widely adopted criterion for interpreting stem rust, associates field responses of R–MR with low disease severity as being consistent with hypersensitive resistance often indicative of presence of major resistance genes, whereas M, MSS and S responses accompanied by low severity are generally considered indicative of APR (Nazari et al., 2008; Rouse et al., 2011). Using this interpretive framework, lines 6133, 6163, and 6164 consistently exhibited low severity with R–MR responses across seasons, suggesting the presence of adequate resistance. Nevertheless, supporting evidence for gene presence using molecular marker analyses is necessary, since field disease expression is often influenced by epidemic timing, plant phenology, environmental conditions and interactions with other diseases.
The lines were categorized into three groups following thresholds previously published, where categories of 1–30%, 31–50%, and >50% severity relative to the most susceptible check has been used to distinguish high, intermediate, and low levels of field resistance, respectively (Singh et al., 2015; Hei et al., 2017; Hundie et al., 2018). Group one lines were presumed to have high to adequate levels of APR with severities and rAUDPC of less than 30%, owing to their capacity to reduce the rate of disease increase after successful establishment. Fifty-six lines were consistently in this group across the 3 seasons. Their consistently low severity is compatible with effective APR, although additional genetic analyses would be required to determine the underlying resistance mechanisms. Lines in group two had moderate disease development and may provide useful resistance under some production environments but could be less reliable under high disease pressure hence needs to be prudently deployed in breeding programs. The moderate resistance observed could indicate the absence of a sufficient number of minor genes required to condition adequate resistance or their maybe confounding effects from the segregation of genes present in these lines. Lines in group three displayed high disease severity, suggesting that the resistance present was insufficient under the prevailing epidemic conditions or that previously effective resistance genes were ineffective against the local pathogen population, as is the case with SrTmp gene in the susceptible check Robin (Newcomb et al., 2016).
As in the wheat-stem rust pathosystem, wheat-yellow rust resistance is also influenced by major and minor genes. Similarly major genes condition complete and discrete yellow rust resistance and have also been implicated in loss of effectivity when exposed to new virulent races (Chen, 2005). However, field responses alone cannot unequivocally distinguish between major and minor genes because of variability in environmental conditions, pathotypes and plant growth plasticity. In this study, lines with yellow rust response categorized in the first group had 92% of lines, exhibiting severities less than 30%. These low severities are consistent with presence of effective APR. Within this group, 14 lines that had stable immune reactions across the three seasons, may reflect the presence of highly effective resistance genes, complementary effects of multiple resistance genes, or favorable genotype-by-environment interactions. Among the 92%, 42 lines had MS to MSS, coupled with low final disease severities, which are consistent with partial resistance that limits disease development under field conditions. Similar findings have been reported by Gyawali et al., (2018) on stripe rust resistance in barley genotypes and on wheat, high levels of APR have been reported by Safavi and Afshari (2017).
Lines with resistance to both stem rust and yellow rust (48%) across the 3 seasons were expected since the concept of multiple disease resistance has been incorporated in the current breeding schemes at CIMMYT in the form of durable triple rust resistance genes effective against races present worldwide. CIMMYT derived genotypes with a combination of stem rust and yellow rust genes have been identified by Huerta-Espino et al., (2020) in wheat cultivars released in Mexico. Susceptibility to yellow rust and resistance to stem rust in 18% of the lines can be justified by reduced photosynthetic area for stem rust infection and spread subsequent to early onset of yellow rust epidemics which leads to reduced stem rust inoculum accumulation (Bancal et al., 2007).
Using the first two principal components, PCA summarized seasonal variation in APR among the lines, with a 94% total phenotypic variation. The lines response to stem rust was largely determined by a single dominant pattern represented by PC1.The close clustering of RMR, MR and M infection responses suggest that these resistance classes expressed relatively stable disease reactions across seasons, which is consistent with presence of effective resistance mechanisms that limit rust development irrespective of seasonal variation. In contrast, a broad dispersion and overlap among lines with S and MSS reactions indicates great phenotypic variability in rust development, which reflects differences in the degree of susceptibility and possible genotype × environment interactions. The strong positive association among seasons indicates that line rankings were largely conserved across seasons, which affirms the confidence that the identified resistant lines possess stable APR rather than season-specific responses. The slightly greater contribution of OS2019 to line discrimination may reflect higher rust pressure or more favorable environmental conditions for rust development during that season
Occasionally, genotypes that are susceptible at the seedling stage are sometimes resistant at the adult stage, a phenomenon termed as slow rusting. The weak correlations observed between seedling ITs and adult plant AUDPC indicate that seedling resistance was a poor predictor of field resistance in the lines. The broad range of AUDPC values observed among lines sharing identical ITs showed that similar seedling phenotypes had different field performances. Such variability is expected because race-specific seedling resistance genes are generally expressed early, whereas APR is governed by genes that become effective later in plant growth. Lines displaying susceptible ITs with relatively low AUDPC may possess one or more APR genes. However, this inference should be interpreted cautiously because field resistance was evaluated under a mixed-race epidemic, whereas seedling screening was conducted against individual stem rust races. In this study, 73% of the lines could be considered slow rusting, especially lines with cultivar Kiritati in their parentage, a cultivar known to possess combination of genes Sr2 and Lr34 (Bhavani et al., 2011). A total of 37 lines with cultivar Kiritati in their pedigree were all susceptible to both races at the seedling stage but had variable APR. Similarly, Njau et al. (2010) and Rouse et al. (2011) observed a high frequency of CIMMYT germplasm that were slow rusting.
Plotted heatmap revealed considerable variation among lines in the distribution and combinations of resistance-associated markers. The PBC and LTN were widely distributed on the heatmap, suggesting that these traits were common in the lines. These two traits did not always occur together, indicating that they may represent different resistance gene combinations or genetic backgrounds. Lines expressing PBC or LTN with absence of Sr2, Sr12 and Sr8155B1 are likely controlled by additional resistance loci beyond these genes. These results are in agreement with findings by Malik et al. (2013). They noted that in 135 bread wheat varieties screened for presence of the Sr2 gene using molecular markers and PBC phenotypes, there was 92% agreement between molecular marker results and presumed Sr2 status based on PBC. Similarly, Juliana et al. (2015) noted that PBC is associated with Sr2, although additional loci also influence its expression.
Of the 56 lines with stable APR across the 3 seasons, 90% of them expressed PBC and LTN markers. Gene Sr12 was present in 131 lines, some of which showed resistance both at seedling and adult plant stage while others were susceptible at both stages. Sr12 has been described as a seedling stage resistance gene that was shown to be ineffective against Ug99 races in seedling plants while being effective against the same races at the adult stage (Rouse et al., 2014). Among lines with resistance to both races, sister lines 6132-6133, 6135-6136 and 6163-6164 were also resistant at adult stage and positive for Sr12 and Sr8155B1. All the lines susceptible to TTKTT and TTKSK had genes Sr12, Sr2 and Sr8155B1 either singly or in combinations except 14 lines. A combination of Sr12 and Sr8155B1 in line 6093 seemed ineffective against stem rust at the adult stage. In this study, it was clear that genes Sr12, Sr2 and Sr8155B1 could be combined with other genes in appropriate backgrounds to confer resistance. Clustering demonstrated that APR in the evaluated lines is genetically diverse and is likely governed by combinations of multiple resistance loci rather than single resistance genes.
A total of 168 wheat genotypes from CIMMYT’s 13th Stem Rust Resistance Screening Nursery (SRRSN) were evaluated, along with susceptible check cultivars (Cacuke, PBW343 and Robin) and a resistant check cultivar (Kingbird). These 168 genotypes originated from diverse parental lines. Among them, 111 were single selections from specific crosses, while the remaining 57 included sibling lines. These lines had been selected and evaluated for agronomic performance under stem rust conditions in Kenya (Msundi et al., 2021). A set of 20 North American stem rust differential lines (Jin et al., 2008), were included in the study for identification of stem rust races TTKSK and TTKTT. Race TTKSK is virulent on genes Sr5, Sr6, Sr7a, Sr7b, Sr8a, Sr8b, Sr9a, Sr9b, Sr9d, Sr9e, Sr9g, Sr10, Sr11, Sr12, Sr15, Sr16, Sr17, Sr18, Sr19, Sr20, Sr23, Sr30, Sr31, 3Sr4, Sr38 and SrMcN and avirulent on genes Sr13, Sr22, Sr24, Sr25, Sr26, Sr27, Sr36 and SrTmp (Jin et al., 2007, 2008). Race TTKTT is virulent on genes Sr4, Sr31, SrTmp, Sr5, Sr21, Sr9e, Sr7b, Sr10, Sr11, Sr6, Sr8a, Sr9g, Sr9b, Sr38 and SrMcN but avirulent on genes Sr36, Sr22, Sr25, Sr26, Sr27, Sr32, Sr35, Sr37, Sr39, Sr40, Sr45 and Sr50 (Newcomb et al., 2016).
Stem rust seedling resistance evaluations were conducted against races TTKSK and TTKTT at the United States Department of Agriculture-Agricultural Research Service (USDA-ARS), Cereal Disease Laboratory (CDL), St. Paul, Minnesota, USA. Wheat lines were evaluated in two independent biological replications for each race. In each replication, 10 seeds of each line were sown in plastic pots (6.7 × 6.7 × 6 cm) filled with approximately 20 g of fine-grade vermiculite amended with 20-20-20 NPK fertilizer with an approximate density of 0.12 g/cm³. Following emergence, seedlings were thinned to 5 seedlings per pot.
Urediniospores of races TTKSK and TTKTT stored at -80 °C were heat-shocked at 43 °C in a water bath for 15 min to activate dormant spores (Jin et al., 2008), then rehydrated for 2 h in a sealed chamber maintained at 20 °C and 80% relative humidity generated using a 5.32 molar solution of KOH (Rowell, 1984; Pretorius et al., 2012). The spores were suspended in dH2O and 0.5 ml l-1 of light weight mineral oil (SoltrolÒ 170 isoparaffin) at an approximate concentration of 3.96 ×10⁶ spores ml-1, determined independently for each race using a hemocytometer. Spores were inoculated on 7–9-day old seedlings at growth stage (GS) 13 (Zadoks et al., 1974), using a hand sprayer (Stakman et al., 1962). Inoculated seedlings were incubated in a dark dew chamber at 100% relative humidity and 16–18 °C for 48 h before being transferred to greenhouse benches maintained at 18–25 °C, 60–80% relative humidity, and an 8 h and16 h, day and night photoperiod, respectively (Jin et al., 2007).
Fourteen days after inoculation, infection types (ITs) were scored on individual seedlings using the 0–4 scale of Stakman et al. (1962), with "+" and "−" designations indicating relatively larger and smaller pustule sizes, respectively. Infection types of “0”, “;” “1”, “2”, “2-” and “2+” were classified as resistant, whereas ITs of “3”, “3-”, “3+” and “4” were classified as susceptible. When both resistant and susceptible ITs were observed on seedlings of the same line within or across replications, the line was classified as having a mixed ITs and was recorded as intermediate. Final line classifications were based on the arithmetic mean or intermediate score of their component ITs across replicates.
The test lines along with checks were evaluated in the field at Kenya Agricultural and Livestock Research Organization (KALRO) Njoro (35º 56′ 0" E, 0º 20′ 0" S), an area which is elevated at 2,185 m above sea level and normally receives an annual average precipitation of 1000 mm. This site experiences an average minimum and maximum temperature of 9 oC and 22 oC, respectively (Jaetzold et al., 2012). The study was conducted for 3 seasons: off season in January to May 2019 (OS2019), main season in July to November 2019 (MS2019) and off season in January to May 2020 (OS2020). A well-drained field previously planted with canola (Brassica napus) as a cover crop was selected for the study. Canola is widely used in wheat rotations, as it helps interrupt the life cycles of wheat pathogens and enhances soil health for the subsequent wheat crop. The land was disc-ploughed once and harrowed twice to produce a fine seedbed suitable for wheat planting. Each line was planted in a 2-row plot measuring 0.2 m × 0.75 m, separated by 0.2 m alley spacing between rows and 0.5 m spacing between adjacent blocks and replicates at an equivalent seeding rate of 125 kg ha-1 in a 21×8 alpha lattice design with 3 replicates. At sowing time, 22.5kg N ha-1 and 25.1 kg P ha-1 were supplied from an application of diammonium phosphate ((NH₄) ₂HPO₄) at an equivalent rate of 125 kg ha-1. In all seasons, trials were sprinkler-irrigated immediately after planting to ensure uniform germination and seedling establishment, with supplementary irrigation applied as required. A pre-emergence application of Stomp® 455 CS was used to deliver pendimethalin at 1.37 kg ha⁻¹ for early weed control. Broadleaf weeds were controlled at growth stage (GS) 13–46 using the post-emergence herbicide Buctril® MC, applied to deliver 0.28 kg ha⁻¹ bromoxynil octanoate and 0.28 kg ha⁻¹ MCPA 2-ethylhexyl ester. A single row of a spreader mixture of susceptible wheat genotypes Cacuke, Robin and Sr24-carrying lines GID5391050, GID5391052, GID5391056, GID5391057, GID5391059 and GID5391061 was planted perpendicular to the entries as disease spreaders within the replicates after every 2 blocks and as quad rows around the experimental unit. Artificial stem rust epidemic was created through syringe inoculation of disease spreader plants at growth stage GS47 (Zadoks et al., 1974) with a suspension of urediniospores of stem rust races TTKSK, TTKTK, TTKST and TTKTT in dH2O water mixed with 1 mg L-1 of Tween 20 using a hyperdermal syringe as used by Olivera et al. (2012).
At post-flowering stage GS 60–69 (Zadoks et al., 1974), stem rust as well as natural yellow rust infection was assessed in all plots at 7-day intervals over three assessments, commencing when the susceptible check varieties exhibited 50% disease severity. Modified-Cobb¢s scale (0 to 100%) was used to evaluate rust severity based upon percentage area of the plant affected (Peterson et al., 1948). Infection response for each line was evaluated using categorical scores of resistant (R), moderately resistant (MR), moderately resistant to moderately susceptible (MR-MS or M), moderately susceptible (MS), moderately susceptible to susceptible (MSS) and susceptible (S) based on the pustule size and amount of chlorosis and necrosis associated with the pustule. In each season, the infections were summarized by determining the highest severity and response across replications and using the highest severity and infection response across seasons to categorize lines into resistant and susceptible groups. Partial resistance of wheat lines to stem rust and yellow rust was assessed using the area under disease progressive curve (AUDPC) and relative AUDPC (rAUDPC) computed as suggested by Wilcoxson et al. (1975) using the formula\(:\ \)
\(AUDPC = \sum_{i = 1}^{n}(\frac{x_{i + 1} + x_{i}}{2})(t_{i + 1} - t_{i})\)
where n = the number of disease readings taken, ti = time of each reading in days, xi = disease severity on the ith date, ti+1 is second assessment date of two consecutive assessment and xi+1 = disease severity on assessment date (i+1). The relative AUDPC were computed as a percentage of the ratio of AUDPC of given genotype to AUDPC of most susceptible check. The AUDPC scores of the 168 lines reported in this study for the OS2019 and MS2020 were previously used to evaluate the lines for agronomic performance under stem rust infections (Msundi et al., 2021).
Presence of leaf tip necrosis (LTN) and the pseudo black chaff (PBC) were evaluated using a 0-4 scale (where 0 = no PBC pigmentation or LTN, 1 =slight PBC or LTN, 2 = medium PBC or LTN, 3 = high PBC or LTN and 4 = very high PBC or LTN) (Juliana et al., 2015) at the soft dough stage (GS 85) (Zadoks et al., 1974). PBC was used to ascertain presence of Sr2 while LTN indicated presence of Lr34, Lr46, Lr67 or their combinations (Juliana et al., 2015).
Genomic DNA was extracted using CTAB (cetyltrimethylammonium bromide) from leaf tissue of three-week-old wheat seedlings (GS 12) grown in plastic pots (6.7 × 6.7 × 6 cm) filled with approximately 20 g of fine-grade vermiculite. Approximately 1.5 cm of the youngest fully expanded leaf was collected and subsequently frozen at −80 °C overnight for lyophilization. Fifty mg of lyophilized and ground leaf tissue was incubated with 800 µl CTAB buffer at 65 °C for 45 min with gentle shaking. Following incubation, 800 µl chloroform isoamyl alcohol (24:1) was added, mixed by vortexing for 2 mins and centrifuged for 15 min at 7826 × g relative centrifugal force (RCF) in a refrigerated microcentrifuge with a 7 cm radius, to separate phases and remove cell debris. Approximately 800 µl of the aqueous supernatant was transferred to a new 2 ml Eppendorf tube, where an equal volume of ice-cold 100% isopropanol was added, followed by centrifugation for 10 min at 4 °C of 7826 × g RCF to precipitate DNA from the solution. The resulting supernatant was discarded carefully, to avoid dislodging the DNA pellet at the bottom of the tubes. The resulting DNA pellet was washed with 800 µl of 70% ethanol followed by centrifugation for 5 min at 4 °C of 7826 × g RCF, then the samples were incubated with RNase A at 37°C for 30 min for RNA removal, following which the supernatant was discarded. The DNA was air-dried and resuspended in 100 μl of 1× Tris Borate EDTA buffer (TBE) (100 ml 10× TBE + 900 ml water).
The concentrations of the extracted DNA were assessed using a NanoDrop 2000c spectrophotometer (Thermo Fisher Scientific, Waltham, MA, (USA). DNA quality and integrity were further evaluated by electrophoresis on a 1% agarose gel prepared in 1× TBE buffer (1 g agarose 100 ml -1 of buffer). Approximately 5 µl of each DNA sample was loaded into separate wells of the agarose gel and electrophoresed at 100 V for 1 hour alongside a DNA ladder. The DNA bands were subsequently visualized under ultraviolet light.
Gene-based molecular markers NB-LRR3, IWB10558, and wMAS000005, which are linked to the stem rust resistance genes Sr12, Sr8155B1 and Sr2, respectively, were used to determine the presence of resistance-associated alleles (Table 7). Marker polymorphisms were assessed using Kompetitive Allele-Specific PCR (KASP) assays. For all markers, each PCR reaction contained a 5 µl total reaction volume containing 2.43 µl of genomic DNA of 50 ng/µl, 2.5 µl of 2× KASP master mix [approximately 0.0125 U Taq polymerase, 400 µM of dNTPs, 1.25 mM of MgCl2, FRET cassettes (FAM and HEX dye), ROX reference dye and nuclease free water] and 0.07 µl primer mix containing allele 1 and allele 2 forward primers and one common reverse primer. PCR amplification was performed with an initial template denaturation at 94 °C for 15 min, followed by 20 cycles of 94 °C for 10 s, 57 °C for 5 s, and 72 °C for 10 s, and then 18 cycles of 94 °C for 10 s, 57 °C for 20 s, and 72 °C for 40 s. Hex and FAM dye fluorescence was used to distinguish alleles. FAM fluorescence was diagnostic for presence of allele 1 while HEX fluorescence indicated presence of allele 2. Fluorescence was measured as an endpoint reading at 25 °C. All KASP assays, including fluorescence readings, were repeated to ensure reproducibility.
Table 7. Kompetitive allele specific PCR (KASP) markers used to detect stem rust resistance genes in wheat lines.
| Gene | Marker | Chromosome | Primer sequences | Reference |
|---|---|---|---|---|
| Sr2 | wMAS000005 | 3BS | A1- 5' GTGCGAGACATCCAACACTCAC 3' A2- 5' GTGCGAGACATCCAACACTCAT 3' C1- 3' CTCAAATGGTCGAGCACAAGCTCTA 5' |
Mago et al. (2011) |
| Sr12 | NB-LRR3 | 3BS | A1- 5' CAGCAACTCAAGATGCTTCTGAG 3' A2- 5' CAGCAACTCAAGATGCTTCTGAA 3' C1- 3' ATCAGCAGATCACGAGACCAA 5' |
Hiebert et al. (2016) |
| Sr8155B1 | IWB10558 | 6AS | A1- 5' GAAGGTGACCAAGTTCATGCTGATGGTTGTATACGGGCCTATGG 3' A2- 5' GAAGGTCGGAGTCAACGGATTGATGGTTGTATACGGGCCTATGA 3' C1- 3' CTCAGCTGGCATGTATTTTTGGGGAT 5' |
Nirmala et al. (2017) |
A1=forward primer or FAM primer for allele 1, A2=forward primer or HEX primer for allele 2, C1-common reverse primer, KASP = Kompetitive allele specific polymerase chain reaction (PCR).
The seasonal means of disease severity, AUDPC and rAUDPC were computed together with their standard error (SE) as:
\(SE = \ \frac{S}{\sqrt{n}}\)
where S is the sample standard deviation and n is the number of lines. Principal component analysis was conducted in R (version 4.6.0) using the FactoMineR, factoextra and ggplot2 R packages. Eigenvalues, percentage of explained variance, cumulative variance and variable loadings were derived from the covariance matrix of the standardized data, where covariance (S) is given by:
\(S = \frac{1}{n - 1}X^{T}X\)
where X is the original observation (disease severity), \(X^{T}\) is the transpose of the value of X and n is the number of samples. The eigen value of the \(i^{th}\)principal component was calculated as eigen value decomposition:
(\({Sa}_{i}) = \lambda_{i}a_{i}\ \)
where \(\lambda_{i}\) is the eigen value and \(a_{i}\) is the principal component coefficients (eigen vector). The percentage of explained variance by the ith principal component was calculated as:
% variance = \(\frac{\lambda_{i}}{\sum_{i = 1}^{p}\lambda_{i}}\ \times 100\ \)
where \(\lambda_{i}\) is the eigen value and \(\sum_{i = 1}^{p}\lambda_{i}\) is the sum of eigenvalues of all p principal components. The cumulative variance explained was given by:
Cumulative variancev \(= \frac{\sum_{i = 1}^{v}\lambda_{i}}{\sum_{1 = 1}^{p}\lambda_{i}}\ \times 100\)
where \(\sum_{i = 1}^{v}\lambda_{i}\) is the sum of eigen values of v principal components and \(\sum_{i = 1}^{p}\lambda_{i}\) is the sum of eigenvalues of all p principal components (Jolliffe, 2025).
Spearman's rank correlation coefficient (ρ) was used to evaluate the association between seedling and adult plant infections in R software (version 4.6.0). Adult plant AUDPC values were derived from the adjusted genotype means for each season, while seedling ITs recorded using the Stakman 0–4 ITs scale, were converted to an ordinal numerical scale by assigning increasing scores to increasing levels of susceptibility whereby ‘;’= 0, ‘;1’ = 0.5, ‘1’ = 1, ‘1+’ = 1.5, ‘2−’ = 2, ‘2’ = 3, ‘2+’ = 4, (‘2’ ‘2-’) = 4.5, (‘2’ ‘2+’) = 5, ‘3−’ = 6, ‘3’ = 7, ‘3+’ = 8, (‘3’ ‘3-’) = 8.5 and (‘3’ ‘3+’) = 9 (Zhang et al., 2014). Mixed ITs were assigned numerical values corresponding to the arithmetic mean or intermediate score of their component ITs (Gao et al., 2016). Correlation analyses were performed separately for each race in each season using the equation:
ρ = \(\frac{\sum_{i = 1}^{n}{\left( R_{xi} - {\overline{R}}_{x} \right)\ \left( R_{yi} - {\overline{R}}_{y} \right)}}{\sqrt{\sum_{i = 1}^{n}\left( R_{xi} - {\overline{R}}_{x} \right)^{2}}\sqrt{\sum_{i = 1}^{n}\left( R_{yi} - {\overline{R}}_{y} \right)^{2}}}\ \)
where ρ is the Spearman’s rank correlation coefficient, \(R_{xi}\) is the rank of the i-th observation for variable X, \(R_{yi}\) is the rank of the i-th observation for variable Y, \({\overline{R}}_{x}\)and \({\overline{R}}_{y}\)is the mean rank and n is the number of observations (Zar, 2014). Scatterplots with fitted trend lines were generated using the ggplot2 package in R to visualize the relationship.
Molecular and morphological marker scores were coded as present (1) for the resistant allele or presence of a trait, absent (0) for the susceptible allele or absence of a trait and (NA) for failed molecular marker calls with missing values (NA). Molecular and morphological markers were used to perform hierarchical clustering using ComplexHeatmap, circlize, and grid R software packages (version 4.6.0). Pairwise dissimilarities were calculated using Euclidean distance metric given by:
\(d_{ij}\)=\(\sqrt{\sum_{k = 1}^{p}\left( x_{ik} - x_{jk} \right)^{2}}\)
where \(d_{ij}\) is the Euclidean distance between i and j, \(x_{ik}\) is the value of the kth variable for genotype i, \(x_{jk}\) is the value of the kth variable for genotype j and p is the number of marker (Johnson and Wichern, 2002).
Evaluation of the 13th SRRSN lines against the most predominant races in Kenya, showed that race TTKTT was more virulent on a larger proportion of the evaluated lines than TTKSK. Ten lines with combined resistance to virulence of races TTKTT and TTKSK were identified. Among lines with resistance to TTKTT and TTKSK virulence, 5 had adult plant resistance exceeding the commercial resistant check. The detection of this resistance highlights the potential of combining seedling and adult plant resistance for durable stem rust control. These resistant lines provide valuable genetic resources for wheat breeding programs aimed at developing high-yielding cultivars with stable and broad-spectrum rust resistance. The effectiveness of genes Sr12, Sr2 and Sr8155B1 in conferring resistance either at the seedling or adult stage depended to a large extent on the genetic background of a particular line. Lines with combinations of PBC, LTN, Sr12, Sr2, and Sr8155B1 represent potential sources of durable stem rust resistance. Conversely, lines carrying only morphological markers or individual molecular markers need further validation of resistance backgrounds.
We thank Egerton University and the Centre for Excellence in Agriculture and Agribusiness Management (CESAAM), the Kenya Agricultural and Livestock Research Organization (KALRO)-Food Crops Research Center Njoro and the International Maize and Wheat Improvement Center (CIMMYT) through Accelerating Genetic Gains in Maize and Wheat (AGG) project for supporting this research.
E.A.M, J.O.O, M.E.O, M.S.R and S. B conceptualized the study; E.A.M. and M.S.R. performed the research; E.A.M. analyzed the data and compiled the first draft; E.A.M., J.O.O., M.E.O., M.S.R. and S. B contributed to results interpretation and critically revised the manuscript. All authors approved the final draft for publication.
The authors declare no conflict of interest.
All the data and supplementary materials used to present the findings of this publication are availed within this article and partly the data on field screening for AUDPC for two seasons were adopted from Msundi et al. (2021).
The authors confirm that this manuscript was written entirely without the use of generative artificial intelligence (AI) tools.
Bancal MO, Robert C, Ney B (2007) Modelling wheat growth and yield losses from late epidemics of foliar diseases using loss of green leaf area per layer and pre-anthesis reserves. Annals of Botany. 100(4): 777-789.
Bansal U, Harbans B, Debbie W, Mandeep R, Thomas W, Matthew H, Beat K (2014) Molecular mapping of an adult plant stem rust resistance gene Sr56 in winter wheat cultivar Arina. Theoretical and Applied Genetics. 127(6): 1441-1448.
Bhavani S, Hodson DP, Huerta-Espino J, Randhawa MS, Singh RP (2019) Progress in breeding for resistance to Ug99 and other races of the stem rust fungus in CIMMYT wheat germplasm. Frontiers of Agricultural Science and Engineering. 6(3): 210-224.
Bhavani S, Singh RP, Argillier O, Huerta-Espino J, Singh S, Njau P, Brun S, Lacam S, Desmouceaux N, McIntosh RA (2011) Mapping durable adult plant stem rust resistance to the race Ug99 group in six CIMMYT wheats. Paper presented at Borlaug Global Rust Initiative 2011 Technical Workshop, Saint Paul, Minnesota, USA, 13-16 June 2011.
Chen XM (2005) Epidemiology and control of stripe rust (Puccinia striiformis f. sp. tritici) on wheat. Canadian Journal of Plant Pathology. 27(3): 314-337.
Duplessis S, Lorrain C, Petre B, Figueroa M, Dodds PN, Aime MC (2021) Host adaptation and virulence in heteroecious rust fungi. Annual Review of Phytopathology 59(1): 403-422.
Dyck PL (1987) The association of a gene for leaf rust resistance with the chromosome 7D suppressor of stem rust resistance in common wheat. Genome. 29(3): 467-469.
Ellis JG, Lagudah ES, Spielmeyer W, Dodds PN (2014) The past, present and future of breeding rust resistant wheat. Frontiers in Plant Science. 5:641.
Fetch TG, Park RF, Pretorius ZA, Depauw RM (2021) Stem rust: its history in Kenya and research to combat a global wheat threat. Canadian Journal of Plant Pathology. 43(2): S275-S297.
Flath K, Miedaner T, Olivera PD, Rouse MN, Jin Y (2018) Genes for wheat stem rust resistance postulated in German cultivars and their efficacy in seedling and adult‐plant field tests. Plant Breeding. 137(3): 301-312.
Gao L, Turner MK, Chao S, Kolmer J, Anderson JA (2016) Genome wide association study of seedling and adult plant leaf rust resistance in elite spring wheat breeding lines. PLoS One. 11(2):0148671.
Gyawali S, Verma RPS, Kumar S, Bhardwaj SC, Gangwar OP, Selvakumar R, Sharma‐Poudyal D (2018) Seedling and adult‐plant stage resistance of a world collection of barley genotypes to stripe rust. Journal of Phytopathology. 166(1): 18-27.
Hei NB, (2017) Evaluation of wheat cultivars for slow rusting resistance to leaf rust (Puccinia trticina Eriks) in Ethiopia. African Journal of Plant Science. 11(2): 23-29.
Herrera-Foessel SA, Lagudah ES, Huerta-Espino J, Hayden MJ, Bariana HS, Singh D, Singh RP (2011) New slow-rusting leaf rust and stripe rust resistance genes Lr67 and Yr46 in wheat are pleiotropic or closely linked. Theoretical and Applied Genetics. 122(1): 239-249.
Herrera-Foessel SA, Singh RP, Huerta-Espino J, Rosewarne GM, Periyannan SK, Viccars L, Calvo-Salazar V, Lan C, Lagudah ES (2012) Lr68: a new gene conferring slow rusting resistance to leaf rust in wheat. Theoretical and Applied Genetics. 124(8): 1475-1486.
Herrera-Foessel SA, Singh RP, Lillemo M, Huerta-Espino J, Bhavani S, Singh S, Lan C, Calvo-Salazar V, Lagudah ES (2014) Lr67/Yr46 confers adult plant resistance to stem rust and powdery mildew in wheat. Theoretical and Applied Genetics. 127(4): 781-789.
Hiebert CW, Kolmer JA, McCartney CA, Briggs J, Fetch T, Bariana H, Choulet F, Rouse MN, Spielmeyer W (2016) Major gene for field stem rust resistance co-locates with resistance gene Sr12 in ‘Thatcher’wheat. PloS One. 11(6): 0157029.
Hodson DP, Grønbech-Hansen J, Lassen P, Alemayehu Y, Arista J, Sonder K, Kosina P, Moncada P, Nazari K, Park RF, Pretorius ZA, Szabo LJ, Fetch T, Jin Y (2012) Tracking the wheat rust pathogens. Paper presented at the Proceedings of Borlaug Global Rust Initiative Technical Workshop, Beijing, China, 2012. http://www.globalrust.org/sites/default/files/BGRI-2012/.
Huerta-Espino J, Singh R, Crespo-Herrera LA, Villaseñor-Mir HE, Rodriguez-Garcia MF, Dreisigacker S, Barcenas-Santana D, Lagudah E (2020) Adult plant slow rusting genes confer high levels of resistance to rusts in bread wheat cultivars from Mexico. Frontiers in Plant Science. 11: 824-824.
Hundie B, Girma B, Tadesse Z, Edae E, Olivera P, Abera EH, Bulbula WD, Abeyo B, Badebo A, Cisar G, Brown-Guedira G (2019) Characterization of Ethiopian wheat germplasm for resistance to four Puccinia graminis f. sp. tritici races facilitated by single-race nurseries. Plant Disease. 103(9): 2359-2366.
Hundie B, Yirga F, Kassa D, Hailu E, Negash T, Tesfaye T, Bacha N, Shewaye Y, Woldeab G, Zegaye H, Tadesse Z (2018) Evaluation of advanced bread wheat lines for field and seedling resistance to stem rust (Puccinia graminis f. sp. tritici). American Journal of Biological and Environmental Statistics. 4:74.
Hussain M, Khan MA, Ali Y, Javaid MM, Iqbal B, Nasir M, Sabir W, Muhammad F (2017) Wheat breeding for durable rust resistance and high yield potential in historical prospective and current status. Advanced Zoology and Botany 5(4):55-63.
Jaetzold R, Schmidt H, Hornetz B, Shisanya C (2012) Farm Management Handbook of Kenya. In 2005-2012 Production handbook of Kenya, 2nd edn, Ministry of Agriculture, Nairobi, Kenya, in cooperation with the German Agency for Technical Cooperation. 1–4.
Jin Y, Singh RP, Ward RW, Wanyera R, Kinyua M, Njau P, Fetch T, Pretorius ZA, Yahyaoui A (2007) Characterization of seedling infection types and adult plant infection responses of monogenic Sr gene lines to race TTKS of Puccinia graminis f. sp. tritici. Plant Disease. 91(9): 1096-1099.
Jin Y, Szabo LJ, Pretorius ZA, Singh RP, Ward R, Fetch Jr T (2008) Detection of virulence to resistance gene Sr24 within race TTKS of Puccinia graminis f. sp. tritici. Plant Disease. 92(6): 923-926.
Johnson R (1984) A critical analysis of durable resistance. Annual Review of Phytopathology. 22(1): 309-330.
Johnson RA, Wichern DW (2002) Applied multivariate statistical analysis. 5th edn. Upper Saddle River (NJ), Prentice Hall, 670-675.
Jolliffe I (2025) Principal Component Analysis. In International Encyclopedia of Statistical Science. Berlin, Heidelberg, Springer Berlin Heidelberg. 1945-1948.
Juliana P, Rutkoski JE, Poland JA, Singh RP, Murugasamy S, Natesan S, Barbier H, Sorrells ME (2015) Genome‐wide association mapping for leaf tip necrosis and pseudo‐black chaff in relation to durable rust resistance in wheat. The Plant Genome. 8(2): 1-15.
Karelov A, Kozub N, Sozinova O, Pirko Y, Sozinov I, Yemets A, Blume Y (2022) Wheat genes associated with different types of resistance against stem rust (Puccinia graminis Pers.). Pathogens. 11(10): 1157.
Mago R, Brown-Guedira G, Dreisigacker S, Breen J, Jin Y, Singh R, Appels R, Lagudah ES, Ellis J, Spielmeyer W (2011) An accurate DNA marker assay for stem rust resistance gene Sr2 in wheat. Theoretical and Applied Genetics. 122(4):735-44.
Malik R, Parveen S, Saharan MS, Kumar R, Sharma AK, Bhardwaj SC, Sharma I (2013) Characterization of stem rust resistance gene Sr2 in Indian wheat varieties using polymerase chain reaction (PCR) based molecular markers. African Journal of Biotechnology. 12(18):2353.
McFadden ES (1930) A successful transfer of emmer characters to vulgare wheat. Journal of the American Society of Agronomy. 22: 1020-1034.
McIntosh RA, Pretorius ZA (2011) Borlaug Global Rust Initiative provides momentum for wheat rust research. Euphytica. 179 (1): 1-2.
Msundi EA, Owuoche JO, Oyoo ME, Macharia G, Singh RP, Randhawa MS (2021) Identification of bread wheat genotypes with superior grain yield and agronomic traits through evaluation under rust epiphytotic conditions in Kenya. Scientific Reports. 11(1): 1-11.
Nazari K, Amini A, Yahyaoui A, Singh R (2008) Characterization of seedling and adult-plant resistance to stem rust race Ug99 in Iranian bread wheat landraces. A paper presented at the international conference on wheat stem rust (Ug99)-A threat to food security. ICARDA Aleppo, Syria, 6-8 November 2008.
Newcomb M, Olivera PD, Rouse MN, Szabo LJ, Johnson J, Gale S, Jin Y (2016) Kenyan isolates of Puccinia graminis f. sp. tritici from 2008 to 2014: Virulence to SrTmp in the Ug99 race group and implications for breeding programs. Phytopathology. 106(7): 729-736.
Nirmala J, Saini J, Newcomb M, Olivera P, Gale S, Klindworth D, Elias E, Talbert L, Chao S, Faris J, Xu S (2017) Discovery of a novel stem rust resistance allele in durum wheat that exhibits differential reactions to Ug99 isolates. G3: Genes, Genomes, Genetics. 7(10):3481-90.
Njau PN, Jin Y, Huerta-Espino J, Keller B, Singh RP (2010) Identification and evaluation of sources of resistance to stem rust race Ug99 in wheat. Plant Disease. 94(4): 413-419.
Odemba M, Owuoche J, Okiror M, Wanyera R (2018) Evaluation of CIMMYT wheat (Triticum aestivum L.) lines for seedling and adult plant resistance to stem rust (Puccinia graminis f. sp. tritici) race Ug99 and its variants. International Journal of Agronomy and Agricultural Research. 12(4): 53-63.
Olivera PD, Jin Y, Rouse M, Badebo A, Fetch JT, Singh RP, Yahyaoui A (2012) Races of Puccinia graminis f. sp. tritici with combined virulence to Sr13 and Sr9e in a field stem rust screening nursery in Ethiopia. Plant Disease. 96(5):623-628.
Periyannan S, Milne RJ, Figueroa M, Lagudah ES, Dodds PN (2017) An overview of genetic rust resistance: from broad to specific mechanisms. PLoS Pathogens. 13(7): 1006380.
Peterson RF, Campbell AB, Hannah AE (1948) A diagrammatic scale for estimating rust intensity on leaves and stems of cereals. Canadian Journal of Research. 26(5): 496-500.
Pilet-Nayel ML, Moury B, Caffier V, Montarry J, Kerlan MC, Fournet S, Delourme R (2017) Quantitative resistance to plant pathogens in pyramiding strategies for durable crop protection. Frontiers in Plant Science. 8: 1838-1838.
Pretorius ZA, Jin Y, Bender CM, Herselman L, Prins R (2012) Seedling resistance to stem rust race Ug99 and marker analysis for Sr2, Sr24 and Sr31 in South African wheat cultivars and lines. Euphytica. 186(1): 15-23.
Rajaram S, Borlaug NE, Van Ginkel M (2002) CIMMYT international wheat breeding. Bread wheat improvement and production. FAO, Rome. 103-117.
Rajaram S, Ginkel MV, Fischer RA (1993) CIMMYT's wheat breeding mega-environments (ME). Paper presented at the international symposium on wheat genetics, Beijing, China, 20-25 July 1993.
Randhawa MS, Caixia L, Basnet BR, Bhavani S, Huerta-Espino J, Forrest KL, Hayden MJ, Singh RP (2018) Interactions among genes Sr2/Yr30, Lr34/Yr18/Sr57 and Lr68 confer enhanced adult plant resistance to rust diseases in common wheat (Triticum aestivum L.) line 'Arula'. Australian Journal of Crop Science. 12(6): 1023-1033.
Rouse MN, Wanyera R, Njau P, Jin Y (2011) Sources of resistance to stem rust race Ug99 in spring wheat germplasm. Plant Disease. 95(6): 762-766.
Rowell JB (1984) Controlled infection by Puccinia graminis f. sp. tritici under artificial conditions. In Bushnell WR, Roelfs AP The cereal rusts. Volume I: Origins, specificity, structure, and physiology. Orlando Academic Press. 291–332. doi:10.1016/B978-0-12-148401-9.50016-9.
Safavi S, Afshari F (2017) A seven-year assessment of resistance durability to yellow rust in some wheat cultivars in Ardabil province, Iran. Journal of Crop Protection. 6(3): 409-421.
Singh RP, Herrera-Foessel SA, Huerta-Espino J, Bariana H, Bansal U, McCallum B, Lagudah ES (2012) Lr34/Yr18/Sr57/Pm38/Bdv1/Ltn1 confers slow rusting, adult plant resistance to Puccinia graminis f. sp. tritici. Paper presented at the 13th international conference on cereal rust and powdery mildew, Beijing, China, 28 August 2012. China Agricultural Science and Technology Press.173.
Singh RP, Hodson DP, Jin Y, Lagudah ES, Ayliffe MA, Bhavani S, Basnet BR (2015) Emergence and spread of new races of wheat stem rust fungus: continued threat to food security and prospects of genetic control. Phytopathology. 105(7): 872-884.
Singh RP, Hodson DP, Jin Y, Lagudah ES, Ayliffe MA, Bhavani S, Rouse MN, Pretorius ZA, Szabo LJ, Huerta-Espino J, Basnet BR (2015) Emergence and spread of new races of wheat stem rust fungus: continued threat to food security and prospects of genetic control. Phytopathology.105(7):872-884.
Stakman EC, Stewart DM, Loegering WQ (1962) Identification of physiologic races of Puccinia graminis f. sp. tritici. Washington: United States Department of Agriculture (USDA), Agricultural Research Service (ARS)
Wilcoxson RD, Skovmand B, Atif AH (1975) Evaluation of wheat cultivars for ability to retard development of stem rust. Annals of Applied Biology. 80(3): 275-281.
Zadoks JC, Chang TT, Konzak CF (1974) A decimal code for the growth stages of cereals. Weed Research. 14(6): 415-42.
Zar JH (2005) Spearman rank correlation, Encyclopedia of biostatistics. John Wiley and Sons, Ltd (Wiley Online Library). 7.
Zhang D, Bowden RL, Yu J, Carver BF, Bai G (2014) Association analysis of stem rust resistance in US winter wheat. PLoS One 9(7) :103747