Australian Journal of Crop Science
Article | https://doi.org/10.21475/ajcs.26.20.10.pne319
Submitted: 09 May 2026 | Revised: 25 July 2026 | Accepted: 06 August 2026
Pages 896–912
Stability and multi-trait selection of durum wheat quality traits across Moroccan environments using BLUP-based WAASBY and MGIDI analyses
Mackaye Moussa Hassane1*, Rachida Hassikou1, Fatima Gaboun2, Sahar Bennani2, Hind El Bouzidi4, Mohamed Amine Abdellaoui3, Ghizlane Diria2, Mona Taghouti2
¹ Mohammed V University, Faculty of Sciences, 4 Avenue Ibn Battouta, B.P. 1014 RP, Rabat, Morocco
² National Institute of Agronomic Research (INRA), Avenue Mohamed Belarbi Alaoui, B.P. 6356, Rabat, Morocco
³ Ibn Tofail University, Faculty of Sciences, University Campus, B.P. 133, Kenitra, Morocco
⁴ Hassan I University, Faculty of Sciences and Techniques, Km 3, Route de Casablanca, B.P. 577, Settat, Morocco
Corresponding author: mackaye.moussa@um5r.ac.ma
ORCID: https://orcid.org/0009-0005-4827-4953
Abstract: Durum wheat grain quality is strongly influenced by genotype × environment interaction (GEI), requiring the identification of genotypes with stable grain quality performance for breeding programs. This study evaluated the performance and stability of 25 durum wheat genotypes across 16 Moroccan environments during the 2020–2021, 2021–2022, and 2022–2023 cropping seasons. Four quality traits were analyzed: gluten strength (GS), yellow index (YI), thousand-kernel weight (TKW), and test weight (TW). A linear mixed model was used to estimate genotype performance using best linear unbiased predictions (BLUPs). Stability was assessed using the weighted average of absolute scores and yield (WAASBY), and multi-trait selection was performed using the multi-trait genotype–ideotype distance index (MGIDI). Environmental effects were highly significant for all traits (P < 0.001), confirming the strong influence of the environment on grain quality. Broad-sense heritability was high for GS (0.93), YI (0.96), and TKW (0.89), and moderate to high for TW (0.76). Trait-specific WAASBY rankings showed that G5 and G17 ranked among the five highest values for three traits, whereas G14, G19, and G22 ranked among the top five for two traits. MGIDI selected G5, G19, G22, G4, and G13 as the genotypes closest to the ideotype based on BLUP-adjusted multi-trait performance. These results show that combining BLUP-based stability analysis with multi-trait selection can support the identification of durum wheat genotypes with favorable profiles for the four measured traits across the tested Moroccan environments.
Keywords: BLUP; durum wheat; genotype × environment interaction; grain quality; MGIDI; multi-trait selection; stability analysis; WAASBY.
Abbreviations: BLUP: Best linear unbiased prediction; GEI: Genotype × environment interaction; GS: Gluten strength; MGIDI: Multi-trait genotype–ideotype distance index; RCBD: Randomized complete block design; SDS: sodium dodecyl sulfate; REML: Restricted maximum likelihood; TKW: Thousand-kernel weight; TW: Test weight; WAASB: Weighted average of absolute scores; WAASBY: Weighted average of absolute scores and yield; YI: Yellow index.
Wheat (Triticum spp.) is one of the most widely cultivated cereal crops worldwide and serves as a staple food for billions of people (Kumar et al., 2019). Among wheat species, durum wheat (Triticum durum Desf.) accounts for nearly 5% of global wheat production, covering about 17.7 million hectares with an estimated production of 39.5 million metric tons (Mazzucotelli et al., 2020; Argyriou, 2023). Wheat contributes nearly 20% of the daily caloric and protein intake for approximately 4.5 billion people, emphasizing its critical importance to global food security (Arzani and Ashraf, 2017). Durum wheat is particularly valued for semolina-based products such as pasta, couscous, and traditional foods, making it economically and nutritionally significant (Sissons, 2008).
In Morocco, durum wheat is cultivated on approximately one million hectares annually and remains an important cereal crop for traditional food systems (Boussakouran et al., 2021; Nsarellah et al., 2022). It is one of the oldest cultivated cereals in the region and remains a fundamental component of local diets (Royo et al., 2009). Grain quality traits such as gluten strength, test weight, yellow index, and thousand-kernel weight play a major role in determining processing efficiency, end-use quality, and consumer acceptance (Sissons, 2008). Previous multi-environment studies on durum wheat have shown that both yield and grain quality traits are strongly affected by genotype, environment, and their interaction, highlighting the importance of identifying genotypes that combine high performance and stability for quality-related traits (Sissons et al., 2020; Magallanes-López et al., 2017). Therefore, integrating quality traits into breeding programs is essential for improving the value of durum wheat across the production chain, from farmers to processors (Guzmán et al., 2022).
Understanding genotype × environment interaction (GEI) is essential for identifying genotypes that combine high performance and stability across diverse environments (Crossa et al., 2006; Piepho et al., 2008; Mackaye et al., 2025).
Climate variability, including irregular rainfall patterns and temperature fluctuations, further increases the need to select stable cultivars capable of maintaining grain quality across environments (IPCC, 2021). In durum wheat production systems, genotype × environment × management interactions are increasingly recognized as essential for designing resilient breeding and agronomic strategies under changing climatic conditions (Beres et al., 2020; Bennani et al., 2017).
For end-users such as millers and processors, consistency in quality traits is crucial to ensure reliable processing performance and product quality (Rharrabti et al., 2003). Multi-environment screening under rainfed and irrigated conditions has been widely used in durum wheat to identify genotypes with broad adaptation to drought and favorable environments (Ayed et al., 2021; Al-Sayaydeh et al., 2023).
Recent advances in mixed-model approaches have improved the analysis of GEI by providing more reliable genotype predictions using best linear unbiased predictions (BLUPs) (Piepho et al., 2008; Smith et al., 2005). Stability indices derived from BLUP values, such as the weighted average of absolute scores and yield (WAASBY), enable the simultaneous evaluation of genotype performance and stability across environments (Olivoto et al., 2019; Machado e Silva et al., 2023). In parallel, multi-trait selection approaches have been developed to improve breeding efficiency by integrating multiple traits into a single selection framework (Olivoto and Nardino, 2021).
The multi-trait genotype–ideotype distance index (MGIDI), introduced by Olivoto and Nardino (2021), provides a robust approach for simultaneous selection based on multiple traits. By accounting for trait correlations and enabling the visualization of strengths and weaknesses, MGIDI facilitates the identification of genotypes that optimize multiple target traits under complex GEI conditions (Olivoto et al., 2022; Farhad et al., 2022). Despite these methodological advances, information on the stability of durum wheat quality traits across Moroccan environments remains limited (Taghouti et al., 2023; Nsarellah et al., 2022). Addressing this gap is essential to support the development of climate-resilient, high-quality wheat varieties across diverse agroecological conditions (FAO, 2022).
A companion study using the same multi-environment field-trial network and genotype panel evaluated grain yield, yield stability, and mega-environment adaptation (Mackaye et al., 2025). The present study reports previously unpublished grain quality data and applies mixed-model BLUPs, trait-specific WAASBY, and MGIDI analyses to gluten strength, yellow index, thousand-kernel weight, and test weight.
This study hypothesized that the evaluated durum wheat genotypes would differ in grain-quality performance and stability across Moroccan environments. We further hypothesized that genotype × environment interaction would affect the four traits differentially and that BLUP-based WAASBY and MGIDI analyses would identify genotypes combining favorable performance, stability, and balanced multi-trait profiles.
Therefore, this study aimed to evaluate the performance, stability, and multi-trait selection of durum wheat genotypes across Moroccan environments using the WAASBY and MGIDI indices.
All genotype comparisons, stability analyses, and rankings presented in this study were based on BLUP estimates derived from the mixed model, allowing for proper accounting of environmental effects and genotype × environment interactions.
Of the 21 possible location–year combinations, 16 were retained for analysis. The retained dataset included seven environments in 2020–2021, five in 2021–2022, and four in 2022–2023. The five excluded environmental combinations were removed prior to analysis due to trial failure, unsuccessful establishment, or incomplete grain quality datasets.
The final analytical dataset was complete after excluding the five non-retained environments, comprising 25 genotypes × 3 replications × 16 environments, resulting in 1200 observations per trait.
Substantial variability was observed among genotypes and environments for all evaluated traits across the 16 Moroccan environments.
For example, GS values ranged from approximately 7.16 to 12.00 mL, whereas TKW varied from about 28.89 to 36.12 g across genotypes, highlighting the extent of phenotypic variation.
The mean performance of the 25 genotypes is presented in Table 3. These values are provided for descriptive purposes only, as genotype ranking and selection were based exclusively on BLUP estimates.
Table 3. Mean performance of 25 durum wheat genotypes for GS, YI, TKW, and TW across 16 environments.
| Genotypes | GS (mL) | YI | TKW (g) | TW (kg hL⁻¹) |
|---|---|---|---|---|
| G1 | 10.27 | 16.31 | 30.90 | 74.17 |
| G2 | 7.16 | 14.14 | 30.69 | 73.20 |
| G3 | 9.28 | 14.88 | 32.65 | 73.46 |
| G4 | 9.78 | 16.34 | 35.04 | 74.77 |
| G5 | 10.18 | 15.42 | 33.73 | 75.52 |
| G6 | 7.49 | 14.18 | 31.17 | 73.73 |
| G7 | 7.61 | 15.80 | 31.97 | 72.43 |
| G8 | 9.94 | 15.45 | 31.34 | 74.16 |
| G9 | 10.41 | 16.79 | 29.06 | 72.43 |
| G10 | 7.70 | 14.12 | 32.15 | 74.89 |
| G11 | 9.99 | 16.88 | 29.13 | 73.17 |
| G12 | 8.36 | 14.87 | 36.12 | 74.16 |
| G13 | 10.40 | 15.56 | 30.61 | 74.76 |
| G14 | 8.03 | 15.35 | 33.58 | 73.62 |
| G15 | 10.41 | 16.37 | 31.11 | 72.91 |
| G16 | 10.86 | 16.50 | 28.89 | 73.96 |
| G17 | 10.80 | 15.79 | 30.64 | 74.26 |
| G18 | 9.65 | 14.57 | 29.09 | 72.16 |
| G19 | 12.00 | 14.48 | 34.70 | 74.36 |
| G20 | 7.76 | 15.83 | 35.68 | 72.04 |
| G21 | 10.21 | 15.01 | 31.25 | 72.34 |
| G22 | 11.30 | 15.38 | 31.81 | 74.74 |
| G23 | 9.77 | 16.33 | 33.27 | 73.08 |
| G24 | 10.14 | 14.56 | 30.39 | 72.91 |
| G25 | 8.84 | 16.95 | 29.96 | 73.63 |
Environmental effects were clearly differentiated (Table 4). The highest trait values varied among traits, with E12 showing the highest GS, E2 the highest YI, and E3 the highest TKW and TW, whereas E16 showed the lowest TKW and TW.
These differences reflect the strong influence of environmental conditions on durum wheat grain quality, as confirmed by the mixed-model analysis. Seasonal variability was also evident, with the 2020–2021 growing season generally associated with higher trait values compared with the 2022–2023 season. The mean values are provided for descriptive purposes only and were not used for genotype ranking or selection (Table 4).
Table 4. Mean performance of 16 environments for the GS, YI, TKW, and TW.
| Environment | Code | Year | GS (mL) | YI | TKW (g) | TW (kg hL⁻¹) |
|---|---|---|---|---|---|---|
| Marchouch | E1 | 2020–2021 | 9.25 | 15.40 | 35.85 | 80.55 |
| Jemâa Shaïm | E2 | 2020–2021 | 11.91 | 17.93 | 28.81 | 73.41 |
| Tassaout | E3 | 2020–2021 | 9.07 | 14.12 | 50.81 | 82.32 |
| Sidi Allal Tazi | E4 | 2020–2021 | 8.97 | 15.75 | 30.22 | 70.80 |
| Douyet | E5 | 2020–2021 | 7.98 | 15.43 | 42.86 | 79.69 |
| Sidi El Aydi | E6 | 2020–2021 | 12.71 | 16.01 | 28.83 | 77.23 |
| Annoceur | E7 | 2020–2021 | 8.11 | 16.87 | 36.69 | 77.73 |
| Sidi Allal Tazi | E8 | 2021–2022 | 8.28 | 15.00 | 32.33 | 72.07 |
| Douyet | E9 | 2021–2022 | 9.09 | 17.11 | 29.52 | 74.50 |
| Sidi El Aydi | E10 | 2021–2022 | 10.27 | 15.96 | 27.25 | 73.30 |
| Annoceur | E11 | 2021–2022 | 7.50 | 16.80 | 36.27 | 78.85 |
| Marchouch | E12 | 2021–2022 | 14.73 | 15.53 | 27.98 | 72.78 |
| Sidi El Aydi | E13 | 2022–2023 | 7.90 | 14.51 | 27.12 | 68.25 |
| Sidi Allal Tazi | E14 | 2022–2023 | 7.10 | 13.38 | 31.72 | 68.87 |
| Marchouch | E15 | 2022–2023 | 10.68 | 14.94 | 21.80 | 66.31 |
| Douyet | E16 | 2022–2023 | 8.99 | 13.50 | 20.70 | 61.50 |
Mixed-model analysis revealed a highly significant fixed environmental effect for all four traits (P < 0.001; Table 5). The F-values were 28.54 for GS, 28.81 for YI, 65.23 for TKW, and 144.90 for TW, indicating a strong influence of the environment on the expression of grain quality traits. Likelihood-ratio tests also showed highly significant genotype and genotype × environment interaction effects for all traits (P < 0.001; Table 6), demonstrating substantial genetic variability and differential genotype responses across environments.
Table 5. Significance of the fixed environmental effect for four durum wheat grain-quality traits based on the linear mixed model.
| Trait | Numerator df | Denominator df | F-value | P-value |
|---|---|---|---|---|
| GS | 15 | 56.68 | 28.54 | <0.001 |
| YI | 15 | 44.03 | 28.81 | <0.001 |
| TKW | 15 | 38.87 | 65.23 | <0.001 |
| TW | 15 | 57.97 | 144.90 | <0.001 |
Note: Denominator degrees of freedom were approximated using the Satterthwaite method.
The likelihood-ratio statistics for the genotype effect ranged from 35.13 for TW to 260.13 for YI, whereas those for the genotype × environment interaction ranged from 12.34 for TKW to 67.97 for GS, with all associated probability values below 0.001 (Table 6). Broad-sense heritability was high for GS (0.93), YI (0.96), and TKW (0.89), but comparatively lower for TW (0.76), indicating that genotypic differences were more consistently expressed for GS, YI, and TKW than for TW.
Table 6. Variance components, profile-likelihood confidence intervals, likelihood-ratio tests, and broad-sense heritability for four durum wheat grain-quality traits evaluated across 16 environments.
| Trait | σ²G (95% CI) | σ²GE (95% CI) | σ²R(E) (95% CI) | σ²e (95% CI) | LRTG | PG | LRTGE | PGE | H² |
|---|---|---|---|---|---|---|---|---|---|
| GS | 1.607 (0.883–2.940) | 0.998 (0.685–1.251) | 0.224 (0.061–0.281) | 2.679 (2.440–2.985) | 176.18 | <0.001 | 67.97 | <0.001 | 0.931 |
| YI | 0.761 (0.426–1.375) | 0.223 (0.129–0.303) | 0.103 (0.030–0.121) | 1.010 (0.920–1.126) | 260.13 | <0.001 | 29.99 | <0.001 | 0.956 |
| TKW | 3.878 (2.059–7.264) | 2.174 (0.846–3.284) | 1.695 (0.472–1.904) | 16.238 (14.806–18.117) | 107.15 | <0.001 | 12.34 | <0.001 | 0.891 |
| TW | 0.688 (0.310–1.399) | 1.583 (0.952–2.033) | 0.238 (0.003–0.320) | 5.913 (5.402–6.613) | 35.13 | <0.001 | 38.69 | <0.001 | 0.756 |
Note: σ²G, σ²GE, σ²R(E), and σ²e denote the variance components associated with genotype, genotype × environment interaction, replication nested within environment, and residual error, respectively. Values in parentheses are 95% profile-likelihood confidence intervals. LRTG and LRTGE are the likelihood-ratio statistics obtained by comparing the full model with reduced models excluding the genotype and genotype × environment interaction random effects, respectively. H² denotes broad-sense heritability calculated from unrounded REML estimates.
BLUP-predicted genotypic values differed among traits (Table 7). G19, G22, and G16 showed the highest predicted values for GS; G25, G11, and G9 for YI; G12, G20, and G4 for TKW; and G5, G10, and G4 for TW. These trait-specific rankings indicate that no single genotype was superior across all four traits.
Table 7. BLUP-predicted values and ranking of durum wheat genotypes for grain quality traits.
| GEN | GS (mL) | Rank | YI | Rank | TKW (g) | Rank | TW (kg hL⁻¹) | Rank |
|---|---|---|---|---|---|---|---|---|
| G1 | 10.22 | 8 | 16.28 | 8 | 31.01 | 16 | 74.04 | 8 |
| G2 | 7.33 | 25 | 14.20 | 24 | 30.82 | 17 | 73.31 | 16 |
| G3 | 9.30 | 17 | 14.92 | 18 | 32.56 | 8 | 73.51 | 15 |
| G4 | 9.77 | 14 | 16.31 | 6 | 34.69 | 3 | 74.50 | 3 |
| G5 | 10.14 | 10 | 15.43 | 14 | 33.53 | 5 | 75.07 | 1 |
| G6 | 7.63 | 24 | 14.25 | 23 | 31.25 | 14 | 73.71 | 12 |
| G7 | 7.75 | 23 | 15.79 | 10 | 31.95 | 10 | 72.73 | 22 |
| G8 | 9.92 | 13 | 15.46 | 13 | 31.40 | 12 | 74.03 | 10 |
| G9 | 10.35 | 5 | 16.74 | 3 | 29.36 | 24 | 72.73 | 21 |
| G10 | 7.83 | 22 | 14.19 | 25 | 32.12 | 9 | 74.59 | 2 |
| G11 | 9.96 | 12 | 16.82 | 2 | 29.42 | 22 | 73.29 | 17 |
| G12 | 8.45 | 19 | 14.91 | 19 | 35.65 | 1 | 74.03 | 9 |
| G13 | 10.35 | 7 | 15.56 | 12 | 30.75 | 19 | 74.49 | 4 |
| G14 | 8.13 | 20 | 15.36 | 16 | 33.39 | 6 | 73.63 | 14 |
| G15 | 10.35 | 5 | 16.33 | 5 | 31.19 | 15 | 73.09 | 20 |
| G16 | 10.77 | 3 | 16.46 | 4 | 29.21 | 25 | 73.89 | 11 |
| G17 | 10.72 | 4 | 15.78 | 11 | 30.77 | 18 | 74.11 | 7 |
| G18 | 9.65 | 16 | 14.62 | 20 | 29.39 | 23 | 72.53 | 24 |
| G19 | 11.84 | 1 | 14.53 | 22 | 34.39 | 4 | 74.18 | 6 |
| G20 | 7.88 | 21 | 15.82 | 9 | 35.26 | 2 | 72.44 | 25 |
| G21 | 10.17 | 9 | 15.03 | 17 | 31.31 | 13 | 72.66 | 23 |
| G22 | 11.19 | 2 | 15.39 | 15 | 31.81 | 11 | 74.47 | 5 |
| G23 | 9.76 | 15 | 16.30 | 7 | 33.11 | 7 | 73.22 | 18 |
| G24 | 10.10 | 11 | 14.61 | 21 | 30.55 | 20 | 73.09 | 19 |
| G25 | 8.89 | 18 | 16.89 | 1 | 30.17 | 21 | 73.63 | 13 |
Note: GS, gluten strength; YI, yellow index represented by the CIELAB b* coordinate; TKW, thousand-kernel weight; TW, test weight. Values are BLUP-predicted genotypic values. Rankings were calculated from unrounded BLUP-predicted values; displayed values were rounded to two decimal places.
WAASBY was calculated separately for each trait to combine BLUP-predicted performance and stability across the 16 environments. Higher WAASBY values indicated a more favorable combination of performance and stability.
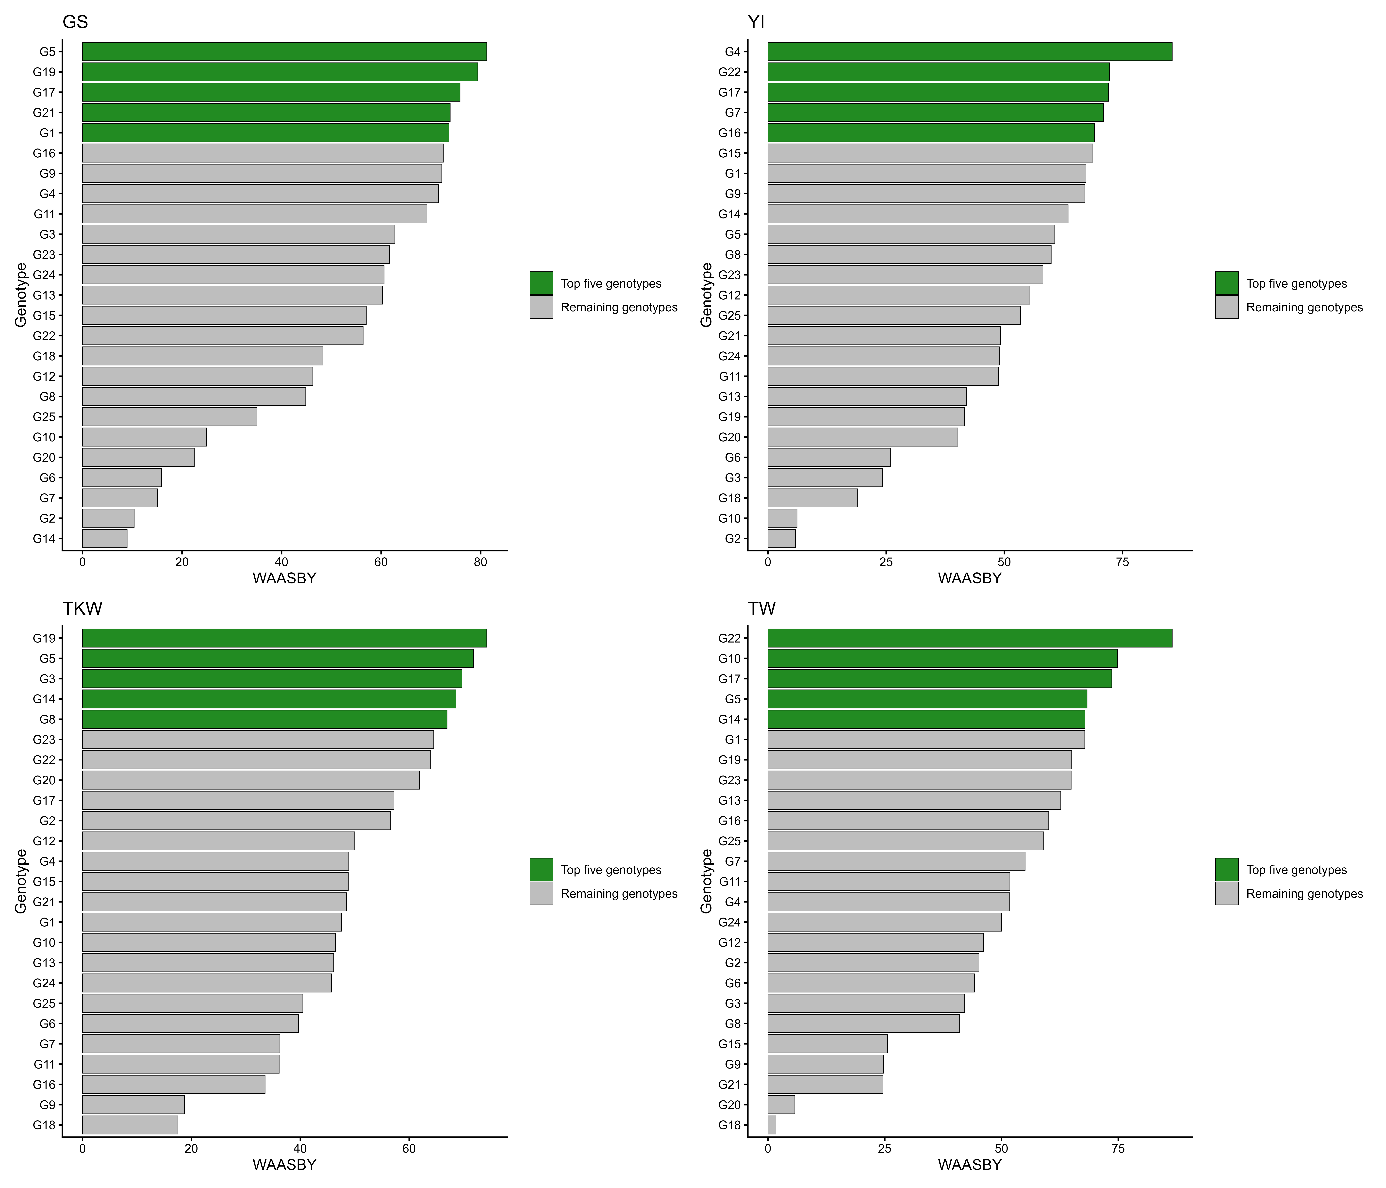
Trait-specific rankings differed among the four traits (Table 8; Fig. 1). The five highest-ranking genotypes were G5, G19, G17, G21, and G1 for GS; G4, G22, G17, G7, and G16 for YI; G19, G5, G3, G14, and G8 for TKW; and G22, G10, G17, G5, and G14 for TW. G5 and G17 ranked among the top five for three traits, whereas G14, G19, and G22 ranked among the top five for two traits. No genotype ranked among the top five for all four traits.
These findings indicate that genotype performance–stability profiles were trait-dependent, suggesting that WAASBY should be interpreted separately for each trait rather than as a single multi-trait selection criterion.
Table 8. WAASBY values and ranking of durum wheat genotypes for grain quality traits.
| GEN | WAASBY-GS | Rank | WAASBY-YI | Rank | WAASBY-TKW | Rank | WAASBY-TW | Rank |
|---|---|---|---|---|---|---|---|---|
| G1 | 72.80 | 5 | 67.31 | 7 | 47.57 | 15 | 67.81 | 6 |
| G2 | 10.32 | 24 | 5.82 | 25 | 56.57 | 10 | 45.19 | 17 |
| G3 | 62.72 | 10 | 24.18 | 22 | 69.62 | 3 | 42.11 | 19 |
| G4 | 71.43 | 8 | 85.48 | 1 | 48.73 | 12 | 51.76 | 14 |
| G5 | 81.23 | 1 | 60.68 | 10 | 71.78 | 2 | 68.41 | 4 |
| G6 | 15.79 | 22 | 25.86 | 21 | 39.47 | 20 | 44.19 | 18 |
| G7 | 15.07 | 23 | 70.91 | 4 | 36.06 | 22 | 55.28 | 12 |
| G8 | 44.95 | 18 | 59.89 | 11 | 66.95 | 5 | 40.96 | 20 |
| G9 | 72.13 | 7 | 67.11 | 8 | 18.57 | 24 | 24.76 | 22 |
| G10 | 24.89 | 20 | 6.16 | 24 | 46.27 | 16 | 74.88 | 2 |
| G11 | 69.23 | 9 | 48.75 | 17 | 36.13 | 21 | 51.84 | 13 |
| G12 | 46.12 | 17 | 55.39 | 13 | 50.00 | 11 | 46.16 | 16 |
| G13 | 60.29 | 13 | 41.93 | 18 | 46.14 | 17 | 62.66 | 9 |
| G14 | 8.96 | 25 | 63.43 | 9 | 68.50 | 4 | 67.86 | 5 |
| G15 | 57.12 | 14 | 68.79 | 6 | 48.68 | 13 | 25.61 | 21 |
| G16 | 72.40 | 6 | 69.03 | 5 | 33.43 | 23 | 60.20 | 10 |
| G17 | 75.77 | 3 | 71.95 | 3 | 57.16 | 9 | 73.66 | 3 |
| G18 | 48.35 | 16 | 18.95 | 23 | 17.40 | 25 | 1.70 | 25 |
| G19 | 79.36 | 2 | 41.58 | 19 | 74.25 | 1 | 65.00 | 7 |
| G20 | 22.50 | 21 | 40.10 | 20 | 61.79 | 8 | 5.73 | 24 |
| G21 | 73.85 | 4 | 49.21 | 15 | 48.42 | 14 | 24.61 | 23 |
| G22 | 56.39 | 15 | 72.24 | 2 | 63.87 | 7 | 86.55 | 1 |
| G23 | 61.80 | 11 | 58.15 | 12 | 64.50 | 6 | 64.91 | 8 |
| G24 | 60.80 | 12 | 48.77 | 16 | 45.77 | 18 | 49.90 | 15 |
| G25 | 34.95 | 19 | 53.47 | 14 | 40.34 | 19 | 59.07 | 11 |
Note: GS, gluten strength; YI, yellow index represented by the CIELAB b* coordinate; TKW, thousand-kernel weight; TW, test weight. WAASBY is a unitless index combining BLUP-predicted performance and stability with equal weights of 50%. Higher values indicate a more favorable performance–stability combination.
Fig. 1. WAASBY values for 25 durum wheat genotypes evaluated for gluten strength (GS), yellow index (YI), thousand-kernel weight (TKW), and test weight (TW). Higher WAASBY values indicate a more favorable combination of BLUP-predicted trait performance and stability across environments. Green bars indicate the five highest-ranking genotypes for each trait, whereas grey bars indicate the remaining genotypes.
At a 20% selection intensity, MGIDI selected G5, G19, G22, G4, and G13 as the genotypes closest to the ideotype (Table 9; Fig. 2).
Genotypes G5 and G19 ranked first and second, respectively, followed by G22, G4, and G13, indicating superior multi-trait performance. In contrast, genotypes such as G2, G7, and G20 exhibited the highest MGIDI values, reflecting a greater distance from the ideotype and lower overall performance.
The five selected genotypes occupied the lowest MGIDI range and were located within the selection threshold shown in Fig. 2. The red circle shown in Fig. 2 represents the selection threshold corresponding to the 20% selection intensity.
A partial agreement was observed between the WAASBY and MGIDI results. In particular, genotypes G5, G19, and G22 were identified by both analytical approaches. However, differences between the two methods reflect their complementary nature, as WAASBY evaluates performance–stability relationships at the individual trait level, whereas MGIDI emphasizes overall multi-trait performance.
Table 9. MGIDI values, rankings, and selection status of 25 durum wheat genotypes based on four BLUP-predicted grain-quality traits.
| GEN | MGIDI | Rank | Selected |
|---|---|---|---|
| G5 | 1.37 | 1 | Yes |
| G19 | 1.45 | 2 | Yes |
| G22 | 1.46 | 3 | Yes |
| G4 | 1.67 | 4 | Yes |
| G13 | 1.93 | 5 | Yes |
| G17 | 2.17 | 6 | No |
| G1 | 2.37 | 7 | No |
| G8 | 2.45 | 8 | No |
| G16 | 2.81 | 9 | No |
| G23 | 2.99 | 10 | No |
| G3 | 3.18 | 11 | No |
| G12 | 3.21 | 12 | No |
| G15 | 3.24 | 13 | No |
| G10 | 3.31 | 14 | No |
| G25 | 3.40 | 15 | No |
| G24 | 3.45 | 16 | No |
| G14 | 3.49 | 17 | No |
| G11 | 3.58 | 18 | No |
| G21 | 3.70 | 19 | No |
| G9 | 4.04 | 20 | No |
| G6 | 4.05 | 21 | No |
| G18 | 4.34 | 22 | No |
| G20 | 4.40 | 23 | No |
| G7 | 4.49 | 24 | No |
| G2 | 4.56 | 25 | No |
Note: Lower MGIDI values indicate greater proximity to the ideotype. Five genotypes were selected at a 20% selection intensity.
Factor retention followed the Kaiser criterion (eigenvalues > 1), resulting in the selection of two factors (FA1 and FA2), which together explained 69.4% of the total variance (Table 10).
Table 10. Eigenvalues and variance explained by the factors retained for MGIDI analysis.
| Factor | Eigenvalue | Variance explained (%) | Cumulative variance (%) |
|---|---|---|---|
| FA1 | 1.51 | 37.7 | 37.7 |
| FA2 | 1.27 | 31.7 | 69.4 |
The correlation matrix of BLUP-predicted trait values, genotype factor scores, and relative factor contributions to MGIDI are provided in Supplementary Tables S3, S4, and S5, respectively.
FA1 was primarily associated with GS and YI, with a moderate negative loading for TKW, indicating contrasting contributions of GS and YI versus TKW within FA1. In contrast, FA2 was strongly associated with TW, reflecting grain density (Table 11).
This factor structure indicates that quality-related traits (GS and YI) and grain physical traits (TKW and TW) contributed differently to genotype discrimination. The relatively high communalities for GS, TW, and TKW indicate that these traits were well represented by the retained factors, whereas YI showed a moderate communality.
Table 11. Factor structure and trait loadings used in MGIDI analysis.
| Trait | FA1 | FA2 | Communality | Uniqueness |
|---|---|---|---|---|
| GS | 0.77 | −0.44 | 0.78 | 0.22 |
| YI | 0.74 | 0.12 | 0.56 | 0.44 |
| TKW | −0.60 | −0.50 | 0.62 | 0.38 |
| TW | 0.01 | −0.91 | 0.82 | 0.18 |
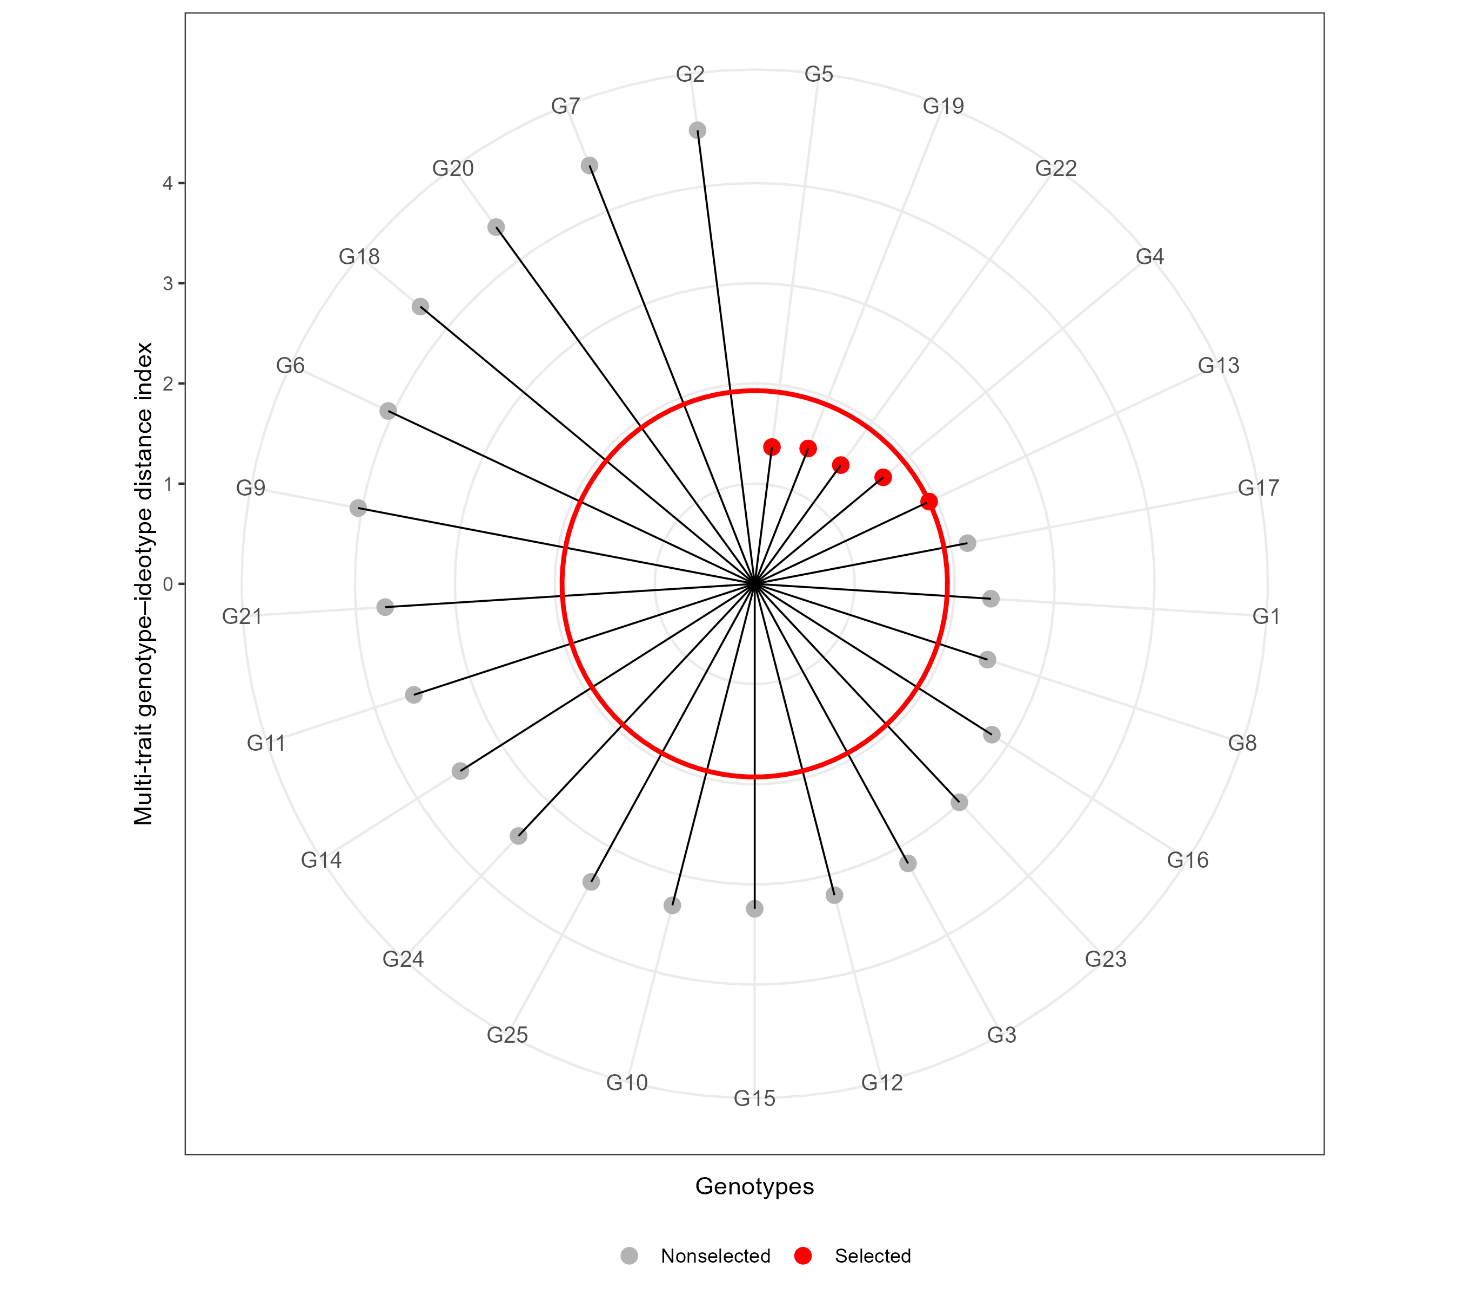
Fig. 2. Multi-trait genotype–ideotype distance index (MGIDI) for 25 durum wheat genotypes based on BLUP-predicted values of gluten strength, yellow index, thousand-kernel weight, and test weight. Lower MGIDI values indicate greater proximity to the defined ideotype. Red points represent the five genotypes selected at a 20% selection intensity (G5, G19, G22, G4, and G13), whereas grey points represent non-selected genotypes.
Selection differentials were positive for GS, TKW, and TW, reaching 11.73%, 3.87%, and 1.23%, respectively. YI showed a slight negative differential of −0.49%, illustrating a minor trade-off in simultaneous multi-trait selection (Table 12).
These results highlight the trade-offs inherent in multi-trait selection, as simultaneous improvement of all traits may not always be achievable. The observed selection differentials were positive for GS, TKW, and TW, whereas YI showed a slight negative differential.
Table 12. Selection differentials for the five genotypes selected using MGIDI.
| Trait | Overall mean | Selected mean | Selection differential | Selection differential (%) |
|---|---|---|---|---|
| GS | 9.54 | 10.66 | 1.12 | 11.73 |
| YI | 15.52 | 15.44 | −0.08 | −0.49 |
| TKW | 31.80 | 33.03 | 1.23 | 3.87 |
| TW | 73.64 | 74.54 | 0.90 | 1.23 |
The evaluation of 25 durum wheat genotypes across 16 Moroccan environments revealed substantial variability for all studied quality traits (GS, YI, TW, and TKW), reflecting both underlying genetic diversity and differential genotype responses under contrasting agro-climatic conditions. The highly significant environmental effects identified by the mixed-model ANOVA confirm the major contribution of environmental conditions to the expression of durum wheat grain quality traits.
This strong environmental influence is consistent with previous studies, particularly for traits such as test weight and thousand-kernel weight, which are highly sensitive to temperature and water availability during the grain-filling period (Magallanes-López et al., 2017; Al-Sayaydeh et al., 2023; Tahir et al., 2023). Similar patterns have been reported in multi-environment trials conducted under both rainfed and irrigated conditions, where environmental variability was the dominant source of variation in durum wheat performance (Ayed et al., 2021). Under Mediterranean conditions, the high interannual variability in both grain yield and quality further emphasizes the importance of stable quality traits for end users (Rharrabti et al., 2003).
The presence of substantial genotype × environment interaction highlights the complexity of selecting superior genotypes under variable environmental conditions. In addition, the interaction among genotype, environment, and management practices plays a critical role in determining crop performance and stability under changing climatic conditions (Beres et al., 2020). In this context, the use of mixed-model approaches combined with BLUP estimates provides a more accurate framework for genotype evaluation by accounting for environmental heterogeneity and interaction effects (Piepho et al., 2008; Smith et al., 2005; Cullis et al., 2006). These findings are consistent with previous studies in durum wheat, where genotype, environment, and their interaction significantly influenced both grain yield and quality traits, emphasizing the need for stability-based selection approaches (Sissons et al., 2020). GS and YI showed high broad-sense heritability on a genotype-mean basis, indicating that genotypic differences for these traits were estimated with relatively high precision after averaging across environments and replications. TKW also showed high heritability, whereas TW had a comparatively lower value, reflecting a stronger contribution of genotype × environment interaction and residual variation. These findings are consistent with previous studies reporting higher heritability for quality-related traits than for yield-related traits in durum wheat, reflecting their relatively stronger genetic control (Taneva et al., 2019). The lower stability of TW and TKW across environments further reflects their dependence on environmental conditions, particularly temperature and water availability during grain development (Magallanes-López et al., 2017).
The highest TKW and TW values were observed at Tassaout in 2020–2021. This environment was managed under full gravity irrigation, which provided favorable water availability during grain filling. Conversely, the low TKW and TW values recorded at Marchouch and Douyet in 2022–2023 indicate less favorable grain-filling conditions. These contrasting responses likely reflect the combined effects of water availability, temperature, crop management, and genotype performance rather than a single environmental factor.
WAASBY rankings were trait-specific. G5 and G17 ranked among the top five for three traits, whereas G14, G19, and G22 ranked among the top five for two traits. This pattern confirms that no genotype combined the most favorable performance–stability profile for all four traits. G17 ranked among the five highest-performing genotypes for GS, YI, and TW but was not selected by MGIDI. This difference reflects the complementary objectives of the two approaches: WAASBY evaluates performance and stability separately for each trait, whereas MGIDI integrates the BLUP-predicted values of all four traits without explicitly assessing stability.
The MGIDI index further refined genotype selection by integrating multiple traits into a single selection criterion. Recent advances in multi-trait and multi-environment approaches have also emphasized the importance of considering trait correlations and environmental variability to improve selection efficiency in durum wheat (Puglisi et al., 2026). Based on this approach, G5, G19, G22, G4, and G13 were identified as the closest genotypes to the ideotype, reflecting a favorable balance across GS, YI, TW, and TKW. This highlights the advantage of MGIDI in capturing overall genotype performance across multiple traits by accounting for trait correlations and reducing dimensionality, thereby improving the efficiency of multi-trait selection. The selection of G4 and G13 by MGIDI reflects their relatively balanced BLUP-based performance across the evaluated traits rather than superiority for a single trait. This result highlights the ability of MGIDI to identify genotypes with a well-balanced multi-trait profile, even when they are not consistently top-ranked by single-trait WAASBY.
It is important to note that MGIDI was computed using BLUP-based predictions, focusing on multi-trait performance rather than explicit stability. In contrast, WAASBY integrates both performance and stability, explaining the partial differences observed between the two selection approaches. G5, G19, and G22 were identified by both analytical approaches, indicating promising combined profiles for the four measured traits across the tested environments. In contrast, G4 and G13 were selected by MGIDI because of their comparatively balanced multi-trait profiles rather than consistent superiority in individual WAASBY rankings. From a breeding perspective, the identification of genotypes G5, G19, and G22 using both WAASBY and MGIDI highlights their potential as promising candidates for further evaluation based on the four measured traits. These genotypes combined favorable performance–stability profiles for several individual traits with relatively balanced BLUP-predicted performance across gluten strength, yellow index, thousand-kernel weight, and test weight. However, their overall technological and end-use quality cannot be inferred without evaluating additional traits such as grain protein content, vitreousness, semolina yield, and pasta-making quality.
These results highlight the importance of integrating multi-trait selection approaches in breeding programs to capture complex trait interactions and improve overall performance (Olivoto and Nardino, 2021). The combined use of mixed-model analysis, trait-specific WAASBY assessment, and MGIDI selection provided complementary information on genotype performance, stability, and multi-trait profiles. While WAASBY emphasizes performance–stability relationships at the individual trait level, MGIDI integrates multiple traits simultaneously, enabling the identification of genotypes with balanced overall multi-trait performance across environments.
The present study shares its experimental field-trial network with a previously published companion study focused on grain yield and mega-environment adaptation (Mackaye et al., 2025). Nevertheless, the response variables, analytical objectives, and conclusions of the two studies are distinct, and the grain-quality data reported here were not included in the earlier publication.
Despite these findings, some limitations should be acknowledged. First, the initially planned 21-environment network was incomplete because five location–year combinations were excluded owing to trial failure, unsuccessful establishment, or incomplete grain-quality datasets. Although the retained 16-environment analytical dataset was balanced and complete, the exclusion of some trials affected by severe stress may have resulted in underrepresentation of the most extreme environmental conditions. Consequently, the stability identified in this study applies specifically to the successfully established and sampled environments and should not be interpreted as evidence of stability under crop-failure or extreme-drought conditions. Second, only four grain-quality traits were considered, whereas additional technological traits could provide a more comprehensive assessment of durum wheat quality. Third, the selected genotypes should be validated in independent multi-environment trials before cultivar recommendations. Finally, the physiological mechanisms underlying genotype stability were not investigated. The four traits were first analysed separately using univariate mixed models, and MGIDI was subsequently applied to the resulting BLUP-predicted genotypic values. Therefore, genetic and residual correlations among traits were not modelled jointly, as they would be in a fully multivariate mixed-model analysis. Additional multi-environment trials specifically designed to obtain reliable grain-quality measurements under severe water stress are needed to validate the selected genotypes under more extreme climatic conditions.
A total of 25 durum wheat (Triticum durum Desf.) genotypes were evaluated in this study (Table 1), including 23 Moroccan and introduced released cultivars and two advanced breeding lines. These genotypes originated mainly from the Moroccan breeding program, with additional introductions from European sources, representing a broad range of genetic diversity.
Only genotypes consistently evaluated across the three cropping seasons and retained environments were considered, ensuring comparability and reliability of performance and stability estimates.
The genotype panel was classified into Moroccan old cultivars, Moroccan modern cultivars, Moroccan recent cultivars, European introduced cultivars, and advanced breeding lines. This classification provides a structured representation of genetic diversity within the panel.
Because complete pedigree, maturity-group, and official quality-class information was not available for all genotypes, diversity was characterized using these available descriptors.
Table 1. Description and classification of the 25 durum wheat genotypes evaluated in this study.
| Genotype | Code | Origin | Status | Year of release | Group |
|---|---|---|---|---|---|
| Amjad | G1 | Morocco | Released cultivar | 1995 | Moroccan (old) |
| Amria | G2 | Morocco | Released cultivar | 2003 | Moroccan (modern) |
| Annouar | G3 | Morocco | Released cultivar | 1993 | Moroccan (old) |
| Boniduro | G4 | Spain | Introduced cultivar | 2012 | European |
| Carioca | G5 | France | Introduced cultivar | 2005 | European |
| Chaoui | G6 | Morocco | Released cultivar | 2003 | Moroccan (modern) |
| Faraj | G7 | Morocco | Released cultivar | 2007 | Moroccan (modern) |
| Ginseng | G8 | France | Introduced cultivar | 2009 | European |
| Irden | G9 | Morocco | Released cultivar | 2003 | Moroccan (modern) |
| Itri | G10 | Morocco | Released cultivar | 2016 | Moroccan (recent) |
| Hamadi | G11 | Morocco | Released cultivar | 2017 | Moroccan (recent) |
| Jabal | G12 | Morocco | Released cultivar | 2021 | Moroccan (recent) |
| Karim | G13 | Morocco | Released cultivar | 1985 | Moroccan (old) |
| Kanakis | G14 | France | Introduced cultivar | 2009 | European |
| Louisa | G15 | Morocco | Released cultivar | 2011 | Moroccan (modern) |
| LP4 | G16 | Morocco | Advanced line | — | Breeding line |
| LP5 | G17 | Morocco | Advanced line | — | Breeding line |
| Marouan | G18 | Morocco | Released cultivar | 2003 | Moroccan (modern) |
| Marzak | G19 | Morocco | Released cultivar | 1984 | Moroccan (old) |
| Nachit | G20 | Morocco | Released cultivar | 2018 | Moroccan (recent) |
| Nassira | G21 | Morocco | Released cultivar | 2003 | Moroccan (modern) |
| Ourgh | G22 | Morocco | Released cultivar | 1995 | Moroccan (old) |
| Prospero | G23 | France | Introduced cultivar | 2007 | European |
| Tarek | G24 | Morocco | Released cultivar | 1995 | Moroccan (old) |
| Tomouh | G25 | Morocco | Released cultivar | 1997 | Moroccan (old) |
Note: Genotype groups were defined according to available descriptors, including origin, release period, and breeding status. Complete pedigree, maturity-group, and official quality-class information was not available for all entries.
The experiments were conducted across the main durum wheat–growing agroecosystems of Morocco over three consecutive cropping seasons (2020–2021, 2021–2022, and 2022–2023). Seven locations were initially included in the first season, representing contrasting agroecological conditions across the country. Detailed information on location, altitude, soil type, agroecological zone, and rainfall is provided in Table S1.
Across the three seasons, this design resulted in 21 potential location–year combinations, each considered as a distinct testing unit. Of these, 16 environments were retained for analysis, including seven in 2020–2021, five in 2021–2022, and four in 2022–2023.
The remaining five environments were excluded prior to analysis due to trial failure, non-establishment, or incomplete quality datasets. In particular, severe drought affected some rainfed environments, while site availability and logistical constraints limited successful trial establishment in some locations. A detailed description of retained and excluded environments is provided in Table 2.
Table 2. Distribution of experimental environments across cropping seasons and reasons for exclusion.
| Location | Code | 2020–2021 | 2021–2022 | 2022–2023 | Status | Reason for exclusion |
|---|---|---|---|---|---|---|
| Marchouch | MCH | E1 | E12 | E15 | Included | — |
| Sidi El Aydi | SEA | E6 | E10 | E13 | Included | — |
| Douyet | DYT | E5 | E9 | E16 | Included | — |
| Sidi Allal Tazi | SAT | E4 | E8 | E14 | Included | — |
| Annoceur | ANN | E7 | E11 | Not established | Partial | Incomplete dataset due to site constraints |
| Jemâa Shaïm | JSH | E2 | Not established | Not established | Partial | Severe drought causing trial failure |
| Tassaout | TST | E3 | Not established | Not established | Partial | Trial not established due to site constraints |
The field trials used in the present study were part of the same multi-environment trial network previously used to investigate grain yield performance, yield stability, and mega-environment adaptation (Mackaye et al., 2025). The grain-quality traits analysed in the current study were measured on grain samples obtained from these trials. None of the GS, YI, TKW, or TW results, nor the associated BLUP, WAASBY, and MGIDI analyses, tables, figures, and conclusions, was reported in the previous publication.
Field experiments were conducted using a randomized complete block design (RCBD) with three replications in each environment. Each experimental plot measured 6 m² and consisted of rows 5 m in length with 0.20 m spacing between rows. Seeds were sown at a density of 300 seeds m⁻² to ensure uniform plant establishment.
All genotypes were evaluated under identical management conditions within each environment, allowing reliable comparison of genotype performance. This experimental design enabled the assessment of genotype, environment, and genotype × environment interaction effects across multiple environments.
Field trials were conducted across seven INRA experimental stations. Soil preparation consisted of moldboard ploughing to approximately 25 cm followed by secondary tillage before sowing. Crop management details are provided in Supplementary Table S2.
Soils were fertilized at sowing using nitrogen (N), phosphorus (P₂O₅), and potassium (K₂O) based on soil-test recommendations, with additional nitrogen supplied through one or two ammonium nitrate applications during tillering and/or stem elongation.
Irrigation management depended on the agroecological zone, with rainfed environments relying on seasonal rainfall and irrigated environments receiving supplementary or full irrigation. Weed control combined post-emergence herbicide application and manual weeding.
All genotypes within each environment received identical management.
At physiological maturity, plots were harvested from all environments and seasons. Grain samples were collected from a net harvest area of 4 m² after excluding border rows to reduce edge effects. The samples were transported to the Genetic Improvement and Wheat Quality Laboratory at the National Institute of Agronomic Research (INRA), Rabat, Morocco, for quality analyses.
Four grain quality traits were evaluated: gluten strength (GS), yellow index (YI), thousand-kernel weight (TKW), and test weight (TW). All measurements were conducted on a per-plot basis using a single representative grain sample per plot, and no technical replicates were performed.
Whole-grain flour used for GS and YI measurements was prepared using a Udy Cyclone mill fitted with a 0.5-mm sieve. Gluten strength was determined using a microscale sodium dodecyl sulfate (SDS) sedimentation procedure adapted from Moroccan Standard N.M. 08.1.217 and AACC Method 56-70 (AACC, 2000), following the general procedure described by Manhou et al. (2025).
Four reagents were prepared. Reagent 1 consisted of 10 mg of Coomassie Brilliant Blue dissolved in 1 L of distilled water. Reagent 2 was prepared by diluting 10 mL of 85% lactic acid in 80 mL of distilled water. Reagent 3 consisted of 30 g of sodium dodecyl sulfate dissolved in distilled water and adjusted to a final volume of 1 L. Reagent 4 was prepared by mixing 10 mL of reagent 2 with 480 mL of reagent 3.
For each plot sample, 1.0 g of whole-grain flour was placed in a 25-mL graduated tube, and 8 mL of reagent 1 was added. The suspension was mixed for 10 s and allowed to stand for 4 min 30 s, with brief vortex mixing after 2 min 30 s. At the end of this period, the suspension was vortexed again, and 12 mL of reagent 4 was added. The tubes were mechanically agitated for 2 min and then left undisturbed for 14 min. The sedimentation volume was read to the nearest 0.5 mL and expressed in mL, with higher values indicating greater gluten strength.
The yellow index (YI), represented by the b* coordinate of the CIELAB color system, was measured using a Konica Minolta CR-400 chroma meter (Konica Minolta Sensing Inc., Osaka, Japan). Before measurement, the instrument was calibrated using the manufacturer-provided white calibration plate (Konica Minolta, 2007). One color reading was taken from the whole-grain flour sample obtained from each field plot. Because each genotype was evaluated in three blocks within each environment, three independent plot-level b* observations were obtained per genotype and environment. Higher b* values indicated greater flour yellowness.
After removal of impurities, 1,000 kernels from each plot sample were counted using a NUMIGRAL automatic grain counter and weighed on a precision balance. Thousand-kernel weight was expressed in grams, with one determination per plot sample (ISTA, 2015). Test weight was determined on cleaned grain using a 100-mL measuring container, following the same filling procedure for all samples. The grain contained in this volume was weighed on a precision balance, and the result was expressed in kg hL⁻¹. One determination was performed per plot sample. TKW and TW were determined at the grain moisture content prevailing at the time of laboratory analysis and were not adjusted to a standardized moisture basis.
Statistical analyses were performed using the R statistical environment (R version 4.3.2) (R Core Team, 2023). For each trait, linear mixed-effects models were fitted using the lmer function from the lme4 package, and the significance of fixed effects was evaluated using the lmerTest package based on the Satterthwaite approximation for degrees of freedom. Model assumptions were verified by inspecting residual plots for normality and homoscedasticity.
The following linear mixed model was used:
\(Y_{\text{ijk}}\ = \ \mu\ + \ E_{\text{i}}\ + \ G_{\text{j}}\ + \ \text{(GE)}_{\text{ij}}\ + \ B_{\text{k}}(E_{\text{i}})\ + \ \varepsilon_{\text{ijk}}\) (1)
where Yijk is the observed value of genotype j in environment i and block k; μ is the overall mean; Ei is the fixed effect of the ith environment; Gj is the random effect of the jth genotype; (GE)ij is the random genotype × environment interaction; Bk(Ei) is the random effect of block nested within environment; and εijk is the residual error. Because no additional technical replication was performed, the residual variance included both plot-level variability and any remaining analytical measurement error, which could not be estimated separately.
Variance components and genotypic best linear unbiased predictions (BLUPs) were estimated by restricted maximum likelihood (REML) using the lmer function of the lme4 package (Bates et al., 2015). The significance of the fixed environmental effect was assessed using an F-test with denominator degrees of freedom approximated by the Satterthwaite method implemented in the lmerTest package (Kuznetsova et al., 2017). Genotypic performance across environments was predicted using BLUPs, which account for shrinkage and the random nature of genotype and genotype × environment effects in multi-environment trials (Smith et al., 2005; Cullis et al., 2006; Piepho et al., 2008).
The significance of the genotype and genotype × environment variance components was assessed using likelihood-ratio tests based on maximum-likelihood fits. For the genotype effect, the full model was compared with a reduced model excluding Gj while retaining the environment, genotype × environment, and block-within-environment terms. For the genotype × environment effect, the full model was compared with a reduced model excluding (GE)ij while retaining the environment, genotype, and block-within-environment terms. The likelihood-ratio statistics were evaluated using an approximate chi-square distribution with one degree of freedom. Because variance components are constrained to be non-negative and lie on the boundary of the parameter space under the null hypothesis, the resulting probability values were interpreted as approximate. Ninety-five percent confidence intervals for variance components were obtained using profile likelihood.
Broad-sense heritability was calculated using 16 environments and three replications per environment, based on the unrounded REML variance-component estimates (Piepho and Möhring, 2007).
Broad-sense heritability across environments was calculated as:
\(H^{\text{2}}\ = \ \frac{\sigma_{\text{G}}^{\text{2}}}{\sigma_{\text{G}}^{\text{2}}\ + \ \frac{\sigma_{\text{GE}}^{\text{2}}}{n_{\text{e}}}\ + \ \frac{\sigma_{\text{e}}^{\text{2}}}{n_{\text{e}}\ \times \ n_{\text{r}}}}\) (2)
where σ²G is the genotypic variance, σ²GE is the genotype × environment interaction variance, σ²e is the residual variance, ne is the number of environments, and nr is the number of replications.
Genotype stability and predicted performance were jointly evaluated using the Weighted Average of Absolute Scores and Yield index (WAASBY), originally proposed to combine mean performance and stability into a single genotype-ranking criterion (Olivoto et al., 2019). In the present study, WAASBY was applied separately to each grain-quality trait, with the Y component representing the BLUP-predicted genotypic value of the corresponding trait rather than grain yield. The WAASB stability component was calculated from the genotype × environment BLUP matrix using singular-value decomposition. For each trait, BLUP-predicted genotypic values and inversely rescaled WAASB values were transformed to a 0–100 scale and combined using equal weights of 50% for performance and 50% for stability. Higher values were considered desirable for GS, YI, TKW, and TW. Consequently, higher WAASBY values indicated a more favorable combination of predicted performance and stability across the evaluated environments.
\[\text{WAASBY}\ = \ \text{[(rescaled\ }Y_{\text{i}}\text{\ ×\ 50)\ +\ (rescaled\ }{WAASB}_{\text{i}}\text{\ ×\ 50)]\ /\ 100}\]
Multi-trait genotype–ideotype distance index (MGIDI) was calculated from the BLUP-predicted genotypic values of GS, YI, TKW, and TW. All traits were assigned equal weights, and higher values were specified as desirable. The variables were standardized before factor analysis. The distance of each genotype from the defined ideotype was then calculated in the factor space. Genotypes with lower MGIDI values were considered closer to the ideotype. A selection intensity of 20% was applied, corresponding to five selected genotypes. All analyses were carried out using the R packages lme4, lmerTest, metan (Olivoto and Lúcio, 2020), dplyr, tidyr, and ggplot2. The datasets and R scripts used in this study are available from the corresponding author upon reasonable request.
Equal trait weights and a 20% selection intensity were specified a priori to give the four traits identical importance and to retain five genotypes for further evaluation. The resulting rankings are therefore conditional on these weighting and selection-intensity choices.
This study demonstrated that gluten strength, yellow index, thousand-kernel weight, and test weight were significantly influenced by the environment and genotype × environment interaction across the tested Moroccan environments. Trait-specific WAASBY rankings placed G5 and G17 among the top five genotypes for three traits, whereas G14, G19, and G22 ranked among the top five for two traits. No genotype ranked among the top five for all four traits. MGIDI selected G5, G19, G22, G4, and G13 as the genotypes closest to the ideotype based on their combined BLUP-predicted performance. G5, G19, and G22 were identified by both approaches and represent promising candidates for further evaluation based specifically on the four measured traits. G4 and G13 showed favorable multi-trait profiles but require additional evaluation to assess their stability across environments. These findings should not be interpreted as evidence of overall processing or pasta-making quality. Additional evaluation of grain protein content, vitreousness, semolina yield, and pasta-processing properties, together with validation in independent multi-environment trials, is required before broader conclusions regarding end-use quality or cultivar recommendations can be made.
The authors thank the technical staff of the seven experimental stations and the wheat breeding laboratory for their support in field management, sample handling, and grain-quality analyses.
OpenAI ChatGPT was used solely for English-language editing and paraphrasing. It was not used for data generation, statistical analysis, interpretation of results, or formulation of scientific conclusions. All revised text was reviewed and approved by the authors.
Conceptualization: M.T., F.G., S.B., G.D., and R.H.; Data curation: M.M.H. and F.G.; Formal analysis: M.M.H. and F.G.; Investigation: M.M.H., M.A.A., and H.E.B.; Methodology: M.T., F.G., and R.H.; Project administration: M.T.; Supervision: M.T., F.G., S.B., G.D., and R.H.; Validation: M.M.H., M.T., R.H., F.G., S.B., H.E.B., M.A.A., and G.D.; Visualization: M.M.H.; Writing – original draft: M.M.H.; Writing – review and editing: M.M.H. All authors read and approved the final version of the manuscript.
This study involved the field evaluation of cultivated durum wheat genotypes and did not involve human participants or animals. The experiments were conducted at research stations of the National Institute of Agronomic Research of Morocco within the framework of institutional research activities. Therefore, no specific ethical approval was required for this study.
This research received no specific external funding.
The authors declare that they have no competing interests.
The R script, analytical outputs, and plot-level dataset supporting the findings of this study are available from the corresponding author upon reasonable request.
AACC (2000) Approved methods of analysis, 10th edn. American Association of Cereal Chemists, St. Paul.
Al-Sayaydeh R, Shtaya MJ, Qubbaj T, Al-Rifaee MK, Alabdallah MA, Migdadi O, Gammoh IA, Al-Abdallat AM (2023) Performance and stability analysis of selected durum wheat genotypes differing in their kernel characteristics. Plants. 12(14):2664. https://doi.org/10.3390/plants12142664
Argyriou D (2023) Durum wheat: uses, quality characteristics, and applied tests. In: Wanyera R, Wamalwa M (eds) Wheat research and utilization. IntechOpen, London. https://doi.org/10.5772/intechopen.110613
Arzani A, Ashraf M (2017) Cultivated ancient wheats (Triticum spp.) as a potential source of health-beneficial food products. Compr Rev Food Sci Food Saf. 16(3):477–488. https://doi.org/10.1111/1541-4337.12262
Ayed S, Othmani A, Bouhaouel I, Teixeira da Silva JA (2021) Multi-environment screening of durum wheat genotypes for drought tolerance in changing climatic events. Agronomy. 11(5):875. https://doi.org/10.3390/agronomy11050875
Bates D, Mächler M, Bolker B, Walker S (2015) Fitting linear mixed-effects models using lme4. J Stat Softw. 67(1):1–48. https://doi.org/10.18637/jss.v067.i01
Bennani S, Nsarellah N, Jlibene M, Tadesse W, Birouk A, Ouabbou H (2017) Efficiency of drought tolerance indices under different stress severities for bread wheat selection. Aust J Crop Sci. 11(4):395–405. https://doi.org/10.21475/ajcs.17.11.04.pne272
Beres BL, Rahmani E, Clarke JM, Grassini P, Pozniak CJ, Geddes CM, Porker KD, May WE, Ransom JK (2020) A systematic review of durum wheat: Enhancing production systems by exploring genotype, environment, and management (G × E × M) synergies. Front Plant Sci. 11:568657. https://doi.org/10.3389/fpls.2020.568657
Boussakouran A, El Yamani M, Sakar EH, Rharrabti Y (2021) Genetic advance and grain yield stability of Moroccan durum wheats grown under rainfed and irrigated conditions. Int J Agron. 2021:5571501. https://doi.org/10.1155/2021/5571501
Crossa J, Burgueño J, Cornelius PL, McLaren G, Trethowan R, Krishnamachari A (2006) Modeling genotype × environment interaction using additive genetic covariances of relatives for predicting breeding values of wheat genotypes. Crop Sci. 46(4):1722–1733. https://doi.org/10.2135/cropsci2005.11-0427
Cullis BR, Smith AB, Coombes NE (2006) On the design of early generation variety trials with correlated data. J Agric Biol Environ Stat. 11(4):381–393. https://doi.org/10.1198/108571106X154443
FAO (2022) The State of Food Security and Nutrition in the World 2022. Food and Agriculture Organization of the United Nations, Rome.
Farhad M, Tripathi SB, Singh RP, Joshi AK, Bhati PK, Vishwakarma MK, Mondal S, Malik AA, Kumar U (2022) Multi-trait selection of bread wheat ideotypes for adaptation to early sown condition. Crop Sci. 62(1):67–82. https://doi.org/10.1002/csc2.20628
Guzmán C, Ibba MI, Álvarez JB, Sissons M, Morris CF (2022) Wheat quality. In: Reynolds MP, Braun HJ (eds) Wheat improvement: food security in a changing climate. Springer, Cham, pp 177–193. https://doi.org/10.1007/978-3-030-90673-3_11
IPCC (2021) Climate Change 2021: The Physical Science Basis. Contribution of Working Group I to the Sixth Assessment Report of the Intergovernmental Panel on Climate Change. Cambridge University Press, Cambridge. https://doi.org/10.1017/9781009157896
ISTA (2015) International Rules for Seed Testing. International Seed Testing Association, Bassersdorf.
Konica Minolta (2007) CR-400/410 Chroma Meter Instruction Manual. Konica Minolta Sensing Inc., Osaka.
Kumar A, Mantovani EE, Simsek S, Jain S, Elias EM, Mergoum M (2019) Genome wide genetic dissection of wheat quality and yield related traits and their relationship with grain shape and size traits in an elite × non-adapted bread wheat cross. PLoS One. 14(9):e0221826. https://doi.org/10.1371/journal.pone.0221826
Kuznetsova A, Brockhoff PB, Christensen RHB (2017) lmerTest package: Tests in linear mixed effects models. J Stat Softw. 82(13):1–26. https://doi.org/10.18637/jss.v082.i13
Machado e Silva C, Mezzomo HC, Ribeiro JPO, Freitas DS, Nardino M (2023) Multi-trait selection of wheat lines under drought-stress condition. Bragantia. 82:e20220254. https://doi.org/10.1590/1678-4499.20220254
Mackaye MH, Bennani S, Gaboun F, Hassikou R, Diria G, Abdellaoui MA, Taghouti M (2025) Identifying high-yielding and stable durum wheat genotypes using G × E analysis in climate change context. Plant Sci Today. 12(3):1–11. https://doi.org/10.14719/pst.6023
Magallanes-López AM, Ammar K, Morales-Dorantes A, González-Santoyo H, Crossa J, Guzmán C (2017) Grain quality traits of commercial durum wheat varieties and their relationships with drought stress and glutenins composition. J Cereal Sci. 75:1–9. https://doi.org/10.1016/j.jcs.2017.03.005
Manhou K, Taghouti M, Moussadek R, Elyacoubi H, Bennani S, Zouahri A, Ghanimi A, Sanad H, Oueld Lhaj M, Hmouni D, Dakak H (2025) Performance, agro-morphological, and quality traits of durum wheat (Triticum turgidum L. ssp. durum Desf.) germplasm: A case study in Jemâa Shaïm, Morocco. Plants. 14(10):1508. https://doi.org/10.3390/plants14101508
Mazzucotelli E, Sciara G, Mastrangelo AM, Desiderio F, Xu SS, Faris J, Hayden MJ, Tricker PJ, Ozkan H, Echenique V, Steffenson BJ, Knox R, Niane AA, Udupa SM, Longin FCH, Marone D, Petruzzino G, Corneti S, Ormanbekova D, Pozniak C, Roncallo PF, Mather D, Able JA, Amri A, Braun H, Ammar K, Baum M, Cattivelli L, Maccaferri M, Tuberosa R, Bassi FM (2020) The Global Durum Wheat Panel (GDP): an international platform to identify and exchange beneficial alleles. Front Plant Sci. 11:569905. https://doi.org/10.3389/fpls.2020.569905
Nsarellah N, Nachit M, Taghouti M, Lhaloui S, Amamou A (2022) Registration of ‘Faraj’, a Hessian fly– and multiple disease–resistant durum wheat cultivar in Morocco. J Plant Regist. 16(2):378–384. https://doi.org/10.1002/plr2.20194
Olivoto T, Diel MI, Schmidt D, Lúcio AD (2022) MGIDI: A powerful tool to analyze plant multivariate data. Plant Methods. 18(1):121. https://doi.org/10.1186/s13007-022-00952-5
Olivoto T, Lúcio AD (2020) metan: An R package for multi-environment trial analysis. Methods Ecol Evol. 11(6):783–789. https://doi.org/10.1111/2041-210X.13384
Olivoto T, Lúcio AD, da Silva JAG, Marchioro VS, de Souza VQ, Jost E (2019) Mean performance and stability in multi-environment trials I: Combining features of AMMI and BLUP techniques. Agron J. 111(6):2949–2960. https://doi.org/10.2134/agronj2019.03.0220
Olivoto T, Nardino M (2021) MGIDI: Toward an effective multivariate selection in biological experiments. Bioinformatics. 37(10):1383–1389. https://doi.org/10.1093/bioinformatics/btaa981
Piepho HP, Möhring J (2007) Computing heritability and selection response from unbalanced plant breeding trials. Genetics. 177(3):1881–1888. https://doi.org/10.1534/genetics.107.074229
Piepho HP, Möhring J, Melchinger AE, Büchse A (2008) BLUP for phenotypic selection in plant breeding and variety testing. Euphytica. 161(1–2):209–228. https://doi.org/10.1007/s10681-007-9449-8
Puglisi D, Crossa J, Cuevas J, Fania F, Afshari-Behbahanizadeh S, Vitale P, De Vita P (2026) Multi-trait and multi-environment genomic prediction enhances yield components improvement in durum wheat. Front Plant Sci. 17:1759897. https://doi.org/10.3389/fpls.2026.1759897
R Core Team (2023) R: A language and environment for statistical computing. R Foundation for Statistical Computing, Vienna.
Rharrabti Y, Royo C, Villegas D, Aparicio N, García del Moral LF (2003) Durum wheat quality in Mediterranean environments: I. Quality expression under different zones, latitudes and water regimes across Spain. Field Crops Res. 80(2):123–131. https://doi.org/10.1016/S0378-4290(02)00176-4
Royo C, Elias EM, Manthey FA (2009) Durum wheat breeding. In: Carena MJ (ed) Cereals. Handbook of Plant Breeding, vol 3. Springer, New York, pp 199–226. https://doi.org/10.1007/978-0-387-72297-9_6
Sissons M (2008) Role of durum wheat composition on the quality of pasta and bread. Food. 2:75–90.
Sissons M, Kadkol G, Taylor J (2020) Genotype by environment effects on durum wheat quality and yield—Implications for breeding. Crop Breed Genet Genom. 2(4):e200018. https://doi.org/10.20900/cbgg20200018
Smith AB, Cullis BR, Thompson R (2005) The analysis of crop cultivar breeding and evaluation trials: an overview of current mixed model approaches. J Agric Sci. 143(6):449–462. https://doi.org/10.1017/S0021859605005587
Taghouti M, Bassi FM, Nsarellah N, Amri A, Motawaj J, Nachit M (2023) ‘Nachit’, a wild-relative-derived durum wheat resilient to climate change in Morocco. J Plant Regist. 17(3):529–535. https://doi.org/10.1002/plr2.20292
Tahir ISA, Elbashier EME, Mustafa HM, Elhashimi AMA, Abdalla MGA, Hassan MK, Saad ASI, Elbashir AAE, Elsheikh O, Meheesi S (2023) Durum wheat field performance and stability in the irrigated, dry and heat-prone environments of Sudan. Agronomy. 13(6):1598. https://doi.org/10.3390/agronomy13061598
Taneva K, Bozhanova V, Petrova I (2019) Variability, heritability and genetic advance of some grain quality traits and grain yield in durum wheat genotypes. Bulg J Agric Sci. 25:288–295.
Table S1. Description of the experimental locations, including location code, coordinates, altitude, USDA soil texture, agroecological zone, and seasonal rainfall during the 2020–2021, 2021–2022, and 2022–2023 cropping seasons.
| Code | Location | Coordinates | Altitude (m) | Soil description | Agro-ecological zone | Rainfall 2020–21 (mm) | Rainfall 2021–22 (mm) | Rainfall 2022–23 (mm) |
|---|---|---|---|---|---|---|---|---|
| SAT | Sidi Allal Tazi | 34°31′ N, 6°19′ W | 10 | Limestone clay | Humid irrigated | 457.7 | 144.6 | 304.5 |
| DYT | Douyet | 34°02′ N, 5°07′ W | 416 | Clay limestone | Favorable rainfed | 381.5 | 197.2 | 112.7 |
| JSH | Jemâa Shaïm | 32°40′ N, 9°00′ W | 170 | Limestone Vertisol | Semi-arid | 196.0 | — | — |
| MCH | Marchouch | 33°56′ N, 6°45′ W | 410 | Vertisol | Favorable rainfed | 367.3 | 107.9 | 213.3 |
| TST | Tassaout | 32°03′ N, 7°24′ W | 465 | Stony soil | Arid irrigated | — | — | — |
| ANN | Annoceur | 33°41′ N, 4°51′ W | 1350 | Clay loam, limestone | Mountain | 320.0 | 270.0 | 362.0 |
| SEA | Sidi El Aydi | 33°07′ N, 7°37′ W | 240 | Clay loam | Semi-arid | 101.2 | 112.4 | 117.0 |
— = data not available. Soil texture classification follows the USDA system. Rainfall data for TST were unavailable because of incomplete meteorological records; this site was managed under full gravity irrigation.
Table S2. Summary of crop management practices at the seven INRA experimental stations used in the multi-environment trials.
| Attribute | SAT | MCH | DYT | SEA | TST | ANN | JSH |
|---|---|---|---|---|---|---|---|
| Station | Sidi Allal Tazi | Marchouch | Douyet | Sidi El Aydi | Tassaout | Annoceur | Jemâa Shaïm |
| Agro-climatic zone | Humid irrigated | Favorable rainfed | Favorable rainfed | Semi-arid | Arid irrigated | Mountain | Arid |
| Tillage | Moldboard plough (~25 cm) | Moldboard plough (~25 cm) | Moldboard plough (~25 cm) | Moldboard plough (~25 cm) | Moldboard plough (~25 cm) | Moldboard plough (~25 cm) | Moldboard plough (~25 cm) |
| Basal fertilizer formulation and application rate | 10–30–10 (NPK 10–30–10 at 100 kg ha⁻¹) + 21–0–0 (ammonium sulfate at 100 kg ha⁻¹) | Soil-test-based (OM, P-Olsen, exchangeable K; exact rate not available) | Soil-test-based (OM, P-Olsen, exchangeable K; exact rate not available) | Soil-test-based (OM, P-Olsen, exchangeable K; exact rate not available) | 31.5–67.5–24 (150 kg ammonium sulfate + 150 kg superphosphate + 50 kg potassium sulfate) | 10–25–20 (NPK 10–25–20 at 100 kg ha⁻¹) | Soil-test-based (OM, P-Olsen, exchangeable K; exact rate not available) |
| Nitrogen top-dressing | 1 split at tillering (100 kg ha⁻¹ ammonitrate) | 2 splits (standardized protocol; station records) | 2 splits (standardized protocol; station records) | 1–2 splits (standardized protocol; station records) | 2 splits (150 kg ha⁻¹ ammonium nitrate each) | 1–2 splits (adjusted; station records) | 1–2 splits (standardized protocol; station records) |
| Irrigation regime | Rainfed + supplementary irrigation | Rainfed | Rainfed | Rainfed + supplementary irrigation (~24 mm, 3 events) | Full irrigation (gravity) | Rainfed | Rainfed |
| Sowing period | Nov – Dec | Nov – Dec | Nov – Dec | Nov – Dec | Nov – Dec | Dec – Jan | Nov – Dec |
| Harvest period | May – July | May – July | May – July | Apr – June | May – July | June – July | Apr – June |
| Previous crop | Fallow / maize | Fallow / legumes | Fallow / legumes | Fallow / cereals | Maize / fallow | Fallow | Fallow / cereals |
| Weed control | Chemical + manual | Chemical + manual | Chemical + manual | Chemical + manual | Chemical + manual | Chemical + manual | Chemical + manual |
Notes: Basal fertilizers were applied at sowing according to site-specific soil-test recommendations. Exact fertilizer formulations and application rates are reported where available. Where exact rates could not be retrieved from the archived station records, fertilization is reported as soil-test-based. Nitrogen top-dressing was applied mainly as ammonium nitrate during tillering and/or stem elongation. All genotypes within a given environment received identical crop management.
Table S3. Pearson correlation matrix among BLUP-predicted genotypic values for four grain-quality traits.
| Trait | GS | YI | TKW | TW |
|---|---|---|---|---|
| GS | 1.000 | 0.314 | −0.213 | 0.255 |
| YI | 0.314 | 1.000 | −0.221 | −0.102 |
| TKW | −0.213 | −0.221 | 1.000 | 0.257 |
| TW | 0.255 | −0.102 | 0.257 | 1.000 |
Note: Correlations were calculated from BLUP-predicted genotypic values.
Table S4. Factor scores of the 25 durum wheat genotypes used to calculate MGIDI.
| Genotype | FA1 | FA2 |
|---|---|---|
| G1 | 2.120 | −2.617 |
| G2 | −0.295 | −1.184 |
| G3 | 0.596 | −2.251 |
| G4 | 1.186 | −3.679 |
| G5 | 1.104 | −4.187 |
| G6 | −0.216 | −1.753 |
| G7 | 0.534 | −0.826 |
| G8 | 1.438 | −2.669 |
| G9 | 2.740 | −0.985 |
| G10 | −0.316 | −2.861 |
| G11 | 2.629 | −1.427 |
| G12 | −0.406 | −3.147 |
| G13 | 1.834 | −3.102 |
| G14 | 0.183 | −2.158 |
| G15 | 2.133 | −1.747 |
| G16 | 2.834 | −2.247 |
| G17 | 2.098 | −2.826 |
| G18 | 1.206 | −0.770 |
| G19 | 1.094 | −4.073 |
| G20 | −0.099 | −1.247 |
| G21 | 1.266 | −1.411 |
| G22 | 1.869 | −3.567 |
| G23 | 1.462 | −2.095 |
| G24 | 1.170 | −1.702 |
| G25 | 2.066 | −1.596 |
Note: FA1 and FA2 are the genotype scores for the two retained factors used to calculate the multi-trait genotype–ideotype distance index (MGIDI). The two factors jointly explained 69.42% of the total variation.
Table S5. Relative contributions of the retained factors to the MGIDI value of each genotype.
| GEN | FA1 contribution (%) | FA2 contribution (%) |
|---|---|---|
| G5 | 58.23 | 41.77 |
| G19 | 55.15 | 44.85 |
| G22 | 19.83 | 80.17 |
| G4 | 44.14 | 55.86 |
| G13 | 17.02 | 82.98 |