Australian Journal of Crop Science
Article | https://doi.org/10.21475/ajcs.26.20.10.pne302
Submitted: 14 April 2026 | Revised: 03 July 2026 | Accepted: 24 August 2026
Pages 865–878
Temperature, precipitation and soybean yield in the Brazilian Cerrado: A long-term analysis
Gabriella da Silva Santos¹, Rafael Battisti¹, Diogo Amorim Silva¹, Rafaella Resende Andrade¹, Marcio Mesquita¹, Angelina Harmyans Ciappina², Vitor Pureza Cardoso¹, Alisson Neves Harmyans Moreira*¹
1Universidade Federal de Goiás (UFG), Goiânia, GO, Brazil
2Centro Universitário Araguaia (UniAraguaia), Goiânia, GO, Brazil
*Corresponding author: alisson.harmyans@ufg.br
ORCID: https://orcid.org/0000-0001-5835-1581
Abstract: Soybean (Glycine max L.) is strategically important to Brazilian agribusiness, and south-western Goiás is one of the country’s main production hubs. However, soybean yield is highly sensitive to climatic variability, especially temperature and precipitation fluctuations in the Brazilian Cerrado biome, a tropical savanna ecosystem with Aw climate according to the Köppen-Geiger classification. This study analysed the influence of climatic variables on soybean yield in south-western Goiás, Brazil, from the 1989/90 to 2022/23 growing seasons, aiming to identify trends and relationships that may support agricultural adaptation strategies. Yield data were obtained from IBGE, and daily meteorological data from the NASA POWER platform. The climatological water balance was calculated using the Thornthwaite and Mather (1955) method, with soil root depth crop coefficients adjusted to soybean phenological stages. The water requirement satisfaction index (WRSI) and accumulated growing degree days (GDD) were then determined, and the yield series was detrended using linear regression. Technological progress explained 84% of the historical yield increase (45.7 kg ha⁻¹ year⁻¹ over 34 crop years; R² = 0.84), with peak yield (3,900 kg ha⁻¹) recorded in 2022/23. Accumulated precipitation and GDD were not significantly related to yield (R² < 0.01; p > 0.05), whereas WRSI showed the highest but still modest explanatory power among the indicators tested (R² = 0.085; p = 0.095), explaining 8.5% of corrected yield variability. These results suggest that effective water availability may modulate soybean yield, although WRSI should be interpreted as a complementary rather than standalone predictor.
Keywords: Climate variability; NASA POWER; soybean yield; water balance.
Abbreviations: GDD, growing degree days; WRSI, water requirement satisfaction index; ET, evapotranspiration; ETa, actual crop evapotranspiration; ETp, potential crop evapotranspiration; ETo, reference evapotranspiration; IBGE, Brazilian Institute of Geography and Statistics; NASA POWER, National Aeronautics and Space Administration Prediction of Worldwide Energy Resources.
Soybean (Glycine max L.) is one of the main agricultural crops in Brazil, accounting for a significant portion of the national grain production and playing a crucial role in the agribusiness economy. Brazilian soybean production is the largest in the world, reaching 171.5 Mt, the 2024/25 crop year, cultivated in an area of 47.35 M ha, with an average yield of 3,621 kg ha⁻¹ (CONAB, 2025).
The state of Goiás stands out in national production, with the south-western region being one of the main producing areas. In 2022, the municipality of Rio Verde ranked second nationally, with a production of 1.64 Mt, while the municipality of Jataí was among the 15 largest producers in the country, ranking 11th with 1.2 Mt, representing an increase of 8.5% compared to the previous year (IBGE, 2022). Currently, the municipality of Rio Verde remains the largest producer in the state and holds fourth position at the national level (IBGE, 2024).
However, soybean yield is directly related to climatic conditions, particularly temperature and precipitation, which affect crop development from germination to harvest (Battisti and Sentelhas, 2014). Climate variability and the effects of climate change have become increasingly relevant in analyses of agricultural yield, especially in rainfed regions, where changes in air temperature and rainfall patterns significantly compromise the yields of crops such as maize, soybean and common bean (Lisbinski, 2025; Nenwala et al., 2025).
In the region, producers face challenges arising from rainfall irregularity and increasing temperatures, which may compromise soybean yields and, consequently, the economic viability of production (FAEG, 2023). The crucial role of water in plant physiological processes is therefore highlighted, as water deficit during critical stages such as flowering and grain filling can accelerate maturation, reduce grain size and cause substantial losses, even when total rainfall appears to be sufficient (Baioco et al., 2023).
The use of satellite data to determine the temporal and spatial variability of precipitation and temperature has become an essential tool in climate analysis, given that the availability of ground-based meteorological radar remains limited in Brazil (dos Santos et al., 2025). This limitation poses a challenge for producers and researchers seeking to better understand the relationship between climate variability and agricultural yield.
Considering these effects, a precise understanding of the spatial and temporal dynamics of climatic variables becomes essential for anticipating risks and guiding management decisions. The use of satellite data to assess the temporal and spatial variability of precipitation and temperature has been established as a key tool in climate analysis, as the availability of ground-based meteorological radar systems remains limited in Brazil (Battisti et al., 2024; dos Santos et al., 2025). This limitation represents a challenge for producers and researchers seeking to better understand the relationship between climate variability and agricultural yield (Battisti et al., 2018).
To overcome this limitation, remote sensing technologies, such as satellites operated by the National Aeronautics and Space Administration (NASA), have become a viable alternative for climate monitoring. The NASA POWER system provides detailed data on temperature, precipitation and solar radiation, offering a comprehensive overview of meteorological conditions and enabling more accurate analyses of the influence of climate on agricultural yield (Battisti et al., 2024; Monteiro et al., 2018; NASA, 2024).
In this context, although studies exist on the impacts of climate on soybean at national and state levels, the study region presents unique edaphoclimatic conditions and production dynamics that justify a specific analysis, capable of capturing how these particularities influence yield over time. Therefore, the aim of this study was to analyse the influence of temperature and precipitation on soybean yield in south-western Goiás between the 1989/90 and 2022/23 harvests.
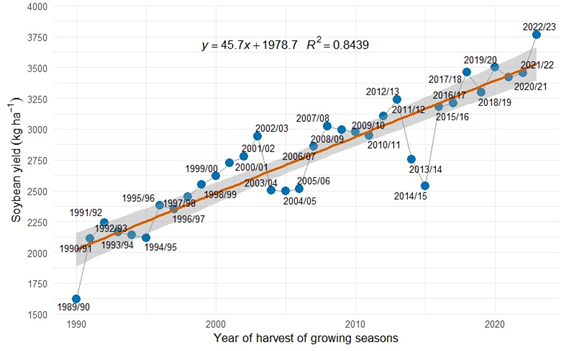
The historical series of soybean yield (kg ha⁻¹) over 34 growing seasons, covering the period from 1989/90 to 2022/23. The analysis of this series indicates a consistent increasing trend in yield, as demonstrated by the linear regression equation (Fig. 1a), which reveals an average increase of approximately 45.7 kg ha⁻¹ year⁻¹. The rate of yield increase is higher than reported by Teixeira et al. (2019) for Primavera do Leste, MT, with 27 kg ha⁻¹ year⁻¹, but near then two regions of Parana state, which ranged from 40 to 43 kg ha⁻¹ year⁻¹.
The increase in yield can be largely attributed to innovations in the agricultural sector, particularly genetic improvements in cultivars, advancements in crop management practices, and the greater adoption of modern production technologies. These findings are consistent with national studies that identify genetic progress combined with efficient agronomic practices as the main drivers of the continuous increase in soybean yield in Brazil (Monaco et al., 2025; Sentelhas et al., 2015). However, despite technological advances, climatic variability continues to play a decisive role on yield outcomes across growing seasons, modulating the expression of technological gains and regional yield stability (Reis et al., 2020; Rodrigues et al., 2023).
After removing the technological effect, the corrected yield series was obtained (Fig. 1b), revealing well-defined interannual fluctuations associated with climatic variability. The observed oscillations reflect the crop response to the climate conditions of each growing season. Seasons such as 1991/92, 2002/03, 2007/08, 2012/13, 2017/18, and 2022/23 showed yields above the mean trend, suggesting periods with more favourable climatic conditions. In contrast, the 1994/95, 2003/04, 2005/06, 2013/14, and 2014/15 seasons recorded marked yield reductions. These results confirm that yield stability does not depend exclusively on the technological package, as interannual variations persist even after data correction. The presence of peaks and troughs in the corrected series suggests a strong crop–environment interaction.
The increase in yield can be largely attributed to innovations in the agricultural sector, particularly genetic improvements in cultivars, advancements in crop management practices, and the greater adoption of modern production technologies. In the Brazilian Cerrado, these innovations include the development of high-yielding and stress-tolerant soybean cultivars, which have been essential for yield gains and adaptation to tropical conditions (Corbellini et al., 2024). In addition, soil management practices such as acidity correction through liming and gypsum application, biological nitrogen fixation (BNF), no-tillage systems and precision agriculture technologies have contributed to improving soil quality, nutrient-use efficiency, and overall crop performance (Santos et al., 2021; Santos et al., 2026).
These findings are consistent with national studies that identify genetic progress combined with efficient agronomic practices as the main drivers of the continuous increase in soybean yield in Brazil (Sentelhas et al., 2015). Furthermore, biological nitrogen fixation has been widely recognized as a key sustainability-driven technology that reduces fertilizer dependence while maintaining high productivity levels in soybean systems (Hungria et al., 2013).
In this context, the municipality of Rio Verde stands out (Fig. 2), having exhibited a substantial enlargement of the area allocated to soybean cultivation over a 33-year period, increasing from 182,050 ha in 1990 to 419,826 ha in 2023 (MapBiomas, 2025). Between 2000 and 2023, a marked rise in production was observed, with output nearly tripling from 609,178 t to 1.77 Mt (IBGE, 2024).
(a)
(b)
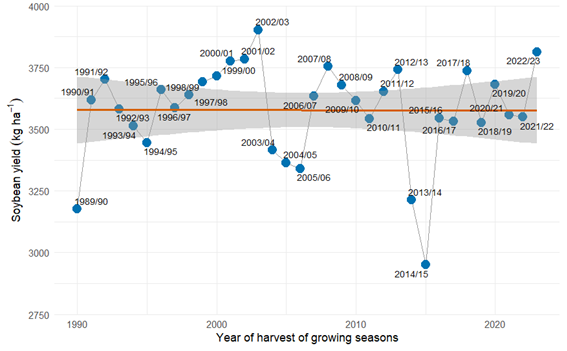
Fig. 1. Soybean yield in south-western Goiás, Brazil, from 1989/90 to 2022/23: (a) historical soybean yield series with the linear trend representing long-term technological progress; and (b) soybean yield adjusted after removing the technological effect, highlighting interannual fluctuations and above- and below-trend seasons.
The soil types in the region is one of the key point to improve yield over de growing seasons and, in association with climate, the growing area. Fig. 3 shows the predominance of Ferralsols in the study area, which correspond primarily to Latossolos Vermelhos and Latossolos Vermelho-Amarelos according to the Brazilian Soil Classification System (SiBCS). Less extensive areas are occupied by Acrisols, Arenosols, and Nitisols, corresponding respectively to Argissolos Vermelho-Amarelos, Neossolos Quartzarênicos and Nitossolos Vermelhos in the Brazilian classification (Santos et al., 2025; WRB, 2022).
These soil classes are widely distributed throughout the Brazilian Cerrado and constitute the main edaphic environment supporting large-scale soybean production in the region. In 2023, the five leading soybean-producing municipalities in the study area were Rio Verde, Jataí, Montividiu, Mineiros, and Chapadão do Céu, in descending order of production, all of which are predominantly located in areas characterized by Ferralsols (IBGE, 2024; MapBiomas, 2025).
Ferralsols are highly weathered, deep, and well-drained soils, generally exhibiting a clayey texture, high porosity, and good structural stability. These physical attributes promote root development, water infiltration and water storage in deeper soil layers, contributing to crop resilience under short-term dry periods (da Silva et al., 2014).
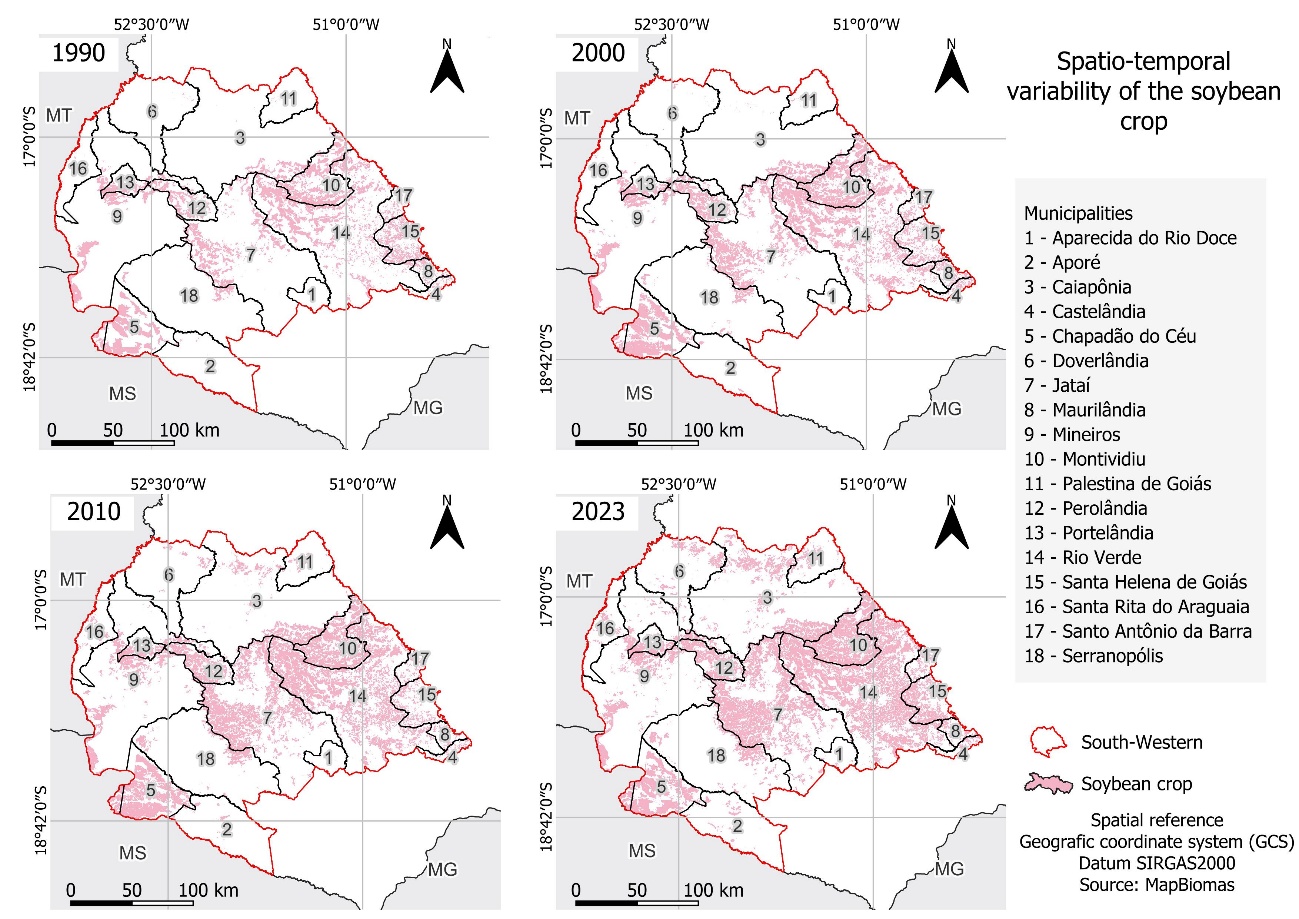
Fig. 2. Spatio-temporal variability of the soybean crop in the south-western region of the state of Goiás.
From a chemical perspective, the Ferralsols are typically characterized by acidic pH, low natural fertility, low base saturation, and high concentrations of iron and aluminum oxides. As a result, agricultural production in the region depends on soil correction practices, particularly liming and fertilization, to ensure adequate nutrient availability for soybean growth (Brignoli et al., 2024).
The predominance of these soils may have influenced the yield responses observed in this study. Although their favourable physical properties enhance soil water storage, prolonged periods of water deficit can limit water availability during critical soybean phenological stages. Therefore, the effects of climatic variability on yield are likely associated not only with fluctuations in precipitation and temperature but also with the soil's capacity to retain and supply water to the crop (de Oliveira et al., 2023).
Accumulated precipitation over the 120-day crop cycle was analysed across the 34 growing seasons of the study period (Fig. 4). The linear trend line indicates a gradual and statistically significant reduction in mean precipitation (R² = 0.39; p < 0.001), evidencing a consistent weakening of rainfall during the soybean productive cycle. Although total precipitation still exhibits interannual variability, the negative trend observed over the decades reveals a systematic change in the regional hydrological regime, consistent with the pattern of declining rainfall reported in the state (Battisti et al., 2025) and in different areas of the Brazilian Cerrado (Soares et al., 2025).
The reduction in cumulative precipitation over the 120-day soybean growing season, combined with the alternation of extremely wet growing seasons, such as 1996/97 (1,070 mm), 2001/02 (1,061 mm), and 2006/07 (1,071 mm), in sharp contrast to seasons characterised by severe deficits, such as 1991/92 (806 mm), 2000/01 (775 mm), and particularly 2013/14 (575 mm) and 2020/21 (499 mm), the latter being the driest season in the series. These peaks and troughs reflect the inherent hydrological instability of the region, which requires farmers to adopt adaptive management strategies, including adjustments in sowing dates, the use of drought-tolerant cultivars, and soil and water conservation practices (Moreira et al., 2025a; Santos et al., 2026).
The extreme oscillation between wet and dry years highlights the high vulnerability of soybean to interannual climatic conditions, even within a context of continuous technological advancement. It is observed that seasons with lower yields, such as 2013/14 and 2014/15, coincided with periods of water deficit, which constrained optimal growth conditions during critical stages of the crop cycle.
Although precipitation is the dominant hydrological factor, its impact on yield is also modulated by other climatic variables, such as high temperatures and increased evapotranspiration, which intensify water stress and reduce the physiological efficiency of the crop (Sentelhas et al., 2015; Silva et al., 2023). Therefore, not all yield variations can be explained solely by rainfall volume, making it essential to consider the combined effects of thermal stress, rainfall intensity and distribution. This reinforces the complexity of soybean responses to interannual climatic conditions and the need for integrated adaptive management strategies.
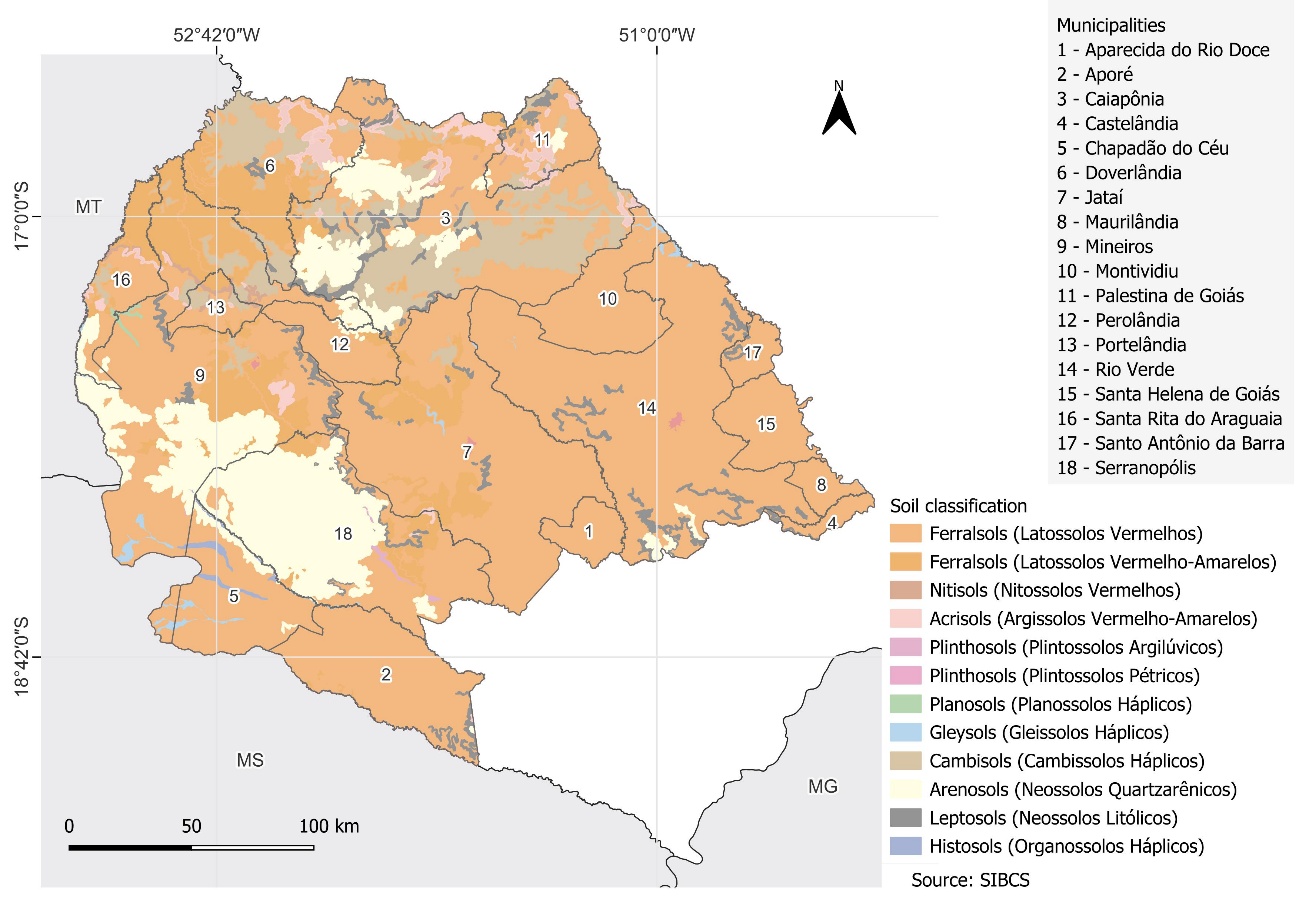
Fig. 3. Soil classification of the municipalities in south-western Goiás, Brazil.
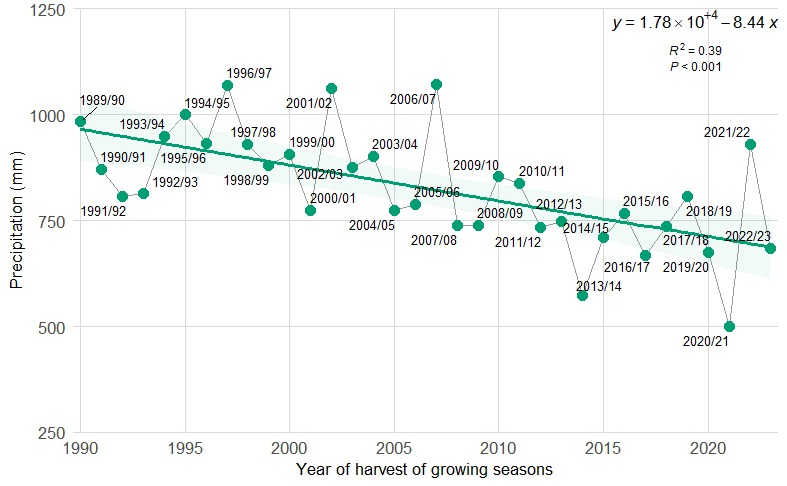
Fig. 4. Accumulated precipitation (mm) over the 120-day soybean growing season in south-western Goiás, Brazil (1989/90–2022/23), showing high interannual variability and a significant declining trend over time.
Analysis of accumulated growing degree-days (GDD) over the 34 growing seasons reveals a positive and statistically significant linear trend (R² = 0.27; p < 0.01), indicating a gradual increase in mean thermal accumulation during the soybean productive cycle, which ranged from approximately 1,350 (minimum observed) to 1,650 °C day (maximum observed) (Fig. 5). This pattern reflects the regional warming observed in recent decades, in agreement with studies reporting increases in mean temperatures in agricultural areas of the Cerrado, associated with both global warming and changes in land use and land cover (Caetano et al., 2018; Silva et al., 2023; Soares et al., 2025).
Despite this upward trend, high interannual variability is observed, with pronounced oscillations between consecutive growing seasons, suggesting the influence of short-term climatic anomalies, such as El Niño and La Niña events. Among the seasons with higher thermal accumulation, 1997/98 (1,547 °C day), 2002/03 (1,522 °C day), 2015/16 (1,589 °C day), 2019/20 (1,593 °C day), and 2020/21 (1,633 °C day) stand out, the latter presenting the highest value in the historical series. These periods generally coincide with warmer and drier conditions, which may have accelerated the soybean phenological cycle, thereby reducing the time available for grain filling. In the study, it was considered a fix cycle of 120 days, due to changes in maturity groups can compensate increase of temperature, adjusting the cycle (Fernandes et al., 2022).
The adoption of a fixed 120-day cycle represents a methodological simplification and an additional source of uncertainty, as the regional sowing window may vary by approximately 30–60 days and different soybean maturity groups can result in crop cycles ranging from about 100 to 140 days. Nevertheless, because yield data were analysed as municipal averages, the use of a representative sowing date and mean crop cycle was considered appropriate to capture regional-scale climatic effects while preserving comparability among growing seasons (Santos et al., 2021).
In contrast, the 1992/93, 1996/97, 2001/02, 2010/11, 2011/12, and 2021/22 seasons exhibited lower accumulated growing degree-day values, namely 1,353, 1,356, 1,392, 1,402, 1,418, and 1,471 °C day, respectively. These seasons were associated with thermally milder conditions, which prolonged the crop cycle and favored a longer duration of the vegetative and reproductive phases.
Although the altitude of the study area (approximately 700–800 m) contributes to moderating air temperatures and extending the soybean growing cycle, the observed increase in accumulated growing degree-days suggests that regional warming has progressively reduced this thermal buffering effect. Consequently, higher thermal accumulation may accelerate crop development, shorten grain-filling duration, and alter cultivar adaptation, particularly under water-limited conditions (Sentelhas et al., 2015; Wen et al., 2022).
Overall, the progressive increase in accumulated growing degree-days indicates that soybean cultivation in the region has been occurring under a more thermally demanding environment, thereby altering phenological and cultivar thermal requirements. This scenario reinforces the need for adjustments in agricultural zoning, including the revision of sowing windows and the adoption of cultivars belonging to later maturity groups (MG 7.0 to 8.5), which exhibit longer cycle duration and greater capacity to use thermal accumulation and solar radiation (Friedrich et al., 2023; Sentelhas et al., 2015; Wen et al., 2022).
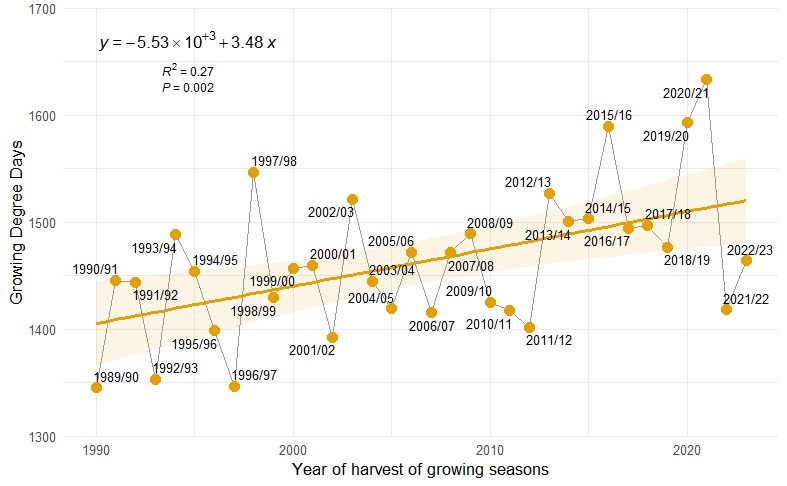
Fig. 5. Accumulated growing degree-days (GDD; °C days) over the 120-day soybean growing cycle in south-western Goiás, Brazil (1989/90–2022/23), showing a significant increase in thermal accumulation across the study period.
Analysis of the time series of the Water Requirement Satisfaction Index (WRSI) reveals a negative and statistically significant linear trend (R² = 0.33; p < 0.01), indicating that approximately 33% of the index variability can be explained by the temporal progression of the growing seasons (Fig. 6). The mean decline is about −0.004 units per season, suggesting a slight reduction in average water requirement satisfaction over the analysed period. This behaviour indicates a trend towards progressive hydrological imbalance, possibly associated with decreasing precipitation (Fig. 4) and increasing thermal accumulation (Fig. 5), resulting in higher evaporative demand on regional production systems (Reis et al., 2020; Rodrigues et al., 2023).
Marked interannual variability in the WRSI reflects the influence of climatic variability. Higher WRSI values (close to 1.0), observed in the 1992/93, 1996/97, 2001/02, 2006/07, 2009/10, and 2021/22 seasons, indicate adequate water supply, favoring balanced vegetative growth and grain filling. In contrast, low WRSI values, particularly in 2005/06, 2013/14, 2014/15, 2017/18, and 2020/21 (minimum of 0.74), reflect irregular rainfall and increased soil water deficit, conditions associated with elevated water stress and reduced water-use efficiency.
The 2017/18 season is noteworthy because, despite being classified among the lower WRSI seasons, it was also identified as a year with above-trend corrected yield. This contrast indicates that WRSI does not fully capture all high-yield seasons, suggesting that other factors, such as rainfall distribution during critical phenological stages, cultivar performance, and crop management, may also have contributed to the favorable yield response.
Studies show that WRSI values below 0.8 are associated with yield reductions, especially during reproductive stages, whereas in conservation systems, such as no-tillage, losses become evident only below WRSI = 0.7 (Debiasi et al., 2022). In this study, the 2020/21 season provides an internal check of these thresholds, as it recorded the lowest WRSI (0.74), the lowest precipitation (499 mm), the highest thermal accumulation (1,633 °C day), and below-average corrected soybean yield. This indicates that yield reduction was detectable while WRSI remained between 0.7 and 0.8, making the response more consistent with the 0.8 threshold, although conservation management may have buffered part of the loss. The simultaneous increase in thermal accumulation and decline in WRSI reinforces water deficit as a key constraint to soybean yield under regional warming (Caetano et al., 2018; Moreira et al., 2025b).
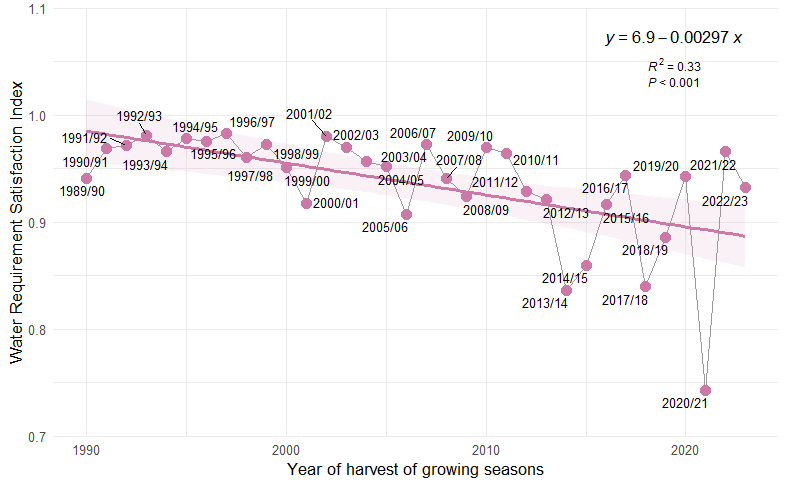
Fig. 6. Mean Water Requirement Satisfaction Index (WRSI) over the 120-day soybean growing cycle in south-western Goiás, Brazil (1989/90–2022/23), showing a significant declining trend in water requirement satisfaction over time.
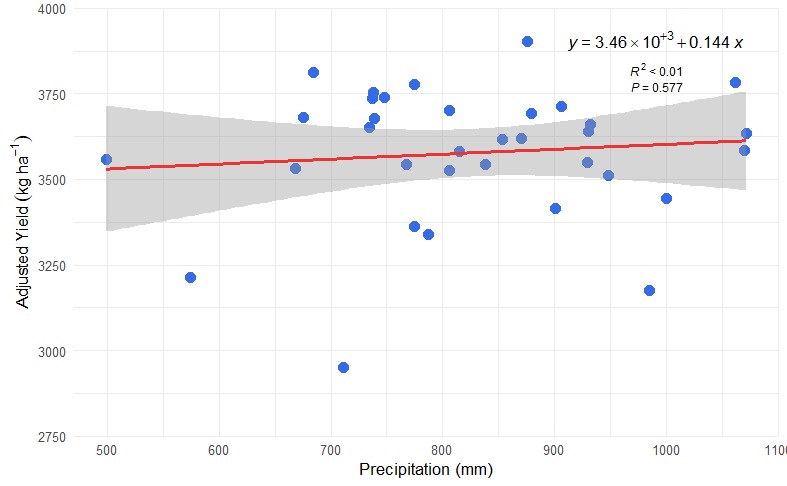
Soybean yield detended and accumulated precipitation over the 120-day crop cycle, showed wide dispersion of data points around the trend line (Fig. 7a). Linear regression yielded an R² value of 0.0098 (p = 0.577), indicating that total precipitation explains less than 1% of yield variability and is not statistically significant. These results demonstrate that, although water is essential for soybean development, total rainfall alone is a poor predictor of yield, as the decisive factor is rainfall temporal distribution and its coincidence with critical crop stages, particularly flowering and grain filling (Sentelhas et al., 2015; Reis et al., 2020). Indeed, years with approximately 1,000 mm of poorly distributed rainfall may be more detrimental than seasons with around 800 mm evenly distributed precipitation, a pattern widely reported for the Brazilian Cerrado (Rodrigues et al., 2023).
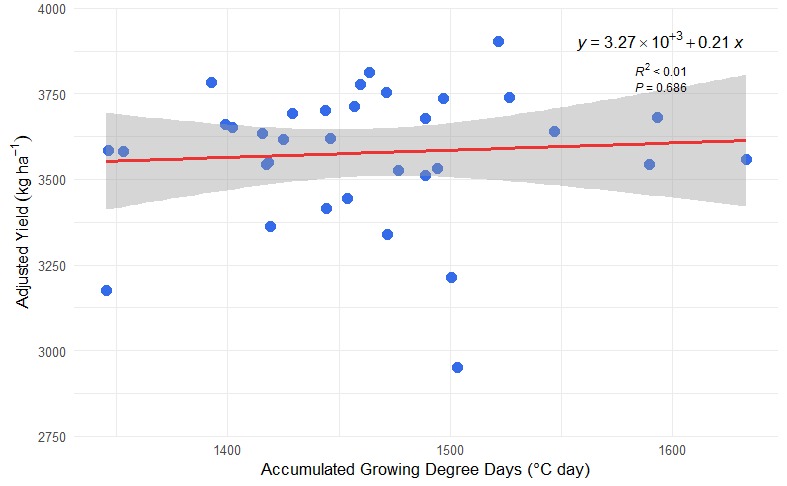
Accumulated growing degree-days (Fig. 7b) was not statistically significant (R² = 0.0052; p = 0.686), indicating that thermal warming alone does not account for interannual yield variability. This weak association suggests that increased thermal accumulation primarily accelerates the phenological cycle, without necessarily resulting in higher yields, as productivity emerges from complex interactions among temperature, water availability, and agronomic management (Silva et al., 2023). Consistently, patterns observed for both precipitation and GDD support the hypothesis that isolated climatic variables have limited explanatory power for yield fluctuations, given that their effects are mediated by intricate interactions involving water availability, agronomic practices, and crop physiological responses.
For the WRSI (Fig. 7c), a moderate positive trend was observed, with an upward regression line and a higher concentration of data points at elevated WRSI values (0.95–1.00), which were associated with higher yields and indicating that most of growing seasons are under a good WRSI. The shaded area represents the 95% confidence interval, indicating consistency in the direction of the relationship despite residual dispersion. Statistically, the model yielded an R² value of 0.085 and p = 0.0945, suggesting that 8.5% of the variability in corrected yield can be explained by WRSI. This relationship approaches statistical significance (p < 0.10), although it does not reach the conventional 5% threshold.
The contrasting performance between isolated climatic variables and composite indices highlights the importance of using integrated indicators, such as the WRSI, in predictive models, agricultural zoning, and climate early-warning systems (Debiasi et al., 2022; Rodrigues et al., 2023). Such indices simultaneously incorporate precipitation, temperature, solar radiation, wind, and evapotranspiration, providing a more realistic representation of soil–plant water balance. These results indicate that effective water availability is the main climatic constraint on soybean yield in the region, particularly under interannual variability and ongoing changes in the regional water balance.
Overall, the findings corroborate evidence that soybean yield in the Brazilian Cerrado is more strongly dependent on climatic synchronisation among radiation, temperature, and water availability than on isolated variables, reinforcing the need for integrated approaches in crop modelling and agricultural zoning (Battisti et al., 2018).
The Pearson correlation matrix (Fig. 8) presents the linear relationships between corrected soybean yield in the study area (YIELD_SW) and three climatic indicators calculated over the standardised 120-day growing cycle beginning on 15 October: accumulated precipitation (PREC_120), accumulated growing degree days (GDD_120), and the Water Requirement Satisfaction Index (WRSI_120).
YIELD_SW showed a weak but consistent positive correlation with WRSI_120 (r = 0.29). Because this is a simple bivariate relationship, the squared Pearson correlation coefficient is consistent with the coefficient of determination reported for the WRSI–yield regression in Fig. 7 (R² = 0.085), indicating that WRSI_120 explains approximately 8.5% of the interannual variability in corrected yield. Although this was the highest association among the climatic indicators tested, its explanatory power remains modest, and most yield variability was not explained by the analysed variables. In contrast, YIELD_SW showed no significant association with PREC_120 or GDD_120, suggesting that integrated water-balance conditions are more informative than precipitation or thermal accumulation alone, while other factors such as rainfall timing, cultivar characteristics, soil conditions and crop management also influence yield.
The moderate negative correlation between GDD_120 and WRSI_120 (r = −0.59) further indicates that higher thermal accumulation is associated with reduced water availability, likely due to increased evapotranspiration. Thus, WRSI_120 was the most informative climatic indicator among those tested, although its low explanatory power reinforces its interpretation as a complementary rather than standalone predictor of soybean yield. This pattern confirms the greater sensitivity of soybean to water limitation compared with other individual climatic variables, in agreement with results reported for the Cerrado and the MATOPIBA region (Santos et al., 2021).
Fig. 9 illustrates the performance of each harvest relative to the overall mean of the series. Although an upward trend in yield is observed over the period, there remains a persistent alternation between years above and below the mean, occurring with approximately balanced frequency. Of the 34 harvests analyzed, 20 exhibited yield above the mean (blue bars), while 14 fell below it (orange bars). This near-symmetrical distribution reflects the climatic variability that characterizes the region.
Periods of greater instability are particularly evident, such as the sequence of three consecutive harvests below the mean between 2013/14 and 2015/16, coinciding with episodes of severe water deficit. During these seasons, accumulated precipitation ranged from 575 mm to 767 mm, corresponding to reductions of approximately 7% to 30% relative to the historical average of 826 mm. Yield recovered markedly in 2017/18 and 2022/23, both associated with more favorable climatic conditions. The occurrence of extreme years, such as 2002/03 (the highest yield in the series) and 2014/15 (the lowest), reinforces that, although the overall trend is positive, production uncertainty remains high, thereby requiring more adaptive crop management and climate risk management strategies (Fernandes et al., 2022).
The decade-adjusted yield analysis (Fig. 10) revealed that, despite a continuous increase in gross yield, the residual yield after removing technological effects remained statistically stable between 1990 and 2020, with median values ranging from 3,550 to 3,720 kg ha⁻¹, indicating no significant gains linked to climatic adaptation. The 1990s were marked by lower yields and moderate variability, reflecting the early phase of soybean expansion and limited technological stability. In contrast, the 2000s exhibited greater dispersion, with yields ranging from 3,300 to 3,900 kg ha⁻¹, suggesting increased exposure to interannual climatic variability and greater heterogeneity among production systems. Thus, the stability of residual yield despite the declining WRSI suggests that technological advances, improved management, and cultivar adaptation may have partially buffered the effects of increasing hydrological stress, which is reflected more in interannual variability than in a consistent decline in detrended yield.
In contrast, the 2010s exhibited lower variability and a median yield of approximately 3,580 kg ha⁻¹, indicating greater production stability and suggesting a positive effect of technological progress, improved management practices, and the adoption of cultivars better adapted to regional edaphoclimatic conditions (Rodrigues et al., 2023; Silva et al., 2023). However, the 2020s (2020/21–2022/23) showed a renewed increase in yield dispersion, with contrasting seasons such as 2020/21, characterised by severe water deficit and below-average productivity, and 2022/23, associated with favourable conditions and peak yield (3,900 kg ha⁻¹). This pattern points to a resurgence of climatic variability and reinforces that, despite technological advances, soybean yield stability in the region remains strongly dependent on interannual meteorological conditions (Santos et al., 2021).
(a)
(b)
(c)
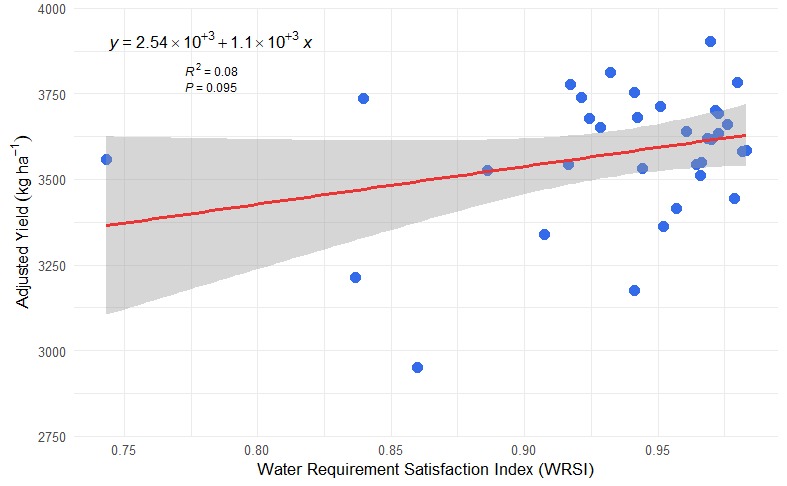
Fig. 7. Relationship between corrected soybean yield and (a) accumulated precipitation, (b) accumulated growing degree days (GDD) and (c) WRSI over the 120-day crop growth cycle.
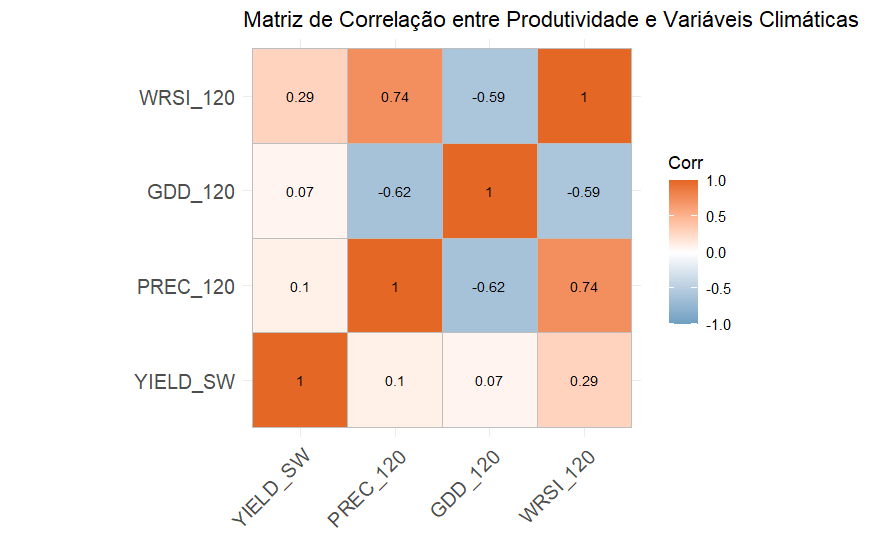
Fig. 8. Pearson correlation matrix between corrected soybean yield (YIELD_SW: corrected soybean yield in south-western Goiás) and climatic indicators over the 120-day soybean growing cycle (1989/90–2022/23): accumulated precipitation (PREC_120), accumulated growing degree days (GDD_120), and Water Requirement Satisfaction Index (WRSI_120). The matrix shows that WRSI_120 had the strongest, although weak, positive association with yield.
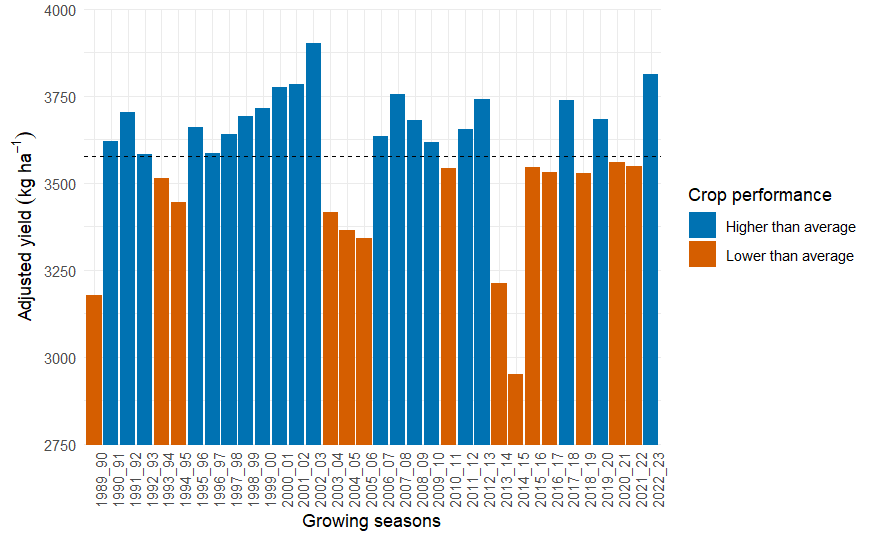
Fig. 9. Annual soybean yield (kg ha⁻¹) compared with the historical mean (1989/90–2022/23), showing alternating above- and below-average seasons and persistent interannual yield variability.
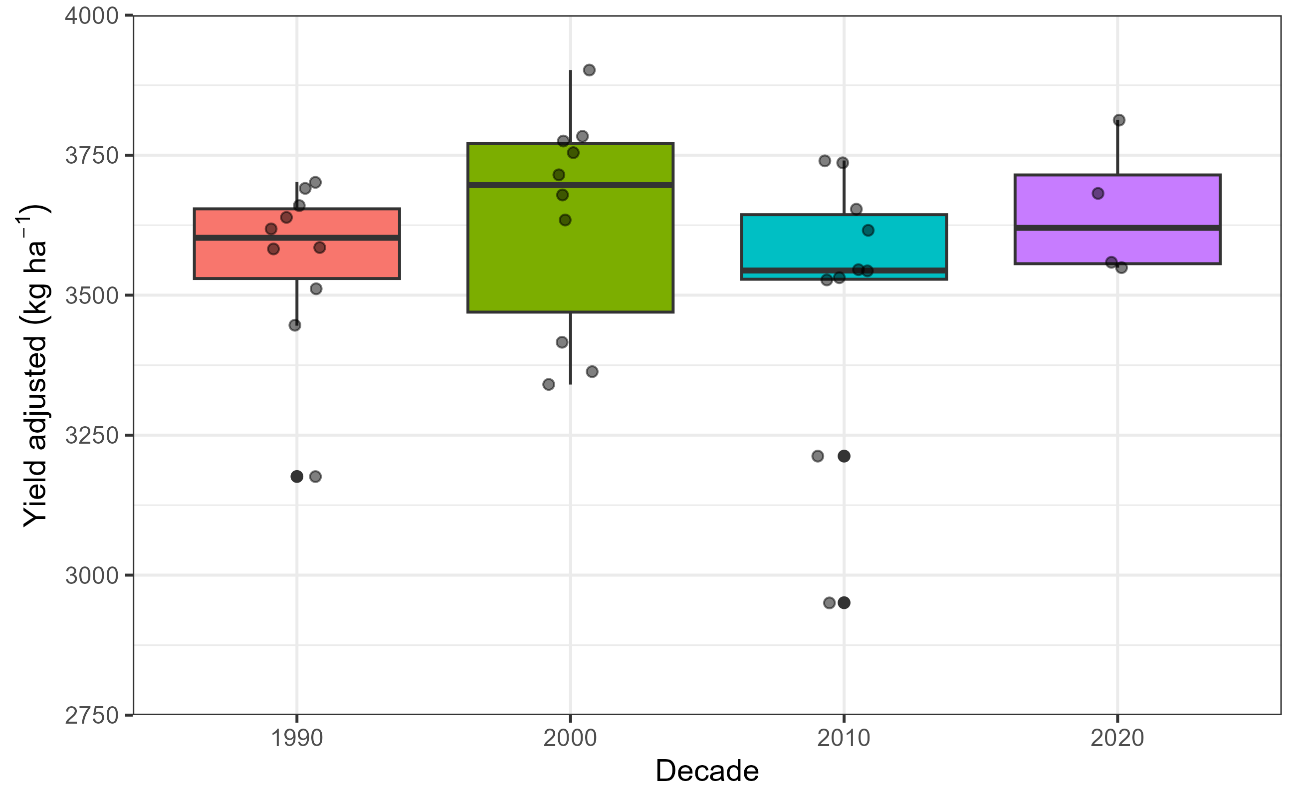
Fig. 10. Distribution of corrected soybean yield (kg ha⁻¹) grouped by decade, showing relative stability in detrended yield despite changes in climatic conditions. The decade groups comprise the following crop seasons: 1990s = 1989/90–1999/00; 2000s = 2000/01–2009/10; 2010s = 2010/11–2019/20; and 2020s = 2020/21–2022/23.
The research was conducted in soybean (Glycine max L.) cultivated areas within the Brazilian Cerrado (Savanna biome), located in the south-western region of the state of Goiás. The study area comprises 18 municipalities, situated between the geographical coordinates 16°50′ S, 50°50′ W and 18°50′ S, 53°30′ W (Fig. 11). According to the Köppen–Geiger climate classification, the region has a tropical savanna climate (Aw), characterized by an annual average precipitation ranging from 1,500 mm to 1,750 mm and an average altitude of approximately 700 m (Alvares et al., 2013)
The climatic data used in this study were obtained from the NASA POWER platform, which provides daily estimates based on remote sensing with global coverage and a spatial resolution of approximately 0.5° latitude/longitude. The following climatic variables were collected: daily precipitation (mm), and mean, maximum and minimum air temperatures (°C), in addition to auxiliary data for the calculation of climatic indices, including daily evapotranspiration, relative humidity, solar radiation and wind speed. The information was extracted for the period from 1989/90 to the 2022/23 harvests and organised according to the soybean growing seasons in the study area, spanning the months of October to March.
The climate variables were extracted from the grid cell, with values representing spatially averaged estimates derived from the MERRA-2 atmospheric reanalysis rather than in situ meteorological observations. The municipalities included in the analysis were: Acreúna, Aparecida do Rio Doce, Aporé, Cachoeira Alta, Caçu, Castelândia, Chapadão do Céu, Jataí, Maurilândia, Mineiros, Montividiu, Perolândia, Portelândia, Rio Verde, Santa Helena de Goiás, Santa Rita do Araguaia, Santo Antônio da Barra and Serranópolis. Soybean yield data were obtained at the municipal level from IBGE and aggregated by calculating the annual mean yield across these municipalities for each crop year, ensuring spatial consistency between yield and climate datasets.
A representative 120-day crop cycle, sowing on 15 October, was adopted for agrometeorological analyses, consistent with the typical sowing period and cycle based on rainfall pattern in the region (Embrapa, 2011). This interval encompassed the full phenological development from sowing to physiological maturity and enabled the calculation of thermal and hydrological indicators, ensuring temporal consistency across seasons. Although the dataset spanned from October to March, analyses were standardised within this defined cycle to ensure comparability. Data were subsequently aggregated into monthly means and crop-year averages, facilitating the identification of persistent climatic patterns, anomalies, and long-term trends.
Water Requirement Satisfaction Index (WRSI) was calculated as the ratio between actual crop evapotranspiration (ETa) and potential crop evapotranspiration (ETp). ETp was obtained multiplying reference evapotranspiration (ETo), estimated using the Penman–Monteith method (Pilau et al., 2012), by crop coefficient from FAO-56 guidelines (Allen et al., 1998), being 0.4 from sowing to the first fully developed trifoliolate leaf, increasing to 1.15 by the beginning of seed development, remaining at its maximum until the full seed stage, and then decreasing to 0.5 at full maturity. ETa was quantified by using water balance approach from Thornthwaite and Mather (1955), using a maximum root depth of 74 cm (Sentelhas et al., 2015), resulting in a total soil water holding capacity of 100 mm (Teixeira et al., 2019).
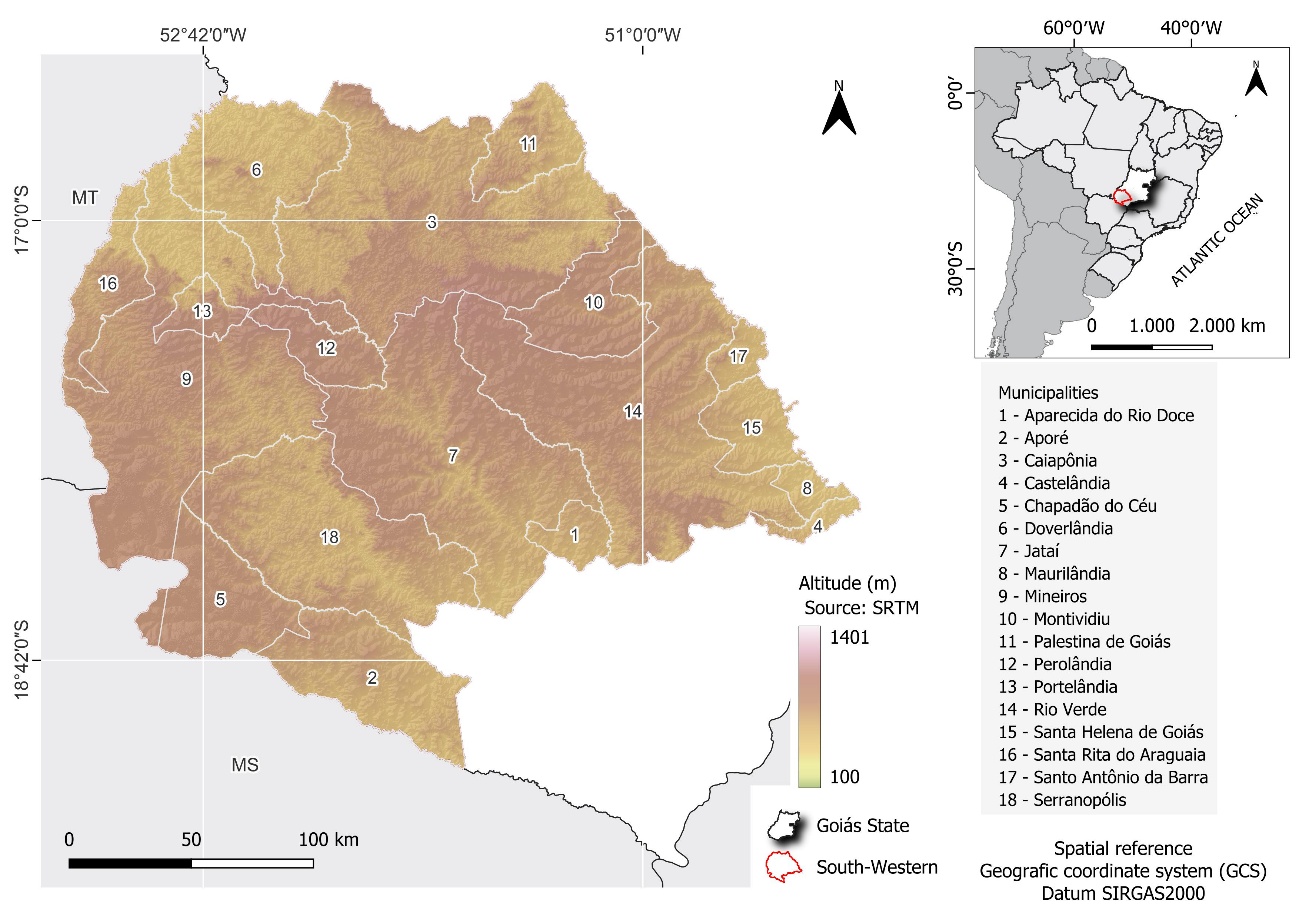
Fig. 11. Geographical location of the municipalities in south-western Goiás, Brazil.
Thermal accumulation, expressed as GDD, was calculated using a base temperature of 13 °C, recognised as the lower threshold for the induction and progression of the soybean reproductive phase (Embrapa, 2011). This index represents the effective thermal time required to complete the crop cycle and enables assessment of the influence of regional thermal variability on phenological development across seasons. Quantitative and spatio-temporal data on soybean production were obtained from IBGE (2024) and MapBiomas (2025).
The data were subjected to simple linear regression analysis to quantify the relationships between basic and derived climatic variables and soybean yield. Simple regressions were employed to assess the isolated effect of each climatic variable. In addition, Pearson’s correlation coefficient was used to measure the strength and direction of these associations across growing seasons, contributing to the identification of periods most sensitive to climatic variability.
Data analysis was performed using R software (version 4.5.1). The results were presented through scatter plots, boxplots, and time series to facilitate the visualization of trends, patterns, and extreme events. Descriptive statistics were calculated, including means, coefficients of determination (R²), and significance values (p < 0.05). This integrated approach enabled not only the quantification of the influence of climate variability on soybean yield in the study area, but also the generation of technical support for the formulation of adaptive strategies aimed at local farmers, particularly in a context of increasing climatic uncertainty.
Soybean yield increased over time despite a decline in precipitation and an increase in growing degree days, suggesting that technological advances and improved crop management have enhanced the resilience of soybean production to progressively warmer and drier conditions. Although precipitation decreased and thermal accumulation increased throughout the study period, the relatively stable climatic conditions of the region, when consider soybean requirements, likely reduced the magnitude of climate-induced yield variability. Consequently, the Water Requirement Satisfaction Index (WRSI) explained only a small proportion of the corrected yield variability, indicating that effective water availability influences soybean productivity but is not the primary determinant of yield in this environment. Therefore, WRSI should be considered a complementary indicator for assessing climate effects on soybean yield, while technological progress and management improvements remain the main drivers of long-term productivity gains.
The authors declare no conflict of interest.
da Silva GS (original draft); Battisti R (original draft and resources); Silva DA (resources); Andrade RR (review and editing); Mesquita M (formal analysis); Ciappina AH (review and editing); Cardoso VP (formal analysis) and Moreira ANH (original draft and supervision).
The authors used ChatGPT (OpenAI, San Francisco, CA, USA) and Microsoft Copilot (Microsoft Corporation, Redmond, WA, USA) to assist with language editing, grammar correction, and improvement of the manuscript's readability.
Allen RG, Pereira LS, Raes D, Smith M (1998) Crop evapotranspiration: Guidelines for computing crop water requirements. FAO Irrigation and Drainage Paper 56. FAO, Rome. 300 pp.
Alvares CA, Stape JL, Sentelhas PC, Gonçalves JLM, Sparovek G (2013) Köppen’s climate classification map for Brazil. Meteorol Z. 22(6): 711–728. https://doi.org/10.1127/0941-2948/2013/0507
Baioco RA, Orben JMC, Pereira JR, Esser JV, Santos RF (2023) Impacto da estiagem sobre a safra de soja 2021/22 no núcleo regional de Cascavel. Int J Environ Resil Res Sci. 5(1): 1–11. https://doi.org/10.48075/ijerrs.v5i1.30572
Battisti R, Sentelhas PC (2014) New agroclimatic approach for soybean sowing dates recommendation: A case study. Rev Bras Eng Agric Ambient. 18(11): 1149–1156. https://doi.org/10.1590/1807-1929/agriambi.v18n11p1149-1156
Battisti R, Sentelhas PC, Boote KJ (2018) Sensitivity and requirement of improvements of four soybean crop simulation models for climate change studies in southern Brazil. Int J Biometeorol. 62(5): 823–832. https://doi.org/10.1007/s00484-017-1483-1
Battisti R, da Silva OCC, Knapp FM, Alves Júnior J, Mesquita M, Monteiro LA (2024) Assessment of the reliability to use NASAPOWER gridded weather applied to irrigation planning and management in Brazil. Theor Appl Climatol. 155: 8287–8297. https://doi.org/10.1007/s00704-024-05113-3
Battisti R, Dapper FP, da Silva ACS, Mesquita M, da Silva MV, Andrade RR, Lopes AGC (2025) Assessing precipitation trends between 1960 and 2021 using multiple trend indexes in Goiás State and Federal District, Brazil. Int J Climatol. 45: e8750. https://doi.org/10.1002/joc.8750
Brignoli FM, Geraldini APB, Tormena CA, Araújo MA, Batista MA (2024) Liming and phosphate fertilization influence soil fertility, physical properties, and carbon stock in a subtropical Ferralsol in Brazil. Soil Tillage Res. 244: 106268. https://doi.org/10.1016/j.still.2024.106268
Caetano JM, Tessarolo G, de Oliveira G, Souza KS, Diniz-Filho JAF, Nabout JC (2018) Geographical patterns in climate and agricultural technology drive soybean productivity in Brazil. PLoS One. 13(1): e0191273. https://doi.org/10.1371/journal.pone.0191273
CONAB – Companhia Nacional de Abastecimento (2025) Produção de grãos atinge 350,2 milhões de toneladas colhidas na safra 2024/25. Available at: https://www.gov.br/conab/pt-br/assuntos/noticias/producao-de-graos-atinge-novo-recorde-com-350-2-milhoes-de-toneladas-colhidas-na-safra-2024-25 (accessed 26 February 2025).
Corbellini M, Bobek DV, Toledo JFF, Ferreira LU, Santana DC, Gilio TAS, Ribeiro LP, Teodoro PE, Tardin FD (2024) Geographical adaptability for optimizing the recommendation of soybean cultivars in the Brazilian Cerrado. Sci Rep. 14: 13076. https://doi.org/10.1038/s41598-024-63809-y
da Silva NF, Cunha FN, de Oliveira RC, Cabral Filho FR, Teixeira MB, de Carvalho JJ (2014) Características físico-hídricas de um Latossolo sob diferentes sistemas de manejo. Rev Bras Agric Irrig. 8(5): 375–390. https://doi.org/10.7127/rbai.v8n500245
Debiasi H, Monteiro JEBA, Franchini JC, Farias JRB, Conte O, Cunha GR, Moraes MT, Balbinot Junior AA, Silva FAM, Evangelista BA, Marafon AC (2022) Níveis de manejo do solo para avaliação de riscos climáticos na cultura da soja. Embrapa Soja, Londrina. Documentos 447. Available at: https://ainfo.cnptia.embrapa.br/digital/bitstream/doc/1148652/1/DOCUMENTO-447-final.pdf (accessed 26 October 2025).
de Oliveira VA, Santos GG, Ker JC, Couto EG, Jacomine PK, Corrêa GR, Curi N, Schaefer CEGR (2023) Soils of Cerrados, the Brazilian savannas. In: Schaefer CEGR (ed) The soils of Brazil. World Soils Book Series. Springer, Cham, pp 129–173. https://doi.org/10.1007/978-3-031-19949-3_5
dos Santos TL, Battisti R, Reichardt K, Gonçalves IZ, Amaral VPD, Pilau FG (2025) Why should space-time variability of rainfall be considered in precision agriculture for soybean in Piracicaba, São Paulo state? Sci Agric. 82: e20240202. https://doi.org/10.1590/1678-992X-2024-0202
Embrapa – Empresa Brasileira de Pesquisa Agropecuária (2011) Tecnologias de produção de soja – Região Central do Brasil 2012 e 2013. Embrapa Soja, Londrina. Sistemas de Produção 15.
FAEG – Federação da Agricultura e Pecuária de Goiás (2023) Calor excessivo preocupa produtores de soja. Available at: https://sistemafaeg.com.br/noticias/calor-excessivo-preocupa-produtores-de-soja (accessed 27 March 2024).
Fernandes RDM, de Melo DM, Elli EF, Battisti R (2022) Climate change impacts on rainfed and irrigated soybean yield in Brazil’s new agricultural frontier. Theor Appl Climatol. 147: 803–816. https://doi.org/10.1007/s00704-021-03865-w
Friedrich ED, Tagliapietra EL, Richter GL, Bexaira KP, Streck NA, Zanon AJ (2023) Sowing date and maturity group in soybean grown in lowlands. Rev Ceres. 70(2): 64–72. https://doi.org/10.1590/0034-737X202370020008
Hungria M, Nogueira MA, Araujo RS (2013) Co-inoculation of soybeans and common beans with rhizobia and azospirilla: strategies to improve sustainability. Biol Fertil Soils. 49(7): 791–801. https://doi.org/10.1007/s00374-012-0771-5
IBGE – Instituto Brasileiro de Geografia e Estatística (2022) Produção Agrícola Municipal: Culturas Temporárias e Permanentes 2022. Available at: https://www.ibge.gov.br/estatisticas/economicas/agricultura-e-pecuaria/9117-producao-agricola-municipal-culturas-temporarias-e-permanentes.html?edicao=37886&t=resultados (accessed 22 January 2024).
IBGE – Instituto Brasileiro de Geografia e Estatística (2024) Rio Verde. Available at: https://cidades.ibge.gov.br/brasil/go/rio-verde/pesquisa/24/76693 (accessed 22 April 2024).
Lisbinski FC (2025) Variabilidade climática na produção de milho, trigo e soja. Rev Polit Agric. 33: e01974. https://doi.org/10.35977/2317-224X.rpa2024.v33.01974
MapBiomas (2025) MapBiomas Collection 9 of Brazilian land cover and land use map series. Available at: https://plataforma.brasil.mapbiomas.org/agriculture/agriculture_agricultural_use (accessed 26 January 2025).
Monaco H, Colussi J, Schnitkey G (2025) Brazil’s agricultural expansion: Where are soybean yields headed? farmdoc daily. 15: 33. https://farmdocdaily.illinois.edu/2025/02/brazils-agricultural-expansion-where-are-soybean-yields-headed.html
Monteiro LA, Sentelhas PC, Pedra GU (2018) Assessment of NASA/POWER satellite‐based weather system for Brazilian conditions and its impact on sugarcane yield simulation. Int J Climatol. 38(3): 1571–1581. https://doi.org/10.1002/joc.5282
Moreira ANH, Ciappina AH, Andrade RR, Casaroli D, Rossi G, Conti L, Bambi G (2025a) Temporal analysis of pasture vegetation cover in central-western Brazil using remote sensing. Agron Res. 23(S1): 151–163. https://doi.org/10.15159/AR.25.024
Moreira ANH, Casaroli D, Andrade RR, Battisti R, Ciappina AH (2025b) Using geospatial analysis to detect soil loss in pasture in the Brazilian Savanna (Cerrado). Aust J Crop Sci. 19(5): 567–576. https://doi.org/10.21475/ajcs.25.19.05.p324
NASA – National Aeronautics and Space Administration (2024) Prediction of Worldwide Energy Resources (POWER). NASA Langley Research Center. Available at: https://power.larc.nasa.gov/data-access-viewer/ (accessed 21 March 2025).
Nenwala VH, Knops C, Njouenwet I, Leblois A, Gonne S, Doua SA, Lavarenne J (2025) Spatiotemporal relationships between rainfall indices and crop yields in the Sudano-Sahelian zone of Cameroon. Theor Appl Climatol. 156: 469. https://doi.org/10.1007/s00704-025-05603-y
Pilau FG, Battisti R, Somavilla L, Righi EZ (2012) Desempenho de métodos de estimativa da evapotranspiração de referência nas localidades de Frederico Westphalen e Palmeira das Missões, RS. Cienc Rural. 42(2): 283–290. https://doi.org/10.1590/S0103-84782012000200016
Reis L, Santos e Silva CM, Bezerra B, Mutti P, Spyrides MH, Silva P, Andrade L (2020) Influence of climate variability on soybean yield in MATOPIBA, Brazil. Atmosphere. 11(10): 1130. https://doi.org/10.3390/atmos11101130
Rodrigues SA, Peiter MX, Robaina AD, Bruning J, Ferreira LD, Chaiben Neto M (2023) Different water availability in the economic water productivity in soybean cultivars. Rev Ceres. 70(1): 1–10. https://doi.org/10.1590/0034-737X202370010001
Santos EF, Santos MP, Silva RA, Marques LM, Battisti R (2026) Soybean yield gap in integrated crop-forest, conventional, and no-tillage systems in sandy soil. Pesqui Agropecu Trop. 56: e84404. https://doi.org/10.1590/1983-40632026v5684404
Santos HG, Jacomine PKT, Anjos LHC, Oliveira VA, Lumbreras JF, Coelho MR, Almeida JA, Araújo Filho JC, Lima HN, Marques FA, Oliveira JB, Cunha TJF (2025) Sistema brasileiro de classificação de solos. 6th edn, rev. and expanded. Embrapa, Brasília.
Santos TG, Battisti R, Casaroli D, Alves Júnior J, Evangelista AWP (2021) Assessment of agricultural efficiency and yield gap for soybean in the Brazilian Central Cerrado biome. Bragantia. 80: e1821. https://doi.org/10.1590/1678-4499.20200352
Sentelhas PC, Battisti R, Câmara GMS, Farias JRB, Hampf AC, Nendel C (2015) The soybean yield gap in Brazil: Magnitude, causes and possible solutions for sustainable production. J Agric Sci. 153(8): 1394–1411. https://doi.org/10.1017/S0021859615000313
Silva DS, Arima EY, dos Reis TN, Rattis L (2023) Temperature effect on Brazilian soybean yields, and farmers’ responses. Int J Agric Sustain. 21(1): 2173370. https://doi.org/10.1080/14735903.2023.2173370
Soares KWS, Battisti R, Dapper FP, Carvalho APM, Silva MV, Silva JLB, de Oliveira HFE, Mesquita M (2025) Shifting climate patterns in the Brazilian Savanna evidenced by the Köppen classification and drought indices. Atmosphere. 16(7): 849. https://doi.org/10.3390/atmos16070849
Teixeira WWR, Battisti R, Sentelhas PC, de Moraes MF, de Oliveira Junior A (2019) Uncertainty assessment of soya bean yield gaps using DSSAT-CSM-CROPGRO-Soybean calibrated by cultivar maturity groups. J Agron Crop Sci. 205: 533–544. https://doi.org/10.1111/jac.12343
Thornthwaite CW, Mather JR (1955) The water balance. Publ Climatol. 8(1): 1–104.
Wen H, Wu T, Jia H, Song W, Xu C, Han T, Wu C (2022) Analysis of relationship between soybean relative maturity group, crop heat units and ≥ 10 °C active accumulated temperature. Agronomy. 12(6): 1444. https://doi.org/10.3390/agronomy12061444
WRB – IUSS Working Group WRB (2022) World reference base for soil resources: International soil classification system for naming soils and creating legends for soil maps, 4th edn. International Union of Soil Sciences, Vienna.