Australian Journal of Crop Science
Article | https://doi.org/10.21475/ajcs.26.20.06.pne190
Submitted: 18 November 2025 | Revised: 25 April 2026 | Accepted: 28 April 2026
Pages 477-485
Phenological stages, growth, and production of sorghum (Sorghum bicolor L.) across different locations and altitudes: Implications for climate change adaptation
Tumiar Katarina Manik*, Paul Benyamin Timotiwu
Graduate Study of Agronomy, Faculty of Agriculture, University of Lampung, Indonesia
*Corresponding author: tumiar.katarina@fp.unila.ac.id
ORCID ID 0000-0001-9424-7327
Abstract: Plant phenology, generally defined as the phasic process of the plant cycle, is the physiological development stages of crop growth from planting to harvest. Climate change, indicated by rising temperature, causes a shift in phenological development of crops. This study investigated how sorghum phenology changed when planted in the highland area (Gisting, Lampung, 615 m asl) and the lowland area (Rajabasa, Lampung 120 m asl). Eight sorghum genotypes were planted in both areas, and the days to reach each growth step were observed together with the calculated growing degree days and agronomic variables. The result showed that sorghum in the lowland area reached growth stages faster than sorghum in the highland area. The physiological maturity occurred 79.63 days in the lowland area while in the highland it was 86.71 days. The heat (growing degree days) needed for reaching the stage was 2581 degrees in the lowland and 2357.88 degrees in the highland areas. Sorghum is higher in the lowland area (265 cm) compared to the highland area (212 cm). Some other agronomic variables comparing lowland and highland areas, respectively, were: panicle length 26.65 cm to 26.37 cm; average above part biomass fresh weight per plant 580.4 g to 638.06 g; 1000 grain fresh weight 141.77 g compared to 104.94 g and dry weight 39.23 g to 30.04 g; Lipid 2.63% compared to 1.16 % and protein 11.01% compared to 9.47%. From those results, it can be concluded that sorghum is one choice for food security in the predicted higher temperatures because of climate change, since sorghum grows better in warm temperatures.
Keywords: Sorghum, crops phenology, growing degree days, Lampung, climate change.
Abbreviations: GDD_growing Degree Days.
Introduction
Indonesia considers sorghum as an alternative food source to strengthen the nation's food security. It is predicted that in 2035 Indonesia's population will reach 400 million; by which the Indonesian government should find an alternative for the staple food besides rice, and sorghum (Sorghum bicolor (L. Moench) is the potential crop. Up to June 2022, the planting area for sorghum was 4.355 ha, with a productivity 3,63 ton/ha. Sorghum could also replace wheat needs for Indonesia since nine countries have banned wheat export due to some international conflicts. Indonesian government road map for sorghum up to 2024 was to reach 40000 ha planting area distributed in 17 provinces with the production of 154,464 tons with productivity of 4 tons/ha (Sidqi and Aulia, 2025).
To make the sorghum cultivation successful in Indonesia, it is necessary to conduct a study about the adaptability of sorghum to Indonesia's climate, especially as we face climate change. Will sorghum planting areas match the Indonesian government’s sorghum cultivation road map? Even though sorghum is adaptive to a wide environment, drought stress significantly lowers its productivity. Local and regional climatic conditions are a primary determinant of agronomic crop productivity since plant metabolic processes are controlled by weather variables like maximum and minimum temperature, solar radiation, carbon dioxide concentration, and availability of water. Climate change can greatly influence overall food security by influencing cereal crop phenology and changing the spatial allocation of crops (Wang et al., 2017; Abreha et al., 2022).
Plant phenology, generally defined as the phasic process of plant cycle, plant timeline activities or periodic life-cycle events, physiological development stages of crop growth from planting to harvest (Fatima et al., 2020; Tan et al., 2021; Gao and Zhang, 2021; Xiao et al., 2021; Longchamps and Philpot, 2023). Crop phenology determines the timing and duration of critical periods for growth, which is important for plant survival and reproduction and eventually affect the harvestable yield and food quality strongly controlled by short- and long-term variability in weather and climate (Zao et.al, 2019; Xiao et al., 2021). Since a warmer climate will shift in crop phenology, quantitatively assessing the shift in crop phenology caused by climate change can be a basis for climate change adaptation strategies in agricultural production.
Moreover, phenological shifts have been among the strongest biological indicators of climate change since phenology reflects changes in the environment through the response of plants to meteorological elements. Therefore, investigations of the spatiotemporal changes in crop phenology and the relationships between phenology and climate change are important for understanding the processes and mechanisms underlying crop responses and adaptations to agro-meteorological stressors and ongoing climate change (Babálová et al., 2018). The dynamics of phenological phases as a response to changing environmental conditions had been observed. Many authors (Wang et al., 2017; Vitasse et al., 2011; Chmielewski et al., 2001; Linderholm, 2006; Walther et al., 2002) have monitored ongoing climate changes using phenological manifestations of plants and tree species. Suitable phenological models derived from long-term time series can partially widen the information on biological reactions at various locations, where traditional data are missing. If the successful migration of tree species, e.g., migration of spruce in a changing environment, is ensured, phenological knowledge can also be combined with systematic genetic assessment that governs the adaptive capacity of forests to climate change (Škvareninová and Mrekaj , 2022).
Crops phenology has also been studied in cereal crops. Cereal crop phenology is very sensitive to climate change compared to other agronomic crops. Three typical crops (maize, rice, and soybean) and their response to climate change had been investigated through shifts in phenology in Northeast China (Linderholm, 2006). Wheat, rice, and maize are important cereal crops in most countries. The highest days to wheat flowering and maturity were observed varied among planting areas, which might be due to variability in climatic conditions during the wheat growing cycle. In rice, transplanting to maturity was more severely reduced than other phenological phases, while in maize, phenological stages of maize were delayed in most countries (Fatima et al., 2020). In sorghum, the optimum time of sowing is one of the important technologies that allow the crop to better utilise natural resources to maximise productivity. It is crucial to select the optimum time of sowing that provides ideal growing conditions to obtain the maximum sorghum yield (Ammaiyappanet al.,2023).
Tropical plants' phenology remains poorly understood. Often, the tropical plants are assumed to have similar strength responses to temperature changes as the horticulture plants in high latitude climates. Davies et al. (2022) argued that applying the temperate phenological paradigm to tropical species and communities requires more detailed process assessment that influences tropical phenology. Sakai and Kitajima (2019) added that tropical climate lacked a cool season which restricts growth, different from temperate climates. In tropical plants, phenological cycles range from species that reproduce several times a year to those that reproduce only once over several years. Consequently, tropical phenology shows considerable diversity. It is interesting to investigate whether phenology is observed in food crops (sorghum) in tropical climates.
The purpose of this study was to examine the effects of field air temperature on sorghum growth, phenology, and yield as the primary objective. It also aimed to assess the potential impacts of climate change on sorghum cultivation and to evaluate sorghum’s suitability as a future crop in Indonesia.
Results
Crops climate environment
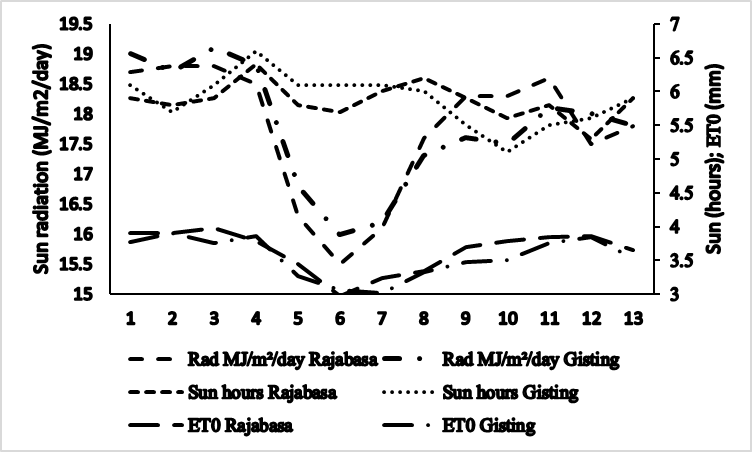
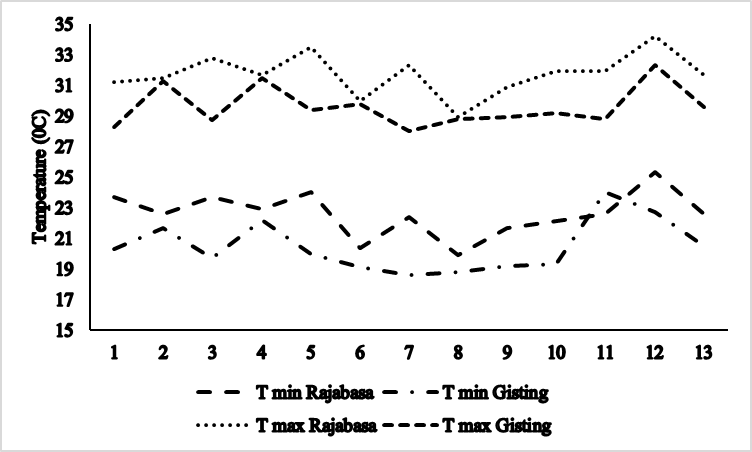
Using data from the field and the CROPWAT program, the local climate is presented in Table 1. The lowland area had higher temperatures both the maximum (31.7oC compared to 29oC) and the minimum (22.6oC compared to 20.5oC). The radiation and sunshine hours were about the same resulted in about the same height of evaporation (3.65 mm compared to 3.54 mm). So, the main difference between the highland and the lowland was the temperature. Another difference between the high land and lowland was the amount of rainfall. Affected by orographic rain, highland is common to experience higher rainfall. Sorghum was planted in the transition season, the lowland area still needs total irrigation of about 92.9 mm, while in highland area need lower compared to lowland area, which was about 35.8 mm.
Soil texture of the lowland area contained: sand 52. 8 %, dust 26.0 %, and clay 21.2 %. At 10 cm soil depth, the field capacity was 20.35 %, the permanent wilting point was 10.06 %, and the permeability was 2.35 cm/hour. At 20 cm soil depth, the field capacity was 20.23 %, permanent wilting point was 8.89 %, and the permeability was 1.02 cm/hour. At 30 cm soil depth, the field capacity was 21.92 %, the permanent wilting point was 9.38 %, and the permeability was 1.21 cm/hour. Soil chemistry contained: Nitrogen (N-Total) 0.373 %, P-available 186.38 ppm, C-organic 1.35 %, Potassium (K2O) 17.82 mg/100g, and pH 5.5.
Soil texture of the highland area contained: sand 39.2 %, dust 43.2 %, and clay 17.6 %. At 10 cm soil depth, the field capacity was 22.43 %, the permanent wilting point was 13.62 %, and the permeability was 1.44 cm/hour. At 20 cm soil depth, the field capacity was 21 %, the permanent wilting point was 13.58 %, and the permeability was 0.78 cm/hour.
Table 1. Local climate in both of the field areas, Rajabasa (lowland) and Gisting (highland).
| Month | Min Temp oC | Max Temp oC | Sun hours | Radiation (MJm2/day) | Eto (mm) |
|||||||||
|---|---|---|---|---|---|---|---|---|---|---|---|---|---|---|
Raja basa |
Gisting | Raja basa |
Gisting | Raja basa |
Gisting | Raja basa |
Gisting | Raja basa |
Gisting | |||||
| January | 23.7 | 20.3 | 31.2 | 28.3 | 5.9 | 6.1 | 18.7 | 19 | 3.91 | 3.77 | ||||
| February | 22.6 | 21.7 | 31.5 | 31.3 | 5.8 | 5.7 | 18.8 | 18.7 | 3.9 | 3.9 | ||||
| March | 23.7 | 19.7 | 32.8 | 28.7 | 5.9 | 6.1 | 18.8 | 19.1 | 3.98 | 3.75 | ||||
| April | 22.9 | 22.2 | 31.7 | 31.5 | 6.4 | 6.6 | 18.5 | 18.8 | 3.78 | 3.86 | ||||
| May | 24 | 20 | 33.5 | 29.4 | 5.8 | 6.1 | 16.3 | 16.8 | 3.44 | 3.27 | ||||
| June | 20.4 | 19.1 | 30 | 29.8 | 5.7 | 6.1 | 15.5 | 16 | 2.97 | 3.06 | ||||
| July | 22.4 | 18.6 | 32.3 | 28 | 6 | 6 | 16.1 | 16.2 | 3.24 | 3.02 | ||||
| August | 19.9 | 18.8 | 28.9 | 28.8 | 6.2 | 5.5 | 17.6 | 17.3 | 3.34 | 3.32 | ||||
| September | 21.7 | 19.2 | 30.9 | 28.9 | 5.9 | 5.1 | 18.3 | 17.6 | 3.69 | 3.47 | ||||
| October | 22.1 | 19.3 | 31.9 | 29.2 | 5.6 | 5.5 | 18.3 | 17.5 | 3.79 | 3.5 | ||||
| November | 22.6 | 24 | 31.9 | 28.8 | 5.8 | 5.6 | 18.6 | 18.1 | 3.85 | 3.75 | ||||
| December | 25.3 | 22.7 | 34.2 | 32.3 | 5.3 | 5.6 | 17.5 | 18 | 3.86 | 3.84 | ||||
| Average | 22.6 | 20.5 | 31.7 | 29.6 | 5.9 | 5.9 | 17.8 | 17.8 | 3.65 | 5.54 | ||||
Figure 1. Description of the local climate of the field area.
At 30 cm soil depth, the field capacity was 24.32 %, permanent wilting point was 13.98 %, and permeability was 0.58 cm/hour. Soil chemistry contained: Nitrogen (N-Total) 1.7 %, P-available 99.96 ppm, C-organic 14.95 %, and pH 6.03.
Growth stages days and cumulative growing degree days
Days to reach stages and the cumulative GDD were presented in Table 2 for Rajabasa and Table 3 for Gisting, and the average comparison of both is in Table 4.
Table 2. Growth stages days and growing degree days of eight local sorghum genotypes planted at Rajabasa (lowland area). The eight local sorghum genotypes were Mandau (M), Telaga Bodas (TB), Numbu (N), Samurai 1 (S1), Kawali (K), Suri (S), Samurai 2 (S2), and Cymit (C).
| Growth Stages Days and GDD | Genotypes | ||||||||
| M | T B | N | S-1 | K | S | S-2 | C | Average | |
| Stage 0 Emergence | 5 | 5 | 4 | 5 | 5 | 5 | 5 | 5 | 4.88 |
| 159.8 | 159.8 | 163.8 | 159.8 | 159.8 | 159.8 | 159.8 | 159.8 | 160.3 | |
| Stage 1, three leaves | 8 | 8 | 7 | 8 | 8 | 8 | 8 | 8 | 7.88 |
| 252.36 | 252.36 | 225.9 | 252.36 | 252.36 | 252.36 | 252.36 | 252.36 | 249.05 | |
| Stage 2, five leaves | 11 | 11 | 10 | 11 | 11 | 11 | 11 | 11 | 10.88 |
| 341.6 | 341.6 | 307.7 | 341.6 | 341.6 | 341.6 | 341.6 | 341.6 | 337.4 | |
| Stage 3, GP differentiation | 14 | 14 | 13 | 14 | 14 | 14 | 15 | 15 | 14.13 |
| 433.2 | 433.2 | 403.7 | 433.2 | 433.2 | 433.2 | 465.4 | 465.4 | 437.6 | |
| Stage 4, Flag leaves | 19 | 19 | 18 | 19 | 19 | 19 | 19 | 19 | 18.88 |
| 588.8 | 588.8 | 558.4 | 588.8 | 588.8 | 588.8 | 588.8 | 588.8 | 585 | |
| Stage 5, boot heading | 24 | 24 | 23 | 24 | 24 | 24 | 24 | 24 | 23.88 |
| 739 | 739 | 710 | 739 | 7389 | 739 | 739 | 739 | 735 | |
| Stage 6, flowering | 26 | 26 | 25 | 26 | 26 | 26 | 26 | 26 | 25.88 |
| 795.8 | 795.8 | 766.3 | 795.8 | 795.8 | 795.8 | 795.8 | 795.8 | 792.1 | |
| Stage 7, soft dough | 63 | 63 | 60 | 63 | 63 | 63 | 63 | 63 | 62.63 |
| 2032.5 | 2032.5 | 1927 | 2032.5 | 2032.5 | 2032.5 | 2032.5 | 2032.5 | 2019.3 | |
| Stage 8, hard dough | 73 | 73 | 70 | 73 | 73 | 73 | 73 | 73 | 72.63 |
| 2373.7 | 2373.7 | 2267.6 | 2373.7 | 2373.7 | 2373.7 | 2373.7 | 2373.7 | 2360.4 | |
| Stage 9, Physiology mature | 80 | 80 | 77 | 80 | 80 | 80 | 80 | 80 | 79.6 |
| 2592.2 | 2592.2 | 2507. | 2592.2 | 2592.2 | 2592.2 | 2592.2 | 2592.2 | 2581.5 | |
Table 3. Growth stages days and growing degree days of eight sorghum local varieties planted at Gisting (highland area).
| Growth Stages Days and GDD | Genotypes | ||||||||
| M | T B | N | S-1 | K | S | S-2 | C | Average | |
| Stage 0 Emergence | 7 | 7 | 6 | 7 | 7 | 7 | 7 | 7 | 6.86 |
| 174.69 | 174.69 | 150.12 | 174.69 | 174.69 | 174.69 | 174.69 | 174.69 | 171.18 | |
| Stage 1, three leaves | 10 | 10 | 9 | 10 | 10 | 10 | 10 | 10 | 9.86 |
| 241.74 | 241.74 | 250.74 | 241.74 | 241.74 | 241.74 | 241.74 | 241.74 | 243.03 | |
| Stage 2, five leaves | 13 | 13 | 12 | 13 | 13 | 13 | 13 | 13 | 12.86 |
| 323.01 | 323.01 | 295.47 | 323.01 | 323.01 | 323.01 | 323.01 | 323.01 | 319.08 | |
| Stage 3, GP differentiation | 15 | 15 | 14 | 15 | 15 | 15 | 15 | 15 | 14.86 |
| 384.93 | 384.93 | 351.99 | 384.93 | 384.93 | 384.93 | 384.93 | 384.93 | 380.22 | |
| Stage 4, Flag leaves | 22 | 22 | 20 | 22 | 22 | 22 | 22 | 22 | 21.71 |
| 601.65 | 601.65 | 536.58 | 601.65 | 601.65 | 601.65 | 601.65 | 601.65 | 592.35 | |
| Stage 5, boot heading | 26 | 26 | 25 | 26 | 26 | 26 | 26 | 26 | 25.86 |
| 728.91 | 728.91 | 696.06 | 728.91 | 728.91 | 728.91 | 728.91 | 728.91 | 724.22 | |
| Stage 6, flowering | 30 | 30 | 29 | 30 | 30 | 30 | 30 | 30 | 29.86 |
| 865.44 | 865.44 | 831.78 | 865.44 | 865.44 | 865.44 | 865.44 | 865.44 | 860.63 | |
| Stage 7, soft dough | 65 | 65 | 63 | 65 | 65 | 65 | 65 | 65 | 64.71 |
| 1875.42 | 1875.42 | 1821.96 | 1875.42 | 1875.42 | 1875.42 | 1875.42 | 1875.42 | 1867.78 | |
| Stage 8, hard dough | 77 | 77 | 75 | 77 | 77 | 77 | 77 | 77 | 76.71 |
| 2118.8 | 218,68 | 2085.1 | 2118.8 | 2118.8 | 2118.8 | 2118.8 | 2118.8 | 2113.2 | |
| Stage 9, Physiology mature | 87 | 87 | 85 | 87 | 87 | 87 | 87 | 87 | 86.71 |
| 2362.1 | 2471 | 2336.6 | 2362.1 | 2362.1 | 2362.1 | 2362.1 | 2362.1 | 2357.9 | |
With about 3oC difference in both maximum and minimum temperature between lowland and highland, the days different in reaching certain stages of the eight sorghum genotypes ranged between 2 to 7 days. The short days (about 2 days) happened during vegetative stages to the beginning of the generative stage (emergence to flowering), while longer days different 4 and 7 days, happened during the final stages toward harvest stages (soft dough to physiological maturation).
Average panicle lengths were about the same for both plants in high or lowlands. However, locations affected both fresh weight and dry weight of 1000 sorghum grains. Grains from sorghum in lowlands were heavier compared from highlands. In addition, Sorghum planted in Rajabasa had higher lipid and protein concentration compared to Sorghum planted in Gisting.
Table 4. Comparison of average cumulative GDD and days to reach each growth stage in the Rajabasa area (lowland) and Gisting (highland) areas.
| Cumulative GDD | Days to reach each growth stage | Daily thermal resources | ||||
| Growth stages | Rajabasa | Gisting | Rajabasa | Gisting | Rajabasa | Gisting |
| Stage 0 Emergence | 160.34 | 171.18 | 4.88 | 6.86 | 32.86 | 24.95 |
| Stage 1, three leaf | 249.0525 | 243.0257 | 7.88 | 9.86 | 31.61 | 24.65 |
| Stage 2, five leaves | 337.3988 | 319.0757 | 10.88 | 12.86 | 31.01 | 24.81 |
| Stage 3, GP differentiation | 437.5463 | 380.2243 | 14.13 | 14.86 | 30.97 | 25.59 |
| Stage 4, Flag leaf | 584.9775 | 592.3543 | 18.88 | 21.71 | 30.98 | 27.28 |
| Stage 5, boot heading | 735.3225 | 724.2171 | 23.88 | 25.86 | 30.79 | 28.01 |
| Stage 6, flowering | 792.09 | 860.6314 | 25.88 | 29.86 | 30.61 | 28.82 |
| Stage 7, soft dough | 2019.274 | 1867.783 | 62.63 | 64.71 | 32.24 | 28.86 |
| Stage 8, hard dough | 2360.396 | 2113.17 | 72.63 | 76.71 | 32.50 | 27.55 |
| Stage 9, Physiology mature | 2581.538 | 2357.88 | 79.63 | 86.71 | 32.42 | 27.19 |
Since plants require a specific amount of heat to develop from one point in their life cycle to another, the local temperature determines how fast a crop reaches growth stages. Lowland areas with higher temperatures resulted in more heat accumulation and faster growth development.
Table 5. Recapitulation of the analysis of the variance of each observation variable.
| No | Variables | analysis of the variance | ||
|---|---|---|---|---|
| effect of locations | effect of varieties | interaction of locations and varieties | ||
| 1 | Plant height | * | * | ns |
| 2 | Number of leaves | * | * | ns |
| 3 | Panicle length | ns | * | ns |
| 4 | Biomass fresh weight | ns | ns | * |
| 5 | Biomass dry weight | ns | ns | * |
| 6 | Fresh weight of 1000 grains | * | * | ns |
| 7 | Dry weight of 1000 grains | * | * | ns |
Effect of treatments on plant growth and yield
Table 5 showed that location significantly affected plant height, number of leaves, fresh and dry weight of 1000 grains and had no significant effect on average panicle length. Last, biomass fresh and dry weight affected by location interacted with sorghum varieties.
Plant height
Sorghum planted in Rajabasa (lowland) was higher compared to sorghum planted in Gisting (highland) in eight observation days.
Table 6. Effect of location on average plant height (cm) of sorghum at 8 observation days after planting.
| Location | Days after planting | |||||||
| 7 | 14 | 21 | 28 | 35 | 40 | 45 | 50 | |
| Rajabasa | 18.7b | 47.6b | 87.8b | 162.b | 168b | 175.7a | 186a | 265b |
| Gisting | 8.1a | 26.3a | 48.3a | 83.7a | 119.a | 167a | 197a | 212a |
| HSD 5% | 4.7 | 6.6 | 14.3 | 30.4 | 35.1 | 43.5 | 36.5 | 26.1 |
| CV | 43.7 | 22.2 | 26.1 | 30.9 | 30.4 | 31.7 | 23.8 | 13.7 |
Leaves numbers
Sorghum planted in Rajabasa (lowland) had more leaves compared to sorghum planted in Gisting (highland) in eight observation days.
Table 7. Effect of location on the average number of leaves (strands) of sorghum at 8 observation times.
| Locations | Days after planting | |||||||
| 7 | 14 | 21 | 28 | 35 | 40 | 45 | 50 | |
| Rajabasa | 3.53b | 5.72b | 7.97 b | 9.91b | 10.8b | 11.51b | 11.81b | 10.38a |
| Gisting | 1.45a | 4.28a | 5.5a | 7.64a | 7.98a | 8.85a | 9.63a | 9.75a |
| HSD 5% | 0.74 | 0.76 | 0.59 | 0.83 | 0.991 | 0.84 | 0.716 | 15.16 |
| CV | 37.16 | 20.77 | 10.99 | 11.8 | 13.16 | 10.3 | 8.27 | 18.78 |
Effect of locations on yield parameters
Table 8 shows effect of locations on different yield and yield component parameters.
Table 8. Effect of location on average yield parameters of 8 sorghum varieties.
| Lotion | Panicle Length. (cm) |
1000 grains fresh weight (g) | 1000 grains dry weight (g) | Lipid (%) | Protein (%) |
|---|---|---|---|---|---|
| Rajabasa | 26.65 a | 141.77 b | 39.23 b | 2.63 | 11.01 |
| Gisting | 26.37 a | 104.94 a | 30.04 a | 2.06 | 9.47 |
| HSD 5% | 2.00 | 10.49 | 4.31 | ||
| CV | 9.44 | 10.61 | 15.53 |
Remarks: For all tables, the average value followed by the same letter is not significantly different according to the Tukey Honest Significant Test (HSD) at a significance level of 0.05.
Table 9. Interaction of location and genotype on average fresh biomass weight (g) of sorghum.
| Location | Genotypes | ||||||||
| M | T B | N | S-1 | K | S | S-2 | Cy | ||
| Rajabasa | 598 aA |
532 aA |
541 aA |
620 aA |
612 aA |
639 aA |
520 aA |
583 bA |
|
| Gisting | 917 bB |
628 aAB |
609 aAB |
633 aAB |
679 aAB |
592 aAB |
701 aAB |
346 aA |
|
Table 10. Interaction of location and genotype on average dry biomass weight (g) of sorghum.
| Location | Genotypes | ||||||||
| M | T B | N | S-1 | K | S | S-2 | Cy | ||
| Rajabasa | 162 aA |
142 aA |
151 aA | 179 aA |
168 aA |
185 aA |
199 aA |
186 bA |
|
| Gisting | 332 bB |
236 bA |
148 aA |
195 aA |
293 aA |
181 aA |
220 aA |
108 aA |
|
Discussions
Sorghum is a resilient, warm-weather crop that thrives under specific environmental conditions. Sorghum requires well-drained soil with a pH of 5.5 – 8.5 and a clay content of 10 – 30%. Minimum temperature for sorghum germination is 7°C – 10°C, but growth is optimal at 27°C – 30°C. Sorghum is a short-day plant. It prefers a 10 – 11 hour photoperiod and a frost-free window of 120 – 140 days. Sorghum has high drought tolerance due to its branched root system and small leaf surface area, though stable rainfall patterns yield the best results. Sorghums are cultivated at an altitude of 0 – 700 meters above sea level, with relative humidity of 20 to 40 % are ideal for best yields. Sorghum is often grown in regions that get between 50–100 mm of monthly precipitation in the first 2 to 2.5 months after planting, following with a dry period. The ideal soil moisture during germination ranges between 25% and 50% of field capacity, and the sorghum plant can survive flooding. The unfavourable conditions for cultivating sorghum are those with an average temperature of more than 30°C, and less than 600 m of average rainfall per season (Tan et al., 2024; Khalifa and Eltahir, 2023; Mundia et al., 2019).
Following that requirements, the soil of the study fields at lowland was highly suitable for sorghum cultivation. The clay percentage is ideal, and the drainage characteristics meet the "well-drained" requirement perfectly. However, because the pH (5.5) is at the minimum threshold and Organic Carbon is low, management should focus on maintaining the pH level and potentially increasing organic matter to ensure long-term productivity and prevent the soil from becoming too acidic. Similar to that, the soil condition at high land area was excellent and exceeded the standard requirements for sorghum cultivation. The combination of a perfect pH (6.03), ideal clay percentage (17.6%), and superior organic matter (14.95%) provides an elite environment for growth. The only management consideration would be the slightly slower permeability at deeper levels. However, given sorghum's resilience, this is unlikely to be a drawback unless the area experiences extreme, prolonged flooding. This land has high potential for achieving maximum yields.
From the agroclimatic requirement for sorghum cultivation, the lowland temperature (22.6°C–31.7°C) was almost perfectly aligned with the optimal growth temperature of 27°C–30°C. The higher maximum temperature (31.7°C) will accelerate metabolic processes and biomass accumulation without reaching the "heat stress" threshold (usually >38°C). For the highland temperature ranged 20.5°C–29°C, while still within the acceptable range, the lower minimum temperature (20.5°C) might slightly slow down the growth rate compared to the lowland site. However, it remains well above the 15°C limit where growth typically stalls. Even though the temperature is suitable, it is necessary to pay attention to water availability. Variability in rainfall patterns and increased air temperature in semi-arid regions are associated with decreased sorghum grain yield (Prasad et al., 2021). The evaporation rates are nearly identical (3.65 mm vs. 3.54 mm), which means the atmospheric evaporative demand was stable across both locations. The lowland area need a total irrigation of 92.9 mm. While higher than the highland (35.8 mm), this is still a relatively low water requirement for a grain crop.
Air temperature is the primary driver of crop phenology, the timing of biological life cycles such as germination, flowering, and maturity. Since plants are poikilothermic (their internal temperature tracks the environment), thermal energy dictates the pace of their development. plants "measure" time in accumulated heat that is calculated using Growing Degree Days (GDD), which represents the accumulation of daily temperatures above a specific base temperature. For sorghum, the effect of high temperature above the optimal range is floret sterility, reduced pollen, embryo abortion, and lower grain yield (Kumar et al., 2025).
Different altitude creates different air temperatures, whereas increasing altitude results in decreasing air temperature. On average, the temperature drops by about 6.50C for every 1,000 meters of elevation (the environmental lapse rate). Each crop has different phenological stages and the temperature requirements to reach each stage, in general the higher the temperature, the longer time needed to reach the phenological stages. The comparison of growth stages of the sorghum of the field study and a location in Central Java with a higher altitude is presented in Table 11.
Table 11. Comparison of the days to reach growth stage between the field study and Central Java area.
| Locations | Lampung Province | Central Java (1118 m asl) With two varieties |
||
|---|---|---|---|---|
| Growth stages | Lowland | Highland | W.H Manippa Tadda | W.H Mitting Nggangga |
| Emergence | 4-5 | 6-7 | 4-7 | 3 |
| Three leaf | 7-8 | 9-10 | 12-15 | 14-15 |
| Five leaves | 10-11 | 12-13 | 24-30 | 25-29 |
| GP differentiation | 13-15 | 14-15 | 38-45 | 40-43 |
| Flag leaf | 18-19 | 20-22 | 52-62 | 53-57 |
| Boot heading | 23-24 | 25-26 | 62-75 | 57-67 |
| Flowering | 25-26 | 29-30 | 73-87 | 64-76 |
| Soft dough | 60-63 | 63-65 | 85-101 | 76-90 |
| Hard dough | 70-73 | 75-77 | 95-113 | 98-112 |
| Physiology mature | 77-80 | 85-87 | 119-127 | 125-137 |
Source: Rikawati, Agnes and Theresia (2025).
Some information related to days to reach growth stage outside Indonesia are in Tamil Nadu, India flower initiation was 60 days, anthesis was 67 days (Ammalyapan, 2023). In Ethiopia with air temperature range of 14.1-27.2 oC, days to flowering were 65-129 days, grain feeling 73 days, days to maturity 114 to 170 days (Derese et al, 2018); and in Patna, India, days to flowering 63.2 -75.9 days and days to maturity 102.5 to 103.2 (Prakash, et al, 2017). In Eastern Ethiopia, days to heading was 80 days and to maturity was 123 days (Aseefa et al., 2020). That information showed that sorghum planted in higher altitude in Central Jawa and in those areas have longer days compared to sorghum planted in the tropical Indonesian climate. Even though those also depend on various characters.
The effect of temperature on crop phenology could be quantified by using GDD or heat units (Table 12). Physiologically, the heat accumulation requirement to complete the life cycle of a specific variety is constant. However, ecologically, other environmental factors in different locations can act as 'disturbances' that create variations in the total GDD recorded until harvest time. Table 12 showed that sorghum GDD in the lowland area and highland area of Lampung, Indonesia, were similar but much different from sorghum GDD in the USA. In the GDD concept, temperature is an expression of thermal resources needed for growing energy. Therefore, places with high temperature store more energy (Table 4). Description of how sorghum crop variables varied among the genotypes and locations.
Table 12. Comparison of the growing degree days to reach growth stage between the field study and in sorghum plantation in USA.
|
Source: Kelley, J (2004).
A study using 225 sorghum genotypes to investigate sorghum phenotypic diversity with principal component analysis resulted in the most significant component which contributed to genotype variation, yield and yield-related traits. The second most significant component was the time taken for physiological maturity, duration of grain filling, number of leaves, and straw yield per hectare. The third most significant component was leaf area, leaf width, leaf length, and thousand-kernel weight. The fourth component was highly influenced by straw yield and days to flowering. The minor component was positively influenced by panicle weight, thousand kernel weight, and panicle length. Therefore, these characteristics contribute to productivity. Furthermore, this study discovered that a few characteristics significantly influenced the genetic divergence between genotypes of sorghum. These characteristics included plant height, biomass yield, leaf width, leaf area, yield per panicle, straw yield, and grain production per hectare (Wedajo et al, 2025).
As shown in Table 5, location’s air temperature significantly affected plant height, number of leaves, fresh and dry weight of 1000 grains, and had no significant effect on average panicle length, while biomass fresh and dry weight was affected by location, interacting with sorghum varieties. A study of Sorghum in Brazil (do Nascimento, 2022) showed that mean emergence time (MET), and mean of emergence speed is significantly affected by air temperature. Temperature also affected the Fresh and dry biomass weight. Research in Indonesia resulted in the finding that plant height, panicle length, and seed fresh weight have significant differences in all four varieties of sweet sorghum at all different altitudes, and the Super-2 variety has better adaptation and genotype performance at the lowland area than Kawali (Adinurani et al, 2022).
Materials and Methods
Study area
The study was conducted in Polinela Campus, Rajabasa, Bandar Lampung field station (-5.354, 105.218; 120 m asl) and a farmer’s field in Gisting, Tanggamus, Lampung, Indonesia (-5.437, 104.715; 615 m asl); from March to June 2022.
The experiment was laid out in a split-plot design with eight local sorghum genotypes as the treatments and three replications. The eight (8) genotypes were. Mandau (M), Telaga Bodas (TB), Numbu (N), Samurai 1 (S1), Kawali (K), Suri (S), Samurai 2 (S2), and Cymit (C).
In each of the trials, all growth phases were observed, and the phase date was determined when 50% of the plants in a plot reached the certain stages. The growth stages included: Stage 0, emergence; Stage 1, the collar of the third leaf is visible; Stage 2, the collar of the fifth leaf is visible; Stage 3, the growing point differentiation (GPD) stage is when the plant changes from vegetative growth to reproductive growth; Stage 4, the flag leaf is emerge; Stage 5, Leaves have fully expanded; Stage 6, bloom stage; Stage 7, the soft-dough stage; Stage 8, the hard dough stage; Stage 9, physiological maturity.
For measuring growth variables, three samples were randomly taken for each genotype and each replication. The variables included: plant height, number of leaves, panicle length, upper crops biomass fresh and dry weight, 1000 grain fresh and dry weight. The contents of protein and lipids were also analysed for the quality of the sorghum genotypes.
Data analysis
Analysis of sorghum growth and production data was carried out with variance analysis (ANOVA), and if it showed a significant difference, further tests were carried out with the Tuckey LSD test at a confidence level of 95%.
Calculation of Growing Degree Days (GDD)
GDD was counted using the formula:
\[GDD = \left( \frac{Tmax + Tmin}{2} \right) - Tbase\]
Tmax : Maximum temperature (oC)
Tmin : Minimum temperature (oC)
Tbase : Base temperature of sorghum (oC)
In this study, the temperature on oC was converted to oF that the base temperature of sorghum were 50oF – 100oF.
Conclusion
Differences in altitude affect the phenological stages, growth, and production of sorghum plants. Sorghum plants in lowlands grow taller, have more leaves, and longer panicles, but sorghum seeds in highlands are heavier than those grown in lowlands. Therefore, sorghum is a plant that has potential as a food source when air temperatures rise because this plant adapts well to high temperatures in lowland areas.
Acknowledgements
This research conducted in the experimental station of the State Polytechnic of Lampung, for which the author expresses gratitude.
Conflict of Interest
The authors declare that there is no conflict of interest.
Author Contributions
TKM research manager, manuscript writer dan reviewer PBT experiment design, statistic analysis and manuscript reviewer.
References
Abreha KB, Enyew M, Carlsson AS, Vetukuri RR, Feyissa T, Motlhaodi T, Geleta M (2022) Sorghum in dryland: morphological, physiological, and molecular responses of sorghum under drought stress. Planta. https://doi.org/10.1007/s00425-021-03799-7
Ammaiyappan A, Geethalakshmi V, Bhuvaneswari K, Kalarani MK, Thavaprakaash N, Prahadeeswaran M (2023) Phenology, phyllochron and productivity of sorghum in response to varying growing environments and nitrogen levels in the semiarid irrigated condition. J Appl Nat Sci. 15(4):1563 - 1571. https://doi.org/10.31018/jans.v15i4.5105
Assefa Y, Staggenborg SA, Prasad VPV (2010) Grain sorghum water requirement and responses to drought stress: A review. Online. Crop Management. https://doi.org/10.1094/CM-2010-1109-01-RV
Babálová, D, Skvareninová J, Fazekaš J, Vyskot I (2018) The dynamics of the phenological development of four woody species in South-West and Central Slovakia. Sustainability. 10:1497. https://doi.org/10.3390/su10051497
Chmielewski FM, Rötzer T (2001). Response of tree phenology to climate change across Europe. Agric Forest Meteorol. 108:101–112. https://doi.org/10.1016/S0168-1923(01)00233-7
Gao F and Zhang X (2021) Mapping crop phenology in near real-time using satellite remote sensing: challenges and opportunities J Remote Sens. 1:14. https://doi.org/10.34133/2021/8379391.
Davis CC, Goia M L, Daniel S P, Asprino R, Maruyama R, Torquato D, Cook BI and Ellison AM (2022) New directions in tropical phenology. Trends Ecol & Evol. 37(8). https://doi.org/10.1016/j.tree.2022.05.001.
do Nascimento GSG, Gilmara MO, Elioenai GFS, Juliane RAB, Miguel JMG, Anderson R de Oliveira, Francislene A (2023). The Increase in air temperature and its interference in the emergence and initial growth of sorghum cultivars. GJSFR-D 23(2).
Khalifa M and Elfatih A B (2023) Assessment of global sorghum production, tolerance, and climate risk. Front. Sustain. Food Syst. (23). https://doi.org/10.3389/fsufs.2023.1184373
Kelley J (2004) Growth and Development. Chapter 1 - Growth and Development - Grain Sorghum Handbook MP297
Kumar A, Muthuramalingam P, Kumar R, Tiwari S, Verma, Park S, Shin H (2025) Adapting crops to rising temperatures: Understanding heat stress and plant resilience echanisms. Int J Mol Sci. 2025, 26, 10426. https://doi.org/10.3390/ijms262110426
Linderholm HW (2006) Growing season changes in the last century. Agric Forest Meteorol. 137(1–2): 1-14. https://doi.org/10.1016/j.agrformet.2006.03.006
Longchamps L, Philpot W (2023). Full-season crop phenology monitoring using two-dimensional normalized difference pairs. Remote Sens. 15:5565. https://doi.org/10.3390/rs15235565
Mundia CW, Silvia S, Kofi A, Guangxing W (2019) A regional comparison of factors affecting global sorghum production: the case of North America, Asia and Africa’s Sahel. Sustainability. 11:2135; https://doi.org/10.3390/su1107213
Rika Wati LW, Agnes DM, Theresa DK (2025) Characterization of phenology and growth phases of local sorghum (Sorghum bicolor L. Moench) from East Sumba. Agrium. 28 (2). https://doi.org/10.30596/agrium.v28i2.24217
Sakai S and Kitajima K (2019) Tropical phenology: recent advances and perspectives. Ecol Res. 34:50–54. https://doi.org/10.1111/1440-1703.1131
Sidqi IF and Aulia A (2025) Optimalisasi sorgum sebagai alternatif produk pangan fungsional Policy brief pertanian, kelautan, dan biosains tropic 7(1). https://doi.org/10.29244/agro-maritim.0701.1187-1192
Škvareninová J and Mrekaj I (2022). Impact of climate change on Norway spruce flowering in the Southern Part of the Western Carpathians. Front. Ecol. Evol. 10 https://doi.org/10.3389/fevo.2022.865471
Tan Q, Liu Y, Dai L and Pan T (2021) Shortened key growth periods of soybean observed in China under climate change. Sci Rep 11:8197 https://doi.org/10.1038/s41598-021-87618-9
Tan, D., Angelica P.A., Daniel RF, Cicilia,T, Angeline T, Shane V, Junaida A (2024) Comprehensive utilization of sorghum (Sorghum bicolor) in the food industry and its nutritional properties: A Review. IJLS 6(1). DOI:10.54250/ijls.v6i01.190
Vitasse Y, François C, Delpierre N, Dufrêne E, Kremer A, Chuine I, Sylvain DS (2011) Assessing the effects of climate change on the phenology of European temperate tr ees. Agric Forest Meteorol. 151:969–980. DOI:10.1016/j.agrformet.2011.03.003
Wang ZB, Chen J, Xing F, Han Y, Chen F, Zhang L, Li Y, Li C (2017) Response of cotton phenology to climate change on the North China Plain from 1981 to 2012. Sci Rep. 7: 6628 https://doi.org/10.1038/s41598-017-07056-4
Walther GR, Post E, Convey P, Menzel A, Parmesan C, Trevor J, Beebee JC, Fromentin JM, Guldber EH, Bairlein F (2002) Ecological responses to recent climate change. Nature. 416: 389–395 https://doi.org/10.1038/416389a
Wedajo G , Mekbib F, Tirfessa A, Bekele A (2025) Phenotypic diversity of sorghum [Sorghum bicolor (L.) Moench] genotypes based on qualitative and quantitative traits. Heliyon. 11(3) https://doi.org/10.1016/j.heliyon.2025.e42378.
Xiao D, Zhang Y, Bai H and Tang J (2021) Trends and climate response in the phenology of crops in Northeast China. Front Earth Sci. 9 :811621. https://doi.org/10.3389/feart.2021.81162
Zhao Y, Xiao D, Bai H, Tao F (2019) Research progress on the response and adaptation of crop phenology to climate change in China Progress In Geography. 38(2): 224-235 https://doi.org/10.18306/dlkxjz.2019.02.006