Australian Journal of Crop Science
Article | https://doi.org/10.21475/ajcs.26.20.06.pne160
Submitted: 09 October 2025 | Revised: 11 January 2026 | Accepted: 06 May 2026
Pages 468-476
Agronomic performance and yield quality of several IPB hybrid sweet corn varieties during the rainy and drier seasons in a tropical rainforest climate
Carla Frieda Pantouw1, Brayen Patandean1, Arya Widura Ritonga2*, Muhamad Achmad Chozin2, Agus Rachmat3, Syamsidah Rahmawati3
1Graduate Program of Agronomy and Horticulture, Department of Agronomy and Horticulture, Faculty of Agriculture, Institut Pertanian Bogor. Jl. Meranti, Kampus IPB Darmaga, Bogor 16680, West Java, Indonesia.
2Department of Agronomy and Horticulture, Faculty of Agriculture, Institut Pertanian Bogor. Jl. Meranti, Kampus IPB Darmaga, Bogor 16680, West Java, Indonesia.
3Genetic Engineering Research Center, National Research and Innovation Agency (BRIN), Soekarno Science and Technology Park, Jl. Raya Bogor KM 46, Cibinong 16911, West Java, Indonesia
*Corresponding author: aryaagh@apps.ipb.ac.id
Abstract: Sweet corn (Zea mays L. saccharata) is a high-value horticultural crop whose agronomic performance and yield quality are influenced by seasonal variation and genotype-dependent responses. This study aimed to evaluate the agronomic and yield performance of ten hybrid sweet corn genotypes, consisting of six IPB breeding hybrids and four commercial varieties, across two contrasting growing seasons (rainy and dry) in Bogor, Indonesia. The experiment was arranged in a randomized complete block design (RCBD) with three replications per season. Morphological, physiological, and yield traits were analyzed using analysis of variance (ANOVA), followed by descriptive multivariate analyses using Principal Component Analysis (PCA) and Agglomerative Hierarchical Clustering (AHC). The results showed that the number of leaves (NL), leaf angle (LA), and leaf area ratio (LAR) differed significantly between seasons, indicating genotype-dependent morphological and physiological adjustments to seasonal changes in light and humidity. Cob weight without husk (CWoH) was significantly affected by genotype and genotype × season interaction, suggesting differential yield responses among genotypes across seasons. PCA and AHC revealed distinct grouping patterns among genotypes, reflecting differences in yield-related traits and seasonal responses rather than definitive yield stability. Overall, the study highlights the importance of genotype selection based on seasonal adaptability to optimize sweet corn production under tropical conditions.
Keywords: genotype–environment interaction; source–sink balance; morphological adaptation; yield stability; multivariate analysis.
Abbreviations: AHC_Agglomerative Hierarchical Clustering; PCA_Principal Component Analysis; RCBD_Randomized Complete Block Design; G×E_Genotype × Environment Interaction; NL_Number of Leaves; LA_Leaf Angle; LAR_Leaf Area Ratio; LAI_Leaf Area Index; NAR_Net Assimilation Rate; RGR_Relative Growth Rate; SLA_Specific Leaf Area; DT_Days to Tasseling; DS_Days to Silking; DH_Days to Harvest; CWH_Cob Weight with Husk; CwoH_Cob Weight without Husk; HW_Husk Weight; CL_Cob Length; CD_Cob Diameter; RS_Rainy Season; DS_Dry Season.
Introduction
Sweet corn (Zea mays L. saccharata) is a high-value horticultural crop with increasing global and national demand due to its sweet taste, tender kernels, and versatility for fresh and processed consumption (Hu et al., 2021; Ruanjaichon et al., 2021; Heryanto et al., 2022). In Indonesia, consumption continues to rise in line with population growth, dietary shifts, and greater awareness of healthy food choices, positioning sweet corn as a strategic commodity for food diversification and farmer income enhancement (Jompuk et al., 2020; Revilla et al., 2021; Rozi et al., 2023).
Despite its economic importance, sweet corn production in tropical regions is strongly constrained by seasonal environmental variability. The dry season generally provides high solar radiation but is often accompanied by water limitation, which can restrict vegetative growth and ear development (Paranhos et al., 2023; Tas & Mutlu, 2021). Conversely, the rainy season is characterized by high rainfall and humidity, increasing disease pressure, reducing light availability, and negatively affecting photosynthetic efficiency and sugar accumulation (Hou et al., 2020; Fu-cheng et al., 2022). These contrasting seasonal conditions can result in substantial variation in agronomic performance and yield quality, making genotype × environment (G×E) interactions a key determinant of sweet corn productivity under tropical conditions (Sawangha et al., 2023; Stansluos et al., 2023).
The development and use of hybrid varieties is a major strategy to mitigate environmental constraints, as hybrids often exhibit higher yield potential and improved stress tolerance due to heterosis (Mustafa et al., 2021). In Indonesia, IPB University has actively developed sweet corn hybrid genotypes with promising agronomic and ear quality traits (Susanti et al., 2023; Utari et al., 2023). Previous studies have reported considerable variation among IPB hybrids in plant growth, ear characteristics, and sugar content (Susanti et al., 2023). However, most evaluations have been conducted within a single growing season, limiting understanding of genotype performance stability and adaptive responses across contrasting seasonal environments.
Studies from other regions have demonstrated that seasonal variation markedly affects sweet corn yield and quality. Paranhos et al. (2023) showed that climatic factors significantly influenced ear size and quality, while Dhaliwal et al. (2022) reported reduced sugar content under high-humidity conditions. Nevertheless, systematic comparisons of IPB-developed hybrids and commercial varieties across both dry and rainy seasons under the same agroecological conditions remain limited. In particular, information on how seasonal variation modulates morphophysiological traits and yield components and contributes to genotype × season interactions in IPB hybrids is still lacking.
Therefore, this study addresses the absence of integrated, cross-season evaluations of IPB hybrid sweet corn genotypes by examining morphological, physiological, and yield-related traits under contrasting tropical seasonal conditions. The objectives were to evaluate agronomic performance and yield quality of IPB hybrids and commercial varieties across dry and rainy seasons in Bogor, Indonesia, and to test the hypotheses that (i) sweet corn genotypes exhibit differential responses across seasons due to genotype × season interactions, and (ii) certain genotypes maintain relatively stable yield-related traits across seasons, indicating superior adaptive potential under tropical environmental variability.
Results and Discussion
Growth and physiological performance across seasons
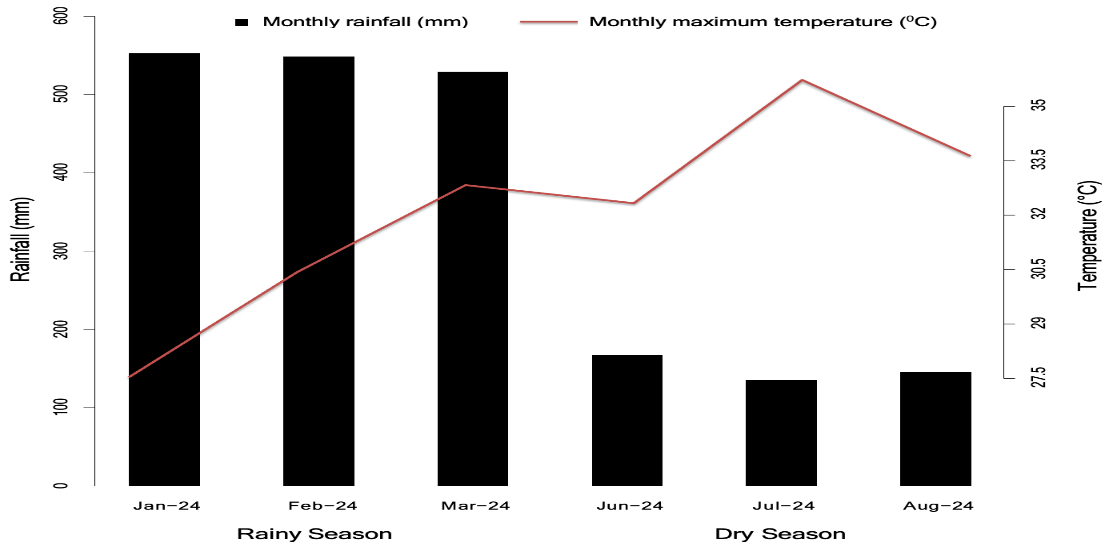
Climatic conditions at the experimental site differed markedly between the rainy and dry seasons (Figure 1). Average monthly rainfall during the rainy season reached approximately 550 mm, while during the dry season it declined to around 160–180 mm, accompanied by an increase in maximum temperature from approximately 30°C to 35°C. These conditions reflect the typical humid tropical climate of Bogor, characterized by high rainfall early in the year followed by a sharp decline toward midyear (BMKG, 2024).
Seasonal variation in temperature and rainfall is known to influence soil moisture, air humidity, and plant physiological processes (Humphrey et al., 2021). During the rainy season, high humidity combined with lower solar radiation may reduce light-use efficiency, whereas higher temperature and radiation during the dry season may promote vegetative growth while increasing the risk of water stress (Sanchez et al., 2025; Patandean et al., 2025).
The analysis of variance (ANOVA) showed that only a limited number of traits were significantly affected by season, while most growth and physiological parameters were influenced primarily by genotype or showed non-significant seasonal effects (Table 2). Among morphological traits, only the number of leaves (NL) and leaf angle (LA) differed significantly between seasons (Table 3), indicating higher sensitivity of these traits to seasonal environmental variation (Rathinavel et al., 2022). The Exotic genotype produced the highest leaf number during the rainy season, whereas Secada exhibited the highest value during the dry season. Higher leaf numbers under humid conditions have been associated with enhanced vegetative development in maize (Liu et al., 2020). Differences in leaf angle among genotypes may reflect adaptive responses to contrasting light environments, where more upright leaves reduce radiation load under high light intensity, while more horizontal leaves enhance diffuse light interception during the rainy season (Patandean et al., 2025).
Among physiological traits, only Leaf Area Ratio (LAR) differed significantly between seasons (Table 4), while Leaf Area Index (LAI), Net Assimilation Rate (NAR), Relative Growth Rate (RGR), and Specific Leaf Area (SLA) showed no significant seasonal differences. Higher LAR during the rainy season suggests greater allocation of biomass to leaf area under lower light availability (Mendes et al., 2022). Conversely, lower LAR in the dry season may be associated with thicker leaves and reduced leaf area as a response to higher radiation and water limitation (Mei et al., 2023; Mendes et al., 2022). Genotype SM1 × SM9 exhibited the highest LAR value, whereas SB8 × SM6 and SM12 × SM1 showed relatively stable LAR across seasons, reflecting differences in physiological allocation strategies (Mei et al., 2023).
Comparison of yield and yield components across seasons
The analysis of variance indicated that cob length (CL) and cob diameter (CD) were significantly affected by growing season. In contrast, cob weight without husk (CWoH) was not significantly influenced by seasonal variation (Table 5). These results suggest that seasonal environmental conditions primarily affected ear size attributes rather than final cob biomass. Similar patterns have been reported in maize, where radiation and temperature during the reproductive phase modulate assimilate availability and partitioning, thereby influencing ear development (Yan et al., 2024; Yang et al., 2021).
Genotype-specific responses were observed across seasons. The Secada genotype (G5) consistently exhibited higher CL and CD values during the dry season, whereas SM1×SM9 (G10) showed lower values across both seasons. Such differences may reflect variation in genotype sensitivity to environmental conditions during flowering and grain-filling stages, particularly under combined heat and moisture stress, which has been shown to restrict assimilate supply for ear growth (Qi et al., 2022; Li et al., 2024).
Cob length and cob diameter are widely recognized as indicators of sink capacity and have been positively associated with
Table 1. List of sweet corn genotypes.
| No | Genotype | Owner Agency |
|---|---|---|
| G1 | Exotic | Hybrid commercial variety (Agri Makmur Pertiwi Company) |
| G2 | Paragon | Hybrid commercial variety (Agri Makmur Pertiwi Company) |
| G3 | SM12-2-13 x SB13-12b-16 | Hybrid lines (Breeding Laboratory, IPB University) |
| G4 | Talenta | Hybrid commercial variety (Agri Makmur Pertiwi Company) |
| G5 | Secada | Hybrid commercial variety (East Seed Indonesia Company) |
| G6 | SB8-4-3 x SM6-3-1 | Hybrid lines (Breeding Laboratory, IPB University) |
| G7 | SM12-2-13 x SM1-1-9 | Hybrid lines (Breeding Laboratory, IPB University) |
| G8 | Arinta | Hybrid lines (Breeding Laboratory, IPB University) |
| G9 | Verona | Hybrid lines (Breeding Laboratory, IPB University) |
| G10 | SM1-1-9 x SM9-3A-1 | Hybrid lines (Breeding Laboratory, IPB University) |
Table 2. Analysis of variance (ANOVA) results for various growth, physiological, and yield traits of 10 maize genotypes across two growing seasons.
| Variable | Growing Season (df = 1) | Genotype (df = 9) | Interaction (df = 9) | ||||||
|---|---|---|---|---|---|---|---|---|---|
| MS | F-value | P-value | MS | F-value | P-value | MS | F-value | P-value | |
| PH | 214.05 | 0.85ns | 0.4088 | 2003 | 10.84** | 0.0001 | 349.93 | 1.89ns | 0.0847 |
| NL | 5.24 | 3.89ns | 0.1198 | 3.59 | 14.86** | 0.0001 | 0.65 | 2.70* | 0.0163 |
| LL | 189.96 | 4.37ns | 0.1046 | 373.06 | 20.97** | 0.0001 | 36.87 | 2.07ns | 0.0589 |
| LW | 7.42 | 18.31* | 0.0129 | 9.53 | 18.80** | 0.0001 | 0.52 | 1.02ns | 0.4421 |
| LA | 2.97 | 6.69ns | 0.0609 | 283.80 | 426.47** | 0.0001 | 34.35 | 51.62** | 0.0001 |
| LAI | 1.69 | 14.99* | 0.0180 | 2.22 | 17.83** | 0.0001 | 0.04 | 0.33ns | 0.9577 |
| NAR | 0.08872 | 163.02** | 0.0002 | 0.00197 | 4.85** | 0.0003 | 0.00014 | 1.22ns | 0.3125 |
| RGR | 0.00169 | 7.64ns | 0.0506 | 0.000617 | 2.24* | 0.0420 | 0.0000264 | 1.20ns | 0.3261 |
| LAR | 21759 | 228.22** | 0.0001 | 1370 | 7.47** | 0.0001 | 423.46 | 2.31* | 0.0364 |
| SLA | 22089 | 49.08** | 0.0022 | 6862 | 7.15* | 0.0001 | 1261 | 1.31ns | 0.2643 |
| DT | 70.42 | 10.41* | 0.0321 | 33.42 | 18.72** | 0.0001 | 18.68 | 10.46** | 0.0001 |
| DS | 138.02 | 26.21** | 0.0069 | 47.64 | 35.53** | 0.0001 | 20.72 | 15.45** | 0.0001 |
| DH | 163.35 | 27.00** | 0.0065 | 9.16 | 1.66ns | 0.1348 | 12.13 | 2.20* | 0.0454 |
| CWH | 4770 | 1.55ns | 0.2805 | 38031 | 32.61** | 0.0001 | 1468 | 1.26ns | 0.2921 |
| HW | 6100 | 28.10** | 0.0061 | 4620 | 5.62** | 0.0002 | 709.68 | 0.86ns | 0.5656 |
| CWoH | 81.67 | 0.04ns | 0.8531 | 17826 | 33.94** | 0.0001 | 1290 | 2.46* | 0.0269 |
| CL | 8.36 | 13.42* | 0.0215 | 46.91 | 169.20** | 0.0001 | 1.04 | 3.77** | 0.0020 |
| CD | 2.28 | 21.32** | 0.0099 | 48.28 | 466.56** | 0.0001 | 0.89 | 8.64** | 0.0001 |
Note: PH: Plant Height; NL: Number of Leaves; LL: Leaf Length; LW: Leaf Width; LA: Leaf Angel; LAI: Leaf Area Index; NAR: Net Assimilation Rate; RGR: Relative Growth Rate; LAR: Leaf Area Ratio; SLA: Specific Leaf Area; DT: Days to Tasseling; DS: Days to Silking; DH: Days to Harvest; CWH: Cob Weight with Husk; HW: Husk Weight; CwoH: Cob Weight without Husk; CL: Cob Length; CD: Cob Diameter. ns = not significantly different; * = significantly different at the 5% level; ** = highly significant at the 1% level.
cob weight and grain yield in maize (Magar et al., 2021; Sharma et al., 2021; Reddy et al., 2022). The observed variation in these traits among genotypes indicates differences in yield-related potential rather than definitive evidence of seasonal yield superiority. Therefore, while ear size traits contribute substantially to economic yield, further multi-environment evaluation is required to assess yield consistency and stability under contrasting agroclimatic conditions (Deng et al., 2023; Ren et al., 2022).
Multivariate analysis of sweet corn
Principal Component Analysis (PCA) showed that the first two principal components explained approximately 71.3% of the total variation among the sweet corn genotype–season combinations, with PC1 accounting for 47.40% and PC2 for 23.90% of the variance (Figure 2). Separation along PC1 was primarily associated with yield-related and leaf structural traits, including Leaf Length (0.416), Leaf Area Index (0.389), and Specific Leaf Area (−0.377), whereas PC2 was mainly driven by canopy and growth-related traits such as Net Assimilation Rate (−0.502) and Leaf Area Ratio (0.481) (Table 6). These patterns indicate that yield formation and vegetative canopy development contributed differently to multivariate variation among genotype–season combinations, consistent with previous reports on trait associations in maize (Ren et al., 2022).
The selection of the ten morphophysiological traits included in the PCA was specifically intended to represent key components of canopy architecture and growth efficiency, which are critical for assessing their potential influence on microclimate modification and for supporting predictive frameworks in intercropping system design.
Table 3. Mean values of morphological observations of ten sweet corn genotypes in two different seasons.
| Genotypes | PH (cm) | NL | LL (cm) | LW (cm) | LA (0) | |||||
|---|---|---|---|---|---|---|---|---|---|---|
| RS | DS | RS | DS | RS | DS | RS | DS | RS | DS | |
| G1 | 202.76 | 184.80 | 13.67a | 12.56abcd | 89.46 | 99.30 | 11.13 | 11.77 | 26.11hijk | 27.44hi |
| G2 | 210.75 | 202.64 | 11.67bcde | 11.00de | 95.81 | 97.17 | 10.20 | 11.10 | 22.67l | 23.89kl |
| G3 | 186.77 | 203.00 | 11.53bcde | 12.22abcd | 91.67 | 94.87 | 10.47 | 10.70 | 22.78l | 24.78jkl |
| G4 | 181.47 | 196.74 | 11.33bcde | 11.22cde | 83.95 | 95.77 | 10.30 | 10.23 | 33.22de | 26.89hij |
| G5 | 236.99 | 226.46 | 13.13ab | 12.00abcd | 102.26 | 104.07 | 10.67 | 11.93 | 35.22cd | 28.11ghi |
| G6 | 223.35 | 210.28 | 11.87abcde | 11.11cde | 91.13 | 87.00 | 8.67 | 9.40 | 24.78jkl | 30.56fg |
| G7 | 204.14 | 223.89 | 11.27bcde | 11.33bcde | 84.63 | 85.33 | 8.80 | 9.13 | 35.89c | 32.56ef |
| G8 | 211.58 | 203.40 | 11.47bcde | 11.00de | 90.99 | 90.00 | 8.30 | 9.43 | 28.56gh | 35.78cd |
| G9 | 221.91 | 198.18 | 13.00abc | 11.44bcde | 90.49 | 98.20 | 11.43 | 13.23 | 25.78ijk | 25.78ijk |
| G10 | 168.73 | 161.32 | 10.87de | 10.00e | 71.19 | 75.47 | 8.77 | 8.83 | 45.00b | 48.67a |
| P-Value | 0.0847 | 0.0163 | 0.0589 | 0.4421 | 0.0001 | |||||
Note: PH: plant height; NL: number of leaves; LL: leaf length; LW: leaf width; LA: leaf angle; RS: rainy season; DS: dry season. Different letters within the same column indicate significant differences according to the HSD test at the 5% level.
Fig 1. Maximum and minimum temperature (°C) and precipitation (mm) during both seasons.
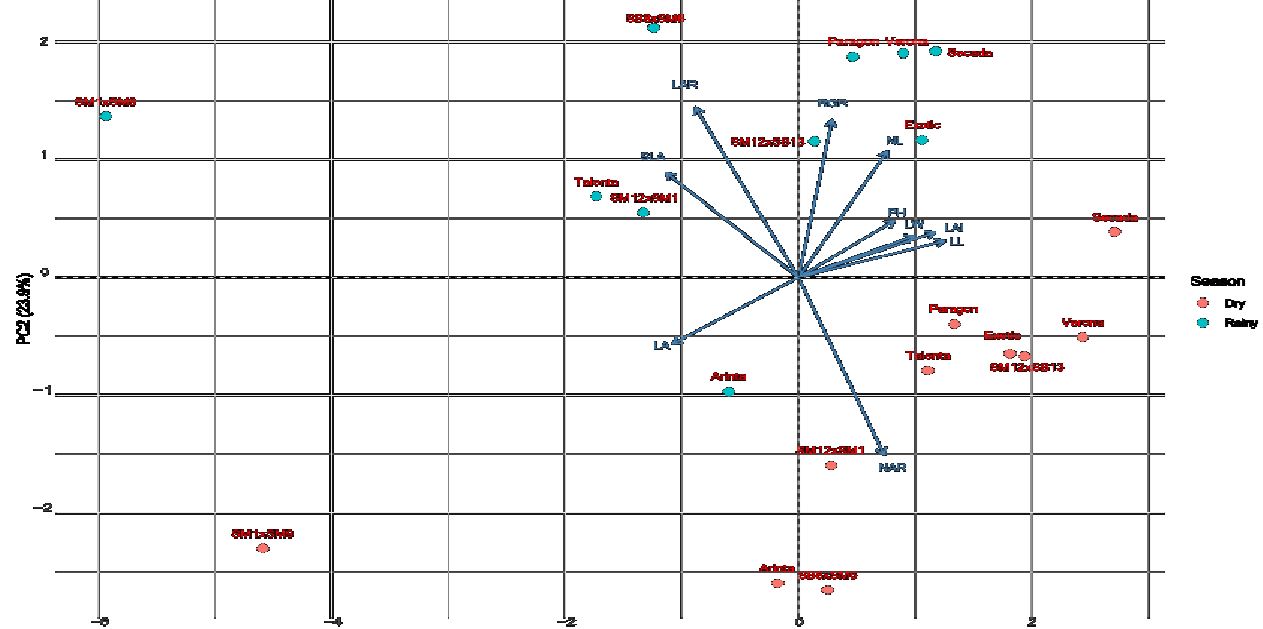
Fig 2. Principal component analysis (PCA) results of various maize genotypes observed across two growing seasons.
The different positioning of genotype–season combinations on the PCA plane indicates variability in canopy and physiological trait responses to contrasting environmental conditions between the rainy and dry seasons. This pattern reflects genotype × environment (G×E) interactions at the level of vegetative trait expression, without implying adaptive superiority or physiological stability. In this study, PCA was employed as an exploratory tool to identify relationships among canopy and growth-related traits that are relevant as a basis for further analysis of canopy structure effects on microclimatic conditions within cropping systems.
Table 4. Mean values of physiological observations of ten maize genotypes across two growing seasons,
| Genotypes | LAI | NAR (g cm⁻² day⁻¹) | RGR (g g⁻¹ day⁻¹) | LAR (cm² g⁻¹) |
SLA (cm² g⁻¹) | |||||
|---|---|---|---|---|---|---|---|---|---|---|
| RS | DS | RS | DS | RS | DS | RS | DS | RS | DS | |
| G1 | 2.86 | 3.35 | 0.27 | 0.33 | 0.10 | 0.09 | 65.25bcdefg | 45.34defg | 167.98 | 167.34 |
| G2 | 3.37 | 3.61 | 0.25 | 0.32 | 0.11 | 0.09 | 90.24bc | 52.52cdefg | 206.53 | 192.20 |
| G3 | 3.35 | 3.47 | 0.26 | 0.34 | 0.10 | 0.09 | 81.71bcdef | 42.30fg | 199.55 | 155.90 |
| G4 | 2.77 | 3.17 | 0.24 | 0.34 | 0.10 | 0.10 | 86.91bcd | 45.07defg | 216.51 | 168.35 |
| G5 | 3.30 | 3.70 | 0.26 | 0.31 | 0.10 | 0.10 | 86.42bcde | 54.58bcdefg | 191.15 | 158.12 |
| G6 | 2.13 | 2.51 | 0.24 | 0.37 | 0.11 | 0.08 | 95.74b | 38.25g | 245.79 | 147.58 |
| G7 | 2.27 | 2.67 | 0.30 | 0.35 | 0.12 | 0.10 | 75.99bcdefg | 44.80efg | 192.28 | 153.47 |
| G8 | 2.03 | 2.57 | 0.28 | 0.34 | 0.09 | 0.08 | 50.85cdefg | 39.47g | 161.39 | 153.58 |
| G9 | 3.27 | 3.64 | 0.24 | 0.33 | 0.10 | 0.10 | 84.62bcde | 44.48efg | 190.26 | 158.71 |
| G10 | 1.83 | 1.84 | 0.21 | 0.28 | 0.09 | 0.07 | 138.52a | 68.58bcdefg | 311.45 | 243.91 |
| P-Value | 0.9577 | 0.3125 | 0.3261 | 0.0364 | 0.2643 | |||||
Note: LAI: leaf area index; NAR: net assimilation rate; RGR: relative growth rate; LAR: leaf area ratio; SLA: specific leaf area. RS: rainy season; DS: dry season. G1: Exotic; G2: Paragon; G3: SM12 x SB13; G4: Talenta; G5: Secada; G6: SB8 x SM6; G7: SM12 x SM1; G8: Arinta; G9: Verona; G10: SM1 x SM9. Different letters within the same column indicate significant differences according to the HSD test at the 5% level.
Table 5. Mean values of yield components of ten sweet corn genotypes in two different growing seasons.
| Genotypes | CWH (g) | HW (g) | CWoH (g) | CL (cm) | CD (mm) | |||||
|---|---|---|---|---|---|---|---|---|---|---|
| RS | DS | RS | DS | RS | DS | RS | DS | RS | DS | |
| G1 | 451.67 | 485.00 | 100.00 | 170.00 | 351.67abcd | 315.00bcde | 22.47ab | 22.13ab | 50.30ab | 50.47ab |
| G2 | 486.67 | 518.33 | 123.33 | 153.33 | 363.33abc | 365.00ab | 20.97b | 21.33b | 50.10abcd | 50.10abcd |
| G3 | 353.33 | 396.67 | 111.67 | 130.00 | 241.67fg | 266.67ef | 16.03ef | 16.90de | 48.33f | 48.70ef |
| G4 | 386.67 | 416.67 | 111.67 | 130.00 | 275.00ef | 286.67def | 18.03cd | 18.77c | 49.27cdef | 50.17abc |
| G5 | 531.67 | 553.33 | 171.67 | 165.00 | 360.00abc | 388.33a | 21.17b | 23.00a | 49.93abcd | 50.90a |
| G6 | 410.00 | 405.00 | 131.67 | 128.33 | 278.33ef | 276.67ef | 17.60cde | 19.20c | 49.23cdef | 49.70bcde |
| G7 | 316.67 | 358.33 | 88.33 | 120.00 | 228.33fg | 238.33fg | 14.83fg | 16.77de | 43.43h | 45.23g |
| G8 | 396.67 | 403.33 | 101.67 | 111.67 | 295.00bcdef | 291.67cdef | 18.27cd | 19.03c | 49.63bcde | 49.63bcde |
| G9 | 340.00 | 375.00 | 76.67 | 101.67 | 263.33ef | 273.33ef | 16.87de | 16.80de | 48.73ef | 49.13def |
| G10 | 305.00 | 245.00 | 65.00 | 73.33 | 240.00fg | 171.67g | 13.93g | 13.70g | 42.63h | 41.47i |
| P-Value | 0.2921 | 0.5656 | 0.0269 | 0.0020 | 0.0001 | |||||
Note: CWH: cob weight with husk; HW: husk weight; CwoH: cob weight without husk; CL: cob length; CD: cob diameter. RS: rainy season; DS: dry season. G1: Exotic; G2: Paragon; G3: SM12 x SB13; G4: Talenta; G5: Secada; G6: SB8 x SM6; G7: SM12 x SM1; G8: Arinta; G9: Verona; G10: SM1 x SM9. Different letters within the same column indicate significant differences according to the HSD test at the 5% level.
Agglomerative Hierarchical Clustering (AHC) was performed using standardized trait data from both growing seasons, employing the Euclidean distance and Ward.D2 linkage method. This analysis grouped genotype × season units based on similarities in morphological, physiological, and yield-related traits, such that the dendrogram represents patterns of multivariate responses to contrasting seasonal environmental conditions (Figure 3).
The AHC results indicate that genotype × season units were not consistently clustered by genotype across seasons, suggesting variation in trait expression between the rainy and dry seasons. This clustering pattern reflects differences in biomass allocation strategies and canopy-related responses to environmental conditions, as previously reported for maize and other crops (Liu et al., 2020; Diouf et al., 2021).
Overall, AHC was used as a descriptive complementary analysis to PCA to illustrate multivariate relationships among genotype × season units. Therefore, the clustering results were not interpreted as indicators of genotype stability or adaptive superiority, but rather as a visualization of similarity and dissimilarity in trait responses under different seasonal environments (Ren et al., 2022).
Materials and Methods
Genetic materials and field conditions
The experiment was conducted at the Pasir Kuda Experimental Farm, Center for Horticultural Studies (PKHT), Department of Agronomy and Horticulture, Faculty of Agriculture, IPB University, Bogor, Indonesia, during two growing seasons: January–March 2024 (rainy season) and June–August 2024 (drier season). Dry weight analysis was performed at the Postharvest Laboratory, Department of Agronomy and Horticulture, IPB University. The classification of climate is tropical rainforest (AF).
Each season was conducted as an independent field experiment arranged in a Randomized Complete Block Design (RCBD) with a single factor, namely sweet corn genotype (Table 1). The genetic materials consisted of four commercial hybrids (Talenta, Paragon, Secada, and Exotic) and six IPB hybrid genotypes (Arinta, Verona, SM12 × SB13, SM12 × SM1, SB8 × SM6,
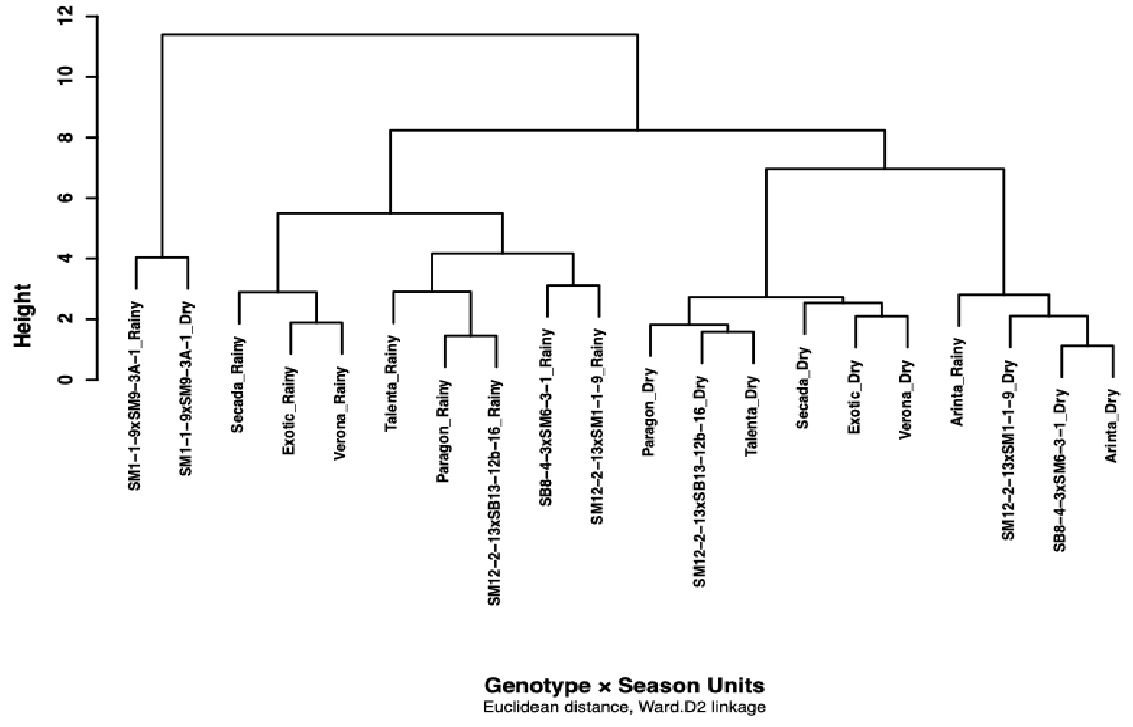
Fig 3. Results of Agglomerative Hierarchical Clustering (AHC) analysis of ten maize genotypes across two growing seasons. Rainy season (1: Exotic; 2: Paragon; 3: SM12 x SB13; 4: Talenta; 5: Secada; 6: SB8 x SM6; 7: SM12 x SM1; 8: Arinta; 9: Verona; 10: SM1 x SM9). Dry season (11: Exotic; 12: Paragon; 13: SM12 x SB13; 14: Talenta; 15: Secada; 16: SB8 x SM6; 17: SM12 x SM1; 18: Arinta; 19: Verona; 20: SM1 x SM9).
Table 6. Loadings of canopy and growth traits on the first two principal components (PC1 and PC2).
| Traits | PC1 | PC2 |
|---|---|---|
| Axillary Angle (AA) | -0.358 | -0.188 |
| Leaf Area Index (LAI) | 0.389 | 0.127 |
| Number of Leaves (NL) | 0.253 | 0.356 |
| Leaf Length (LL) | 0.416 | 0.103 |
| Leaf Width (LW) | 0.330 | 0.177 |
| Plant Height (PH) | 0.273 | 0.160 |
| Specific Leaf Area (SLA) | -0.377 | 0.296 |
| Leaf Area Ratio (LAR) | -0.293 | 0.481 |
| Relative Growth Rate (RGR) | 0.096 | 0.445 |
| Net Assimilation Rate (NAR) | 0.244 | -0.502 |
| Standard Deviation | 2.176 | 1.544 |
| Proportion of Variance | 0.473 | 0.238 |
| Cumulative Proportion | 0.473 | 0.712 |
| Eigenvalues | 4.735 | 2.385 |
and SM1 × SM9). With three replications, a total of 30 experimental units were established per season.
Each experimental unit consisted of two rows (15 plants per row). Five plants were used for growth and yield observations, while the remaining plants were used for destructive physiological measurements. Identical plot layout, plant spacing, and crop management practices were applied in both seasons to ensure a valid comparison of genotype performance across contrasting seasonal environments.
Procedures
The experiment was conducted on ten raised beds (1 m × 11.25 m), each representing one sweet corn genotype and replicated three times, resulting in an individual plot size of 3.75 m². Beds were spaced 80 cm apart to facilitate crop management. Prior to planting, organic manure was applied at 1 t ha⁻¹, and dolomite was incorporated at 2 t ha⁻¹ as a soil amendment.
Planting was carried out at a spacing of 25 cm × 75 cm, with each replicate consisting of 30 plants (90 plants per genotype per season). From each plot, three plants were randomly selected for growth and yield observations, while another three plants were used for destructive physiological measurements.
Crop management included irrigation every two days during rain-free periods, manual weeding two to three times before harvest, and fertilization using NPK at a rate of 300 kg ha⁻¹. Pest and disease control was applied selectively using fungicides and insecticides based on field infestation levels.
All procedures were implemented consistently during the rainy season (January–March 2024) and the dry season (June–August 2024) to ensure a valid comparison of genotype performance across seasons.
Observation of sweet corn growth components
Growth observations were conducted on five sample plants from each experimental unit. Plant height was measured from the soil surface to the growing point every two weeks, starting from two weeks after planting (WAP) up to eight WAP. The number of leaves was recorded by counting fully expanded leaves at the same observation intervals at 2, 4, 6, and 8 WAP.
At eight WAP, leaf morphological measurements were taken, including the length of the longest leaf and its maximum width, using a ruler. In addition, the leaf axil angle (axillary angle) was measured with a protractor during the same observation period.
Observation of sweet corn physiological components
Physiological component measurements of sweet corn were conducted destructively, using one plant from each experimental unit. The observed physiological parameters included Leaf Area Index (LAI), Net Assimilation Rate (NAR), Relative Growth Rate (RGR), Leaf Area Ratio (LAR), and Specific Leaf Area (SLA). The Leaf Area Index (LAI) was determined by cutting all leaves from the sampled plant and measuring the area of each leaf to obtain the total leaf area, which was then divided by the ground area (Susanti and Safrina, 2018). The Net Assimilation Rate (NAR) was calculated based on the difference in plant dry weight between two observation periods. Plants, including their roots, were oven-dried and weighed to obtain the final dry weight. This parameter represents the net CO₂ uptake by the plant after subtracting respiratory losses (Rajput et al., 2017). The Relative Growth Rate (RGR) was determined from the increase in dry weight per unit time, using the same dry weight measurement method as for NAR (Rajput et al., 2017). The Leaf Area Ratio (LAR) was obtained by comparing the total leaf area to the total plant dry weight, while the Specific Leaf Area (SLA) was calculated as the ratio between leaf area and leaf dry weight (Susanti and Safrina, 2018).
Observation of sweet corn reproductive components
Observations of the reproductive components of sweet corn were conducted on five sample plants from each experimental unit. The observed parameters included days to tasseling, days to silking, and days to harvest. The days to tasseling (anthesis date) were recorded as the number of days after planting (DAP) when 50% of the plants in each row had reached the anthesis stage, indicated by the emergence of pollen-shedding tassels. The days to silking were also measured in DAP, determined when 50% of the plants in each row exhibited the emergence of silks from the ear, indicating the onset of the female flowering stage. Meanwhile, the days to harvest were determined when the plants reached physiological maturity. Sweet corn was considered ready for harvest when the husks and leaves turned yellow, the silks turned brown, and the kernels no longer left an indentation when pressed with a fingernail.
Observation of sweet corn yield components
The yield components of sweet corn were evaluated through several parameters representing both the quantity and quality of the ears. The cob weight with husk (CWH) was measured by weighing the ears while still enclosed in their husks, whereas the cob weight without husk (CWoH) was obtained by weighing the ears after husk removal. The husk weight (HW) was determined separately by weighing the husks detached from the ears. In addition to weight-related parameters, morphometric traits of the ears were also measured, including cob length (CL) and cob diameter (CD) without husks. Cob length was measured as the distance from the base to the tip of the ear after husk removal, while cob diameter was measured at the thickest section of the ear using a precision measuring instrument.
Data analysis
Data were analyzed using Analysis of Variance (ANOVA), and mean separation was performed using the Honestly Significant Difference (HSD) test at the 5% significance level with PKBT Stat 3.1 (http://pbtstat.com/pkbt-stat/). Agglomerative Hierarchical Clustering (AHC) and Principal Component Analysis (PCA) were applied as exploratory multivariate analyses to examine trait associations and similarities among genotype–season combinations. Multivariate analyses were conducted using STAR software developed by the International Rice Research Institute (IRRI) (http://bbi.irri.org/products).
Conclusion
Seasonal variation significantly influenced the morphophysiological responses and yield performance of several IPB hybrid sweet corn genotypes. Differences in leaf number and leaf angle served as key indicators of adaptation to changing environmental conditions, whereas cob weight without husk (CWoH) reflected stable genetic productivity. Based on the overall analysis and harvest performance, the genotypes Secada and Paragon exhibited the highest yields and the most consistent performance across both seasons. Therefore, these genotypes are recommended as adaptive and high-yielding hybrids suitable for cultivation during both the rainy and dry seasons under tropical environmental conditions.
Acknowledgments
The authors would like to acknowledge the Indonesia Endowment Fund for Education (LPDP) and the National Research and Innovation Agency (BRIN), Indonesia, for financial support (underfunding of Riset dan Inovasi untuk Indonesia Maju year 2022-2023, Contract No. 76/IV/KS/11/2022 and 10279/IT3.L1/PT.01.03/P/B/2022) with Arya Widura Ritonga as the principal investigator.
Reference
Deng T, Wang JH, Gao Z, Shen S, Liang XG, Zhao X, Chen XM, Wu G, Wang X, and Zhou SL. 2023. Late split-application with reduced nitrogen fertilizer increases yield by mediating source–sink relations during the grain filling stage in summer maize. Plants, 12 (3). https://doi.org/10.3390/plants12030625.
Diouf I, Derivot L, Koussevitzky S, Carretero Y, Bitton F, Moreau L, and Causse M. 2020. Genetic basis of phenotypic plasticity and genotype × environment interactions in a multi-parental tomato population. J Exp Bot, 71 (18): 5365–5376. https://doi.org/10.1093/jxb/eraa265.
Fu-cheng Z, He-ping T, Li-quan J, Hai-liang H, Fei B, Wei-ping L, and Gui-yue W. 2022. Shading effects on the yield, quality, and sucrose-metabolizing enzyme activity of sweet corn during the filling stage. Afr J Agric Res, 18 (3): 169–177. https://doi.org/10.5897/ajar2021.15902.
Heryanto FSS, Wirnas D, and Ritonga AW. 2022. Diversity of twenty-three sweet corn (Zea mays L. saccharata) varieties in Indonesia. Biodiversitas, 23 (11): 6075–6081. https://doi.org/10.13057/biodiv/d231164.
Hou PF, Chang YT, Lai JM, Chou KL, Tai SF, Tseng KC, Chow CN, Jeng SL, Huang HJ, and Chang WC. 2020. Long-term effects of fertilizers with regional climate variability on yield trends of sweet corn. Sustainability, 12 (9). https://doi.org/10.3390/SU12093528.
Hu Y, Colantonio V, Müller BSF, Leach KA, Nanni A, Finegan C, Wang B, Baseggio M, Newton CJ, Juhl EM, Hislop L, Gonzalez JM, Rios EF, Hannah LC, Swarts K, Gore MA, Hennen BTA, Myers AM, Settles AM, and Resende MFR. 2021. Genome assembly and population genomic analysis provide insights into the evolution of modern sweet corn. Nat Commun, 12 (1). https://doi.org/10.1038/s41467-021-21380-4.
Humphrey V, Berg A, Ciais P, Gentine P, Jung M, Reichstein M, Seneviratne SI, and Frankenberg C. 2021. Soil moisture–atmosphere feedback dominates land carbon uptake variability. Nature, 592 (7852): 65–69. https://doi.org/10.1038/s41586-021-03325-5.
Jompuk C, Jitlaka C, Jompuk P, and Stamp P. 2020. Combining three grain mutants for improved-quality sweet corn. Agric Environ Lett, 5 (1). https://doi.org/10.1002/ael2.20010.
Li X, Zhuge S, Du J, Zhang P, Wang X, Liu T, Li D, Ma H, Li X, Nie Y, Liao C, Ding H, and Zhang Z. 2024. The molecular mechanism by which heat stress during the grain filling period inhibits maize grain filling and reduces yield. Front Plant Sci, 15. https://doi.org/10.3389/fpls.2024.1533527.
Liu G, Yang Y, Liu W, Guo X, Xue J, Xie R, Ming B, Wang K, Hou P, and Li S. 2020. Leaf removal affects maize morphology and grain yield. Agronomy, 10 (2). https://doi.org/10.3390/agronomy10020269.
Magar BT, Acharya S, Gyawali B, Timilsena K, Upadhayaya J, and Shrestha J. 2021. Genetic variability and trait association in maize (Zea mays L.) varieties for growth and yield traits. Heliyon, 7 (9). https://doi.org/10.1016/j.heliyon.2021.e07939.
Mei M, Siaga E, and Lakitan B. 2023. Perubahan morfofisiologis tanaman terung pada kondisi muka air tanah dangkal dan tergenang di fase generatif. J Ilmu Pertan Indones, 28 (2): 235–243. https://doi.org/10.18343/jipi.28.2.235.
Mendes KR, Batista SW, Dias PJ, Pereira MPS, Souza EV, Serrão JE, Granja JAA, Pereira EC, Gallacher DJ, Mutti PR, Silva DTC, Souza JRS, Costa GB, Bezerra BG, Silva CMS, and Pompelli MF. 2022. Leaf plasticity across wet and dry seasons in Croton blanchetianus (Euphorbiaceae) at a tropical dry forest. Sci Rep, 12 (1). https://doi.org/10.1038/s41598-022-04958-w.
Mustafa NR, Saleh G, and Kashiani P. 2021. Genetic potential of tropical sweet corn hybrids and combining ability among parental inbred lines. Aust J Crop Sci, 15 (10): 1279–1288. https://doi.org/10.21475/ajcs.21.15.10.p3189.
Paranhos J, Foshee W, Coolong T, Heyes B, Salazar GM, Kesheimer K, and Silva ALBR. 2023. Characterization of sweet corn production in subtropical environmental conditions. Agriculture 13 (6). https://doi.org/10.3390/agriculture13061156.
Patandean B, Chozin MA, Ritonga AW. 2025. Diversity of sweet corn canopy architecture for intercropping pattern suitability with cayenne pepper. J Trop Crop Sci, 12 (2), 314–326. https://doi.org/10.29244/jtcs.12.02.314-326.
Qi Y, Zhang Q, Hu S, Wang R, Wang H, Zhang K, Zhao H, Ren S, Yang Y, Zhao F, Chen F, and Yang Y. 2022. Effects of high temperature and drought stresses on growth and yield of summer maize during grain filling in North China. Agriculture, 12 (11). https://doi.org/10.3390/agriculture12111948.
Rathinavel K, Chandran S, Manoharan B. Doraiswamy U, Rajasekaran R, Zachariah JK, and Natesan S. 2022. Determining genetic variability of traits in backcross populations of sweet corn (Zea mays L. var. Saccharata). J Phytol, 14: 132–135. https://doi.org/10.25081/jp.2022.v14.8099.
Reddy SGM, Lal GM, Krishna TV, Reddy YVS, and Sandeep N. 2022. Correlation and path coefficient analysis for grain yield components in maize (Zea mays L.). Int J Plant Soil Sci: 24–36. https://doi.org/10.9734/ijpss/2022/v34i2331558.
Ren H, Qi H, Zhao M, Zhou W, Wang X, Gong X, Jiang Y, dan Li C. 2022. Characterization of source–sink traits and carbon translocation in maize hybrids under high plant density. Agronomy, 12 (4). https://doi.org/10.3390/agronomy12040961.
Revilla P, Anibas CM, and Tracy WF. 2021. Sweet corn research around the world 2015–2020. In Agronomy 11 (3). https://doi.org/10.3390/agronomy11030534.
Rozi F, Santoso AB, Mahendri IGAP, Hutapea RTP, Wamaer D, Siagian V, Elisabeth DAA, Sugiono S, Handoko H, Subagio H, and Syam A. 2023. Indonesian market demand patterns for food commodity sources of carbohydrates in facing the global food crisis. Heliyon, 9 (6). https://doi.org/10.1016/j.heliyon.2023.e16809.
Ruanjaichon V, Khammona K, Thunnom B, Suriharn K, Kerdsri C, Aesomnuk W, Yongsuwan A, Chaomueang N, Thammapichai P, Arikit S, Wanchana S, and Toojinda T. 2021. Identification of gene associated with sweetness in corn (Zea mays L.) by genome-wide association study (gwas) and development of a functional snp marker for predicting sweet corn. Plants, 10 (6). https://doi.org/10.3390/plants10061239.
Sanchez A, Mercado LM, Posada JM, and Smith WK. 2025. Seasonal ecophysiology of two páramo species: the dominance of light over water limitations. Front Plant Sci, 16. https://doi.org/10.3389/fpls.2025.1529852.
Sawangha M, Dermail A, Chankaew S, Simla S, Lertrat K, Suriharn K. 2023. Reciprocal cross effect over seasons on agronomic and yield traits in waxy corn under tropical savanna. Biodiversitas, 24 (7): 4120–4125. https://doi.org/10.13057/biodiv/d240750.
Sharma HP, Upadhyaya J, Shrestha J. 2021. Analysis of correlation and agro-morphological traits in single cross hybrids of maize. Russ J Agric Socio-Econ Sci, 117 (9): 143–149. https://doi.org/10.18551/rjoas.2021-09.16.
Stansluos AAL, Öztürk A, Niedbała G, Türkoğlu A, Haliloğlu K, Szulc P, Omrani A, Wojciechowski T, and Piekutowska M. 2023. Genotype–trait (gt) biplot analysis for yield and quality stability in some sweet corn (Zea mays L. saccharata sturt.) genotypes. Agronomy, 13 (6). https://doi.org/10.3390/agronomy13061538.
Susanti ED, Chozin MA, Ritonga AW, Sulistyowati D. 2023. Identification of morpho-physiological and yield traits of sweet corn hybrids at various shade levels. caraka tani: journal of sustainable Agriculture, 38 (2): 327–338. https://doi.org/10.20961/carakatani.v38i2.73567.
Tas T, and Mutlu A. 2021. Morpho-physiological effects of environmental stress on yield and quality of sweet corn varieties (Zea mays L.). PeerJ, 9. https://doi.org/10.7717/peerj.12613.
Utari VF, Chozin MA, Hapsari DP, dan Ritonga AW. 2023. Morphophysiological responses and tolerance of various sweet corn (Zea mays convar. saccharata) hybrids to shade stress. Biodiversitas, 24 (8): 4438–4447. https://doi.org/10.13057/biodiv/d240825.
Yan Y, Duan F, Li X, Zhao R, Hou P, Zhao M, Li S, Wang Y, Dai T, and Zhou W. 2024. Photosynthetic capacity and assimilate transport of the lower canopy influence maize yield under high planting density. Plant Physiol, 195 (4): 2652–2667. https://doi.org/10.1093/plphys/kiae204.
Yang Y, Guo X, Liu G, Liu W, Xue J, Ming B, Xie R, Wang K, Hou P, and Li S. 2021. solar radiation effects on dry matter accumulations and transfer in maize. Front Plant Sci, 12. https://doi.org/10.3389/fpls.2021.727134.