Australian Journal of Crop Science
Article | https://doi.org/10.21475/ajcs.26.20.06.pne152
Submitted: 09 October 2025 | Revised: 11 January 2026 | Accepted: 06 May 2026
Pages 460-467
Differential physiological responses of sugarcane genotypes to waterlogging and drought conditions
Mochamad Arief Soleh*, Santi Rosniawaty, Mira Ariyanti
Department of Agronomy, Faculty of Agriculture, Universitas Padjadjaran, Raya Bandung Sumedang St. KM 21, Jatinangor 45363, Indonesia
*Corresponding author: m.arief@unpad.ac.id
ORCID ID: http://orcid.org/0000-0002-6905-7174
Abstract: Water stress, whether caused by waterlogging or drought resulting from climate change, can significantly reduce sugarcane yield. To elucidate the physiological response of sugarcane under such conditions, four genotypes were evaluated under controlled waterlogged (WL) and drought (D) environments. Plants were cultivated in pots and subjected to WL and D treatments for 14 days. Stomatal conductance (gs) varied among the genotypes with a general trend of increasing gs under WL conditions and decreasing gs under D conditions over the treatment period. Notably, specific genotypes exhibited contrasting responses: one showed high gs under WL but low gs under D, while another maintained improved gs under both conditions, suggesting greater adaptability. Changes in gs between 0 and 7 days after treatment (DAT) were further quantified. One genotype, PS862, showed a 64% increase in gs under WL and a 75% decrease under D. In contrast, genotypes of PSJT941 exhibited a 5% decrease under WL and only a 49% decrease under D. Enhanced gs under both stress conditions correlated with higher photosystem II efficiency (Fv/Fm) and a lower crop water stress index (CWSI), indicating superior physiological resilience. These findings highlight genotypic variability in sugarcane response to water stress and identify candidates with potential for cultivation under water stressed environments.
Keywords: Abiotic stress tolerance, crop water stress index, drought stress, stomatal conductance, waterlogging stress.
Abbreviations: WL_Water Logging; D_drought; gs_Stomatal conductance; DAT_Days After Treatment; Fv/Fm_Quantum Yield of Photosystem II; CWSI_Crop Water Stress Index; PS862, PSJT941, Kidang Kencana_KK_sugarcane varieties; RBD_Randomized Block Design.
Introduction
Sugarcane is a major crop that provides a large amount of calories. Its calorie content is higher than that of other crops. Sugarcane is the primary source of sugar. Climate change affects sugarcane production, especially changes in rainfall distribution that lead to drought and flooding; some regions receive insufficient rainfall, while others receive adequate rainfall. Soil moisture fluctuations in agricultural fields (e.g., rainfed fields) are likely to occur during the growing season because of unpredictable rainfall distribution, leading to adverse effects on crop performance and yield (Lobell et al., 2011; Lakshmanan & Robinson, 2014; Noya et al., 2018; Mina et al., 2021). Many studies have reported the effects of water stress on plant performance; however, investigations of the combined effect of two water stress factors, that is, waterlogging and drought, on genotypes of a single species are still rare, especially for sugarcane.
Waterlogging often occurs due to poor soil drainage during heavy rainfall, whereas drought stress is frequently evident in rainfed fields with low rainfall intensity. Drought and waterlogging are the significant factors that reduce the yield of sugarcane (Ferreira et al., 2017), maize, wheat (Daryanto et al., 2016), and soybean (Mittler, 2002; Valliyodan et al., 2014), affecting crop productivity worldwide (Wang et al., 2003; Rampino et al., 2006). Sugarcane is a C4 species, that is, a photosynthetic pathway type, adapted to warm climates; it shows a relatively high-water demand and is intolerant of water deficits (Lakshmanan & Robinson, 2014). It needs to be evaluated under water stress caused by both waterlogging and drought to develop improved traits for future breeding projects. Stomatal conductance (gs) is an essential trait for physiological evaluation, because it shows clear responses to environmental changes (Kröber et al., 2015). C4 species are known to exhibit efficient photosynthesis due to their higher water-use efficiency compared to C3 species (Danielle et al., 2014). Under natural conditions, the stomatal conductance of C4 species is 2 to 6-fold lower than that of C3 species (Knapp, 1993). Although the stomatal conductance of C4 is lower than that of C3 species, this trait is an advantage in fixing CO2 more and transpiring water from leaves so that plants can improve the metabolism process, especially in waterlogging conditions. Even in drought conditions, stomatal opening remains an advantageous trait for tolerant plants. The tolerance trait, as indicated by greater stomatal opening, suggests that metabolic processes continue to function under stress conditions.
There are three mechanisms of crop adaptability to environmental stress: i.e., escape, tolerance, and avoidance (Turner et al., 2001; Nicholas, 2015). A decrease in stomatal conductance is an initial response of a crop that reduces metabolic activity by limiting CO2 diffusion from the atmosphere to the leaves (Cornic, 1994; Ocheltree et al., 2014) and decreasing Fv/Fm (Lawlor and Cornic, 2002; Shu et al., 2022). Fv/Fm represents the maximum quantum yield of photosystem II (PSII), where the variable fluorescence (Fv) is the difference between the maximum (Fm) and minimum (Fo) fluorescence emissions in dark-adapted leaves (Kitajima and Butler, 1975). Under drought stress, C4 species, as well as C3 species, are reported to have low gs, even if drought-tolerant crops show low gs under water deficit as well as under waterlogging. On the other hand, gs responses have been reported to decrease under waterlogging and drought, for example, in seashore mallow by up to 27% (Zhou et al., 2012) and in sugarcane by up to 50% (Soleh et al., 2018).
Stomatal conductance (gs) typically decreases under environmental stress, including water stress (Lawson and Blatt, 2014). Therefore, enhancing gs regulation is a potential strategy to improve crop stress resilience. The development of advanced traits related to gs has been explored as a means to enhance crop performance under adverse conditions (Flexas et al., 2013). Additionally, improvements in abiotic stress tolerance, particularly in response to drought and waterlogging, have been extensively evaluated in cereal crops to identify the adaptive physiological and morphological traits that contribute to stress resilience (Powell et al., 2012; Zhang et al., 2020). One genotype may show tolerance to only one or two water-stress factors, either waterlogging or drought. Genotypes that are tolerant of waterlogging may be more resistant to drought, and vice versa.
Under water-stress conditions, considerable variation exists among plant genotypes, including sugarcane, in their physiological traits. In this study, stomatal conductance, chlorophyll fluorescence, and root growth were evaluated in several sugarcane genotypes grown under WL and D to identify genotypes with improved physiological performance and adaptation to these contrasting water stresses.
Results
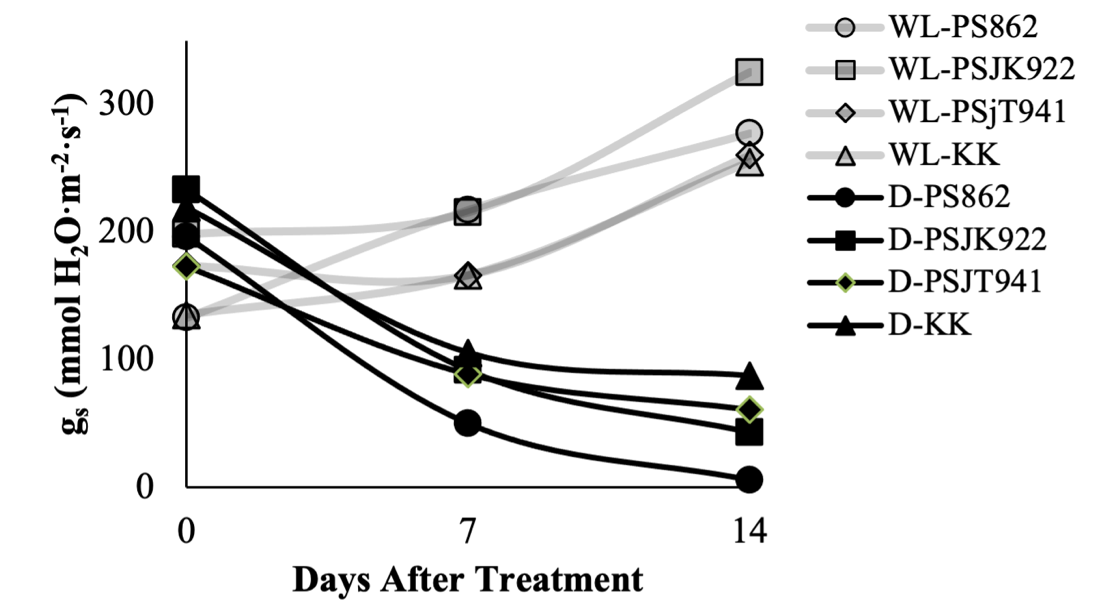
The gs response varied among the four sugarcane genotypes at 0, 7, and 14 DAT in both WL and D treatments (Figure 1). At 0 DAT in the WL treatment, gs ranged from 133 mmol H2O·m-2·s-1 in PS862 to 198.3 mmol H2O·m-2·s-1 in PSJK922, while in the D treatment, gs ranged from 173.7 mmol H2O·m-2·s-1 in PSJT941 to 223.3 mmol H2O·m-2·s-1 in PSJK922. At 7 DAT in WL, gs ranged from 166.3 mmol H2O·m-2·s-1 in KK to 217.5 mmol H2O·m-2·s-1 in PS862, while in the D treatment, gs ranged from 50 mmol H2O·m-2·s-1 in PS862 to 105.6 mmol H2O·m-2·s-1 in KK. At 14 DAT in the WL treatment, gs ranged from 255.1 mmol H2O·m-2·s-1 in KK to 326.4 mmol H2O·m-2·s-1 in PSJK922, while in the D treatment, gs ranged from 5.6 mmol H2O·m-2·s-1 in PS862 to 87.5 mmol H2O·m-2·s-1 in KK. gs showed a tendency to increase under WL treatment at 7 and 14 DAT, except in PSJT941 genotypes at 7 DAT. Conversely, in the D treatment, gs decreased sharply, especially in the 14 DAT genotype of PS862, which had the lowest gs (Figure 1). In a comparison of gs among the genotypes tested, there were genotypes with higher gs in WL but lower in D, and conversely higher in D but lower in WL, which is a normal trend that tends to respond to water stress, as shown in PS862 and PSJK922 at 7 and 14 DAT, respectively (Figure 1). The genotype PS862, which had the highest gs under WL conditions, showed a 63.6% increase; however, under D conditions, it decreased to 74.4%. Although gs slightly decreased in PSJT941 at 7 DAT in the WL treatment, all genotypes showed an increase at 14 DAT, whereas in the D treatment, all genotypes showed a decrease at both 7 and 14 DAT.
Figure 1. Temporal changes in stomatal conductance (gs, mmol H₂O m⁻² s⁻¹) of four sugarcane genotypes subjected to waterlogging (WL) and drought (D) conditions over 14 days. Measurements were taken at 0, 7, and 14 days after treatment (DAT). Grey lines denote genotypes under WL conditions, while black lines represent those under D conditions. Data points indicate the mean values of four biological replicates per genotype. A consistent decline in gs was observed under drought stress, whereas under WL conditions, responses were variable, including partial recovery in specific genotypes.
Table 1. Stomatal conductance (gs) of four sugarcane genotypes at 0 and 7 days after treatment (DAT) under waterlogging and drought stress, including percentage difference.
| Genotypes | gs at 0 DAT (mmol m-2s-1) |
gs at 7 DAT (mmol m-2s-1) |
% Difference | Stress Conditions |
| PS862 | 133.0 | 217.5 | +63.6 | WL |
| PSJK922 | 198.3 | 215.5 | +8.7 | WL |
| PSJT941 | 176.0 | 166.4 | -5.4 | WL |
| KK | 135.4 | 166.3 | +22.8 | WL |
| PS862 | 195.7 | 50.0 | -74.5 | D |
| PSJK922 | 223.3 | 91.9 | -58.9 | D |
| PSJT941 | 173.7 | 89.0 | -48.7 | D |
| KK | 219.3 | 105.6 | -51.8 | D |
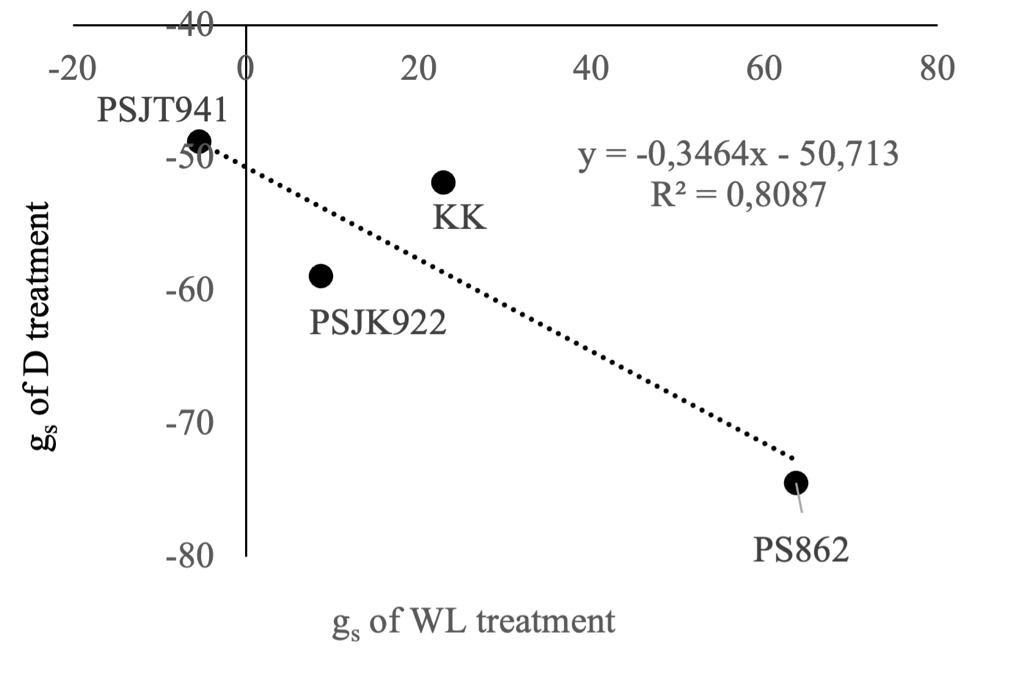
Figure 2. Percentage change in stomatal conductance (gs) from 0 to 7 days after treatment (DAT) in four sugarcane genotypes under waterlogging (WL) and drought (D) stress. The x-axis represents the percentage change in gs under WL conditions, while the y-axis represents the percentage change under D conditions. Data points correspond to the mean values from four biological replicates per genotype. A negative linear regression (y = −0.3464x − 50.713; R² = 0.8087) indicates a strong inverse relationship between gs responses to WL and D, suggesting a physiological trade-off across genotypes.
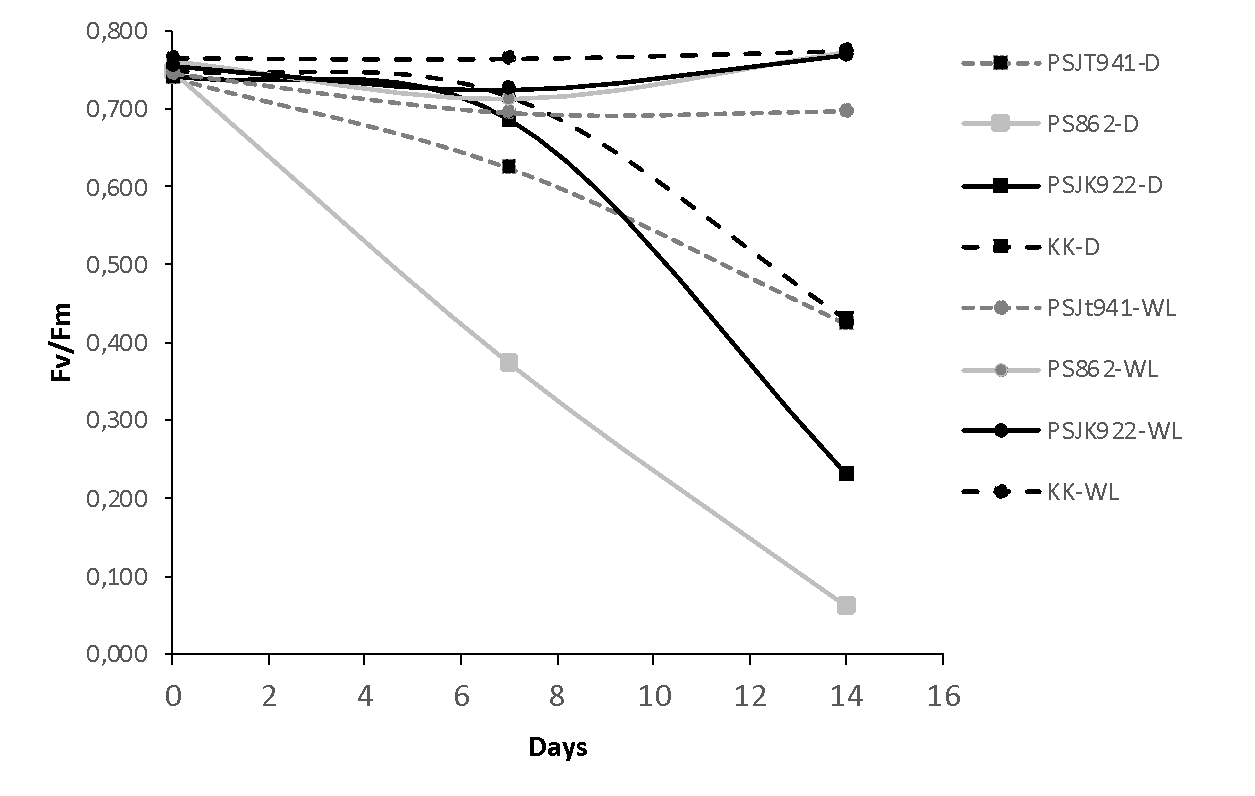
Figure 3. Changes in maximum quantum efficiency of photosystem II (Fv/Fm) in four sugarcane genotypes subjected to drought (D) and waterlogging (WL) at 0, 7, and 14 days after treatment (DAT). Square markers represent genotypes subjected to drought stress, and round markers represent genotypes subjected to waterlogging. Each data point represents the average of four biological replicates.
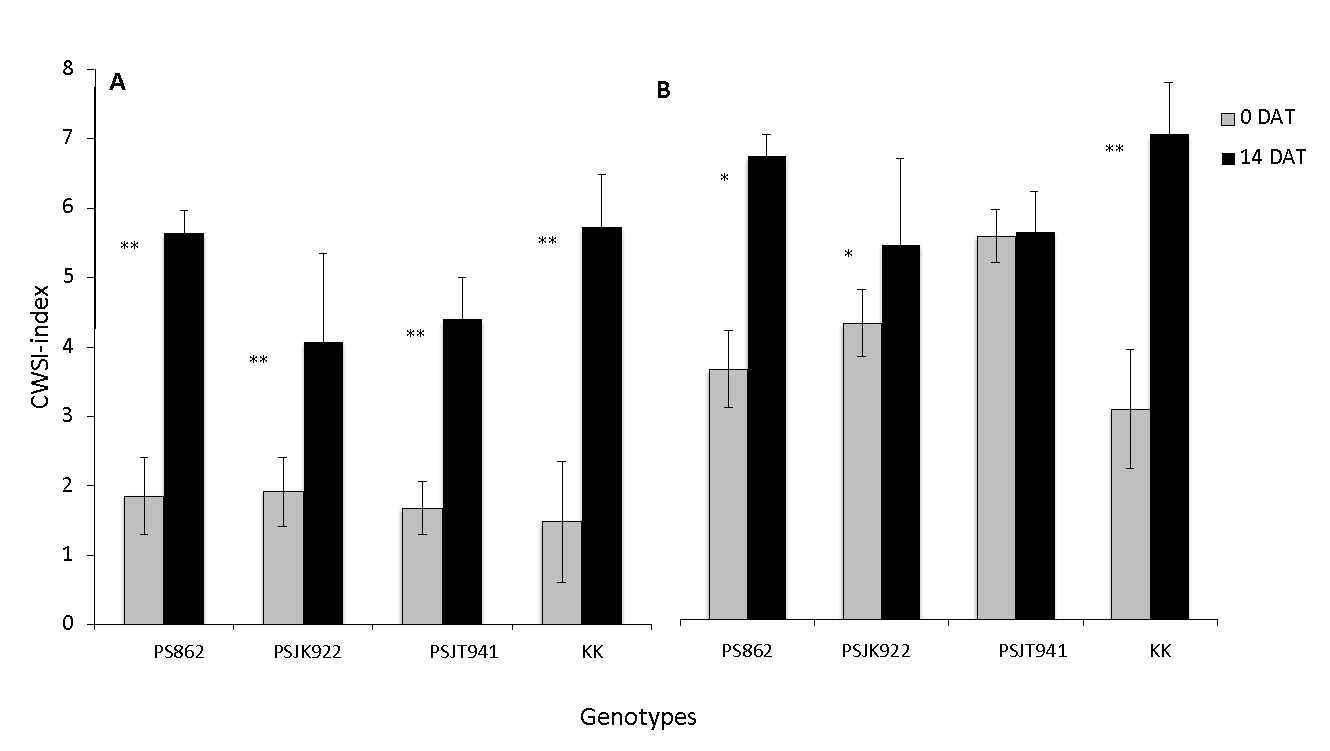
Figure 4. Crop Water Stress Index (CWSI) between WL (A) and D (B) among four genotypes at 0 and 14 DAT. Vertical bars indicate the SE of five plants. * and **: significantly different at the 5% and 1% levels between WL and D.
The gs percentage difference of the four genotypes between 0 and 7 DAT showed an increase in WL treatment, except in the PSJT941 genotype, ranging from -5.4% in PSJT941 to 63.6% in PS862; however, gs of all genotypes decreased in the D treatment, ranging from -48.7% in PSJT941 to -74.5% in PS862 (Table 1). The gs performances of PS862, PSJK922, and KK were better under WL conditions; even if KK improved under D conditions, PS862 had the lowest gs response under D conditions. The genotype PSJT941 showed a slightly negative gs at WL but had the highest gs in D among the genotypes.
The Fv/Fm values of the four genotypes were above 0.7 under the WL treatment, while those under the D treatment were above or equal to 0.7 at 7, except in PS862, which was extremely low compared to the others. However, Fv/Fm at the 14 DAT was sharply decreased in all genotypes under D treatment (Figure 3).
The CWSI of genotypes in the WL treatment at 0 and 14 DAT was significantly increased; the lowest increase was in PSJK922, and the highest increase was in PS862 and KK (Figure 4a). CWSI under the D treatment showed a significant increase in all genotypes, except PSJT941. Higher increases were observed for PS862 and KK (Figure 4b).
Aboveground dry matter tended to be higher in the genotypes under WL treatment than under D for PSJT941 and PS862; conversely, the genotypes PSJK922 and KK tended to be higher in D than in WL (Figure 5a). Some genotypes showed consistent responses in aboveground dry matter and root weight to both WL and D treatments, for example, PS862, PSJK922, and KK, except for PSJT941 (Figure 5a and 5b).
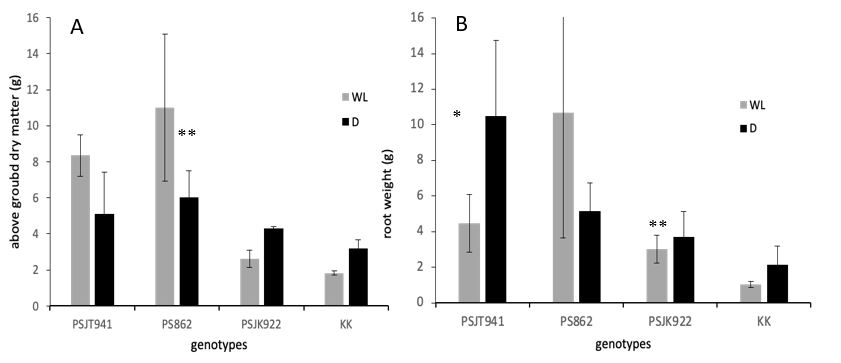
Figure 5. Aboveground dry matter (A) and root volume (B) among genotypes at the pot experiment under WL and D treatments. Vertical bars indicate the SE of four plants. * and **: significantly different at the 5% and 1% levels between WL and D.
Discussion
Under natural conditions, soil moisture fluctuates between wet and drought conditions due to uneven precipitation distribution, poor drainage, and lack of irrigation, especially in rainfed fields. These conditions can affect crop growth performance and yield (Suralta and Yamauchi, 2008; Lakshmanan & Robinson, 2014). Drought or waterlogging has the most substantial negative Influence on sugarcane (Ferreira et al., 2017). In this study, the sugarcane genotypes grown under WL and D conditions showed genetic differences in gs in their uppermost leaves. The gs value was different between 7 and 14 DAT in both WL and D treatments. This variation may partly be due to some genotypes being adapted to the two water-stress regimes via the gs response. The gs of the sugarcane genotypes decreased sharply in the D treatment and increased slightly in WL at 7 and 14 DAT. In the gs percentage difference between 0 and 7 DAT across genotypes (Table 1), PSJT941 appeared tolerant in D and/or WL conditions; however, PS862 was the most tolerant in WL. Under drought conditions, one genotype showed a rapid 74.5% reduction in gs within 7 days, indicating a highly conservative water-use strategy but potentially at the cost of reduced carbon assimilation. Conversely, another genotype exhibited only a 48.7% reduction in stomatal conductance, maintaining moderate stomatal function under drought, which may support sustained photosynthetic activity and growth under mild stress conditions (Chaves et al., 2009).
In response to short-term drought stress, plants adapt by closing their stomata to minimize water loss. However, for long-term adaptation to drought, plants regulate the accumulation of osmolytes in their roots to maintain metabolic function while preventing excessive water loss (Chaves et al., 2009). The reduction in gs is a well documented plant response aimed at conserving water by limiting transpiration (Flexas et al., 2004).
In addition, plants regulate stomatal closure under waterlogging conditions owing to oxygen deficiency, which affects metabolic processes (Bailey-Serres, & Voesenek, 2010). During the initial phase of waterlogging, plant stomata tended to remain open to facilitate the evaporation of excess water. However, studies suggest that within approximately 24 h of soil flooding, stomatal conductance and transpiration rate decrease by 30% to 40%, indicating a regulatory response to water stress (Else et al., 1995). Other studies have shown that plant stomata close at critical stress levels and reopen later. In contrast, tolerant plants usually keep stomata closed for prolonged periods under stress, as reported in Fraxinus pennsylvanica Marsh. The stomata closed rapidly following waterlogging but reopened after 2 weeks of waterlogging (Sena and Kozlowski, 1980); however, stomata remained closed for extended periods in species tolerant of waterlogging (Kuai et al., 2014).
The gs responses of the genotypes under the two water treatments were opposite; in the WL treatment, gs gradually increased at 7 and 14 DAT, although genotypes PSJT941 and KK showed the slowest responses. At the same time, the gs values of PSJT941 and KK under D conditions were relatively higher than those of PS862 and PSJK922 (Figure 1). This result suggests that PSJT941 or KK may be tolerant of the conditions in D and/or WL, especially PSJT941, which showed a slight decrease in gs, i.e., 5% and 49% under WL and D, respectively (Table 1). Genotypes PS862 and PSJK922 may be tolerant to WL. The differences in gs between the genotypes may be partly correlated with CWSI (Figure 4), which is high in genotypes intolerant of water stress and low in those tolerant of water stress. Canopy temperature is highly correlated with water potential (DeJonge et al., 2015; Anda et al., 2021), and stomatal conductance modulates water deficit, which affects crop yield (Dominique, 2015). Canopy temperature increases when gs decreases owing to environmental changes, such as water stress. Stomatal closure is the initial response of plants to reduced metabolic activity under stressful conditions (Nicholas, 2015).
Genotypes PSJT941 and PS862 showed higher gs under D and WL conditions, respectively; therefore, their metabolic activity was higher than that of the other genotypes. An increase in gs is typically accompanied by an increase in the maximum quantum yield of photosystem II (Fv/Fm), which implies a more integrated stress tolerance mechanism that balances water loss regulation with photochemical performance (Zhang et al., 2022). In the present study, most genotypes with higher gs also exhibited a greater increase in Fv/Fm under both WL and D treatments. However, in the KK genotype, higher gs was not associated with an increase in Fv/Fm under WL conditions (Figures 1 and 3), as reported in a previous study (Soleh et al., 2018). This might be due to potential compensatory mechanisms (e.g., non-photochemical quenching). The tendency for higher gs values is partially correlated with increased aboveground dry matter (Munns and Tester, 2008). For example, genotype PS862 exhibited both higher gs and aboveground dry matter under WL conditions, suggesting its tolerance to this stress. In contrast, PSJT941 showed high aboveground dry matter under both WL and D conditions, indicating its adaptability to both environments. Furthermore, genotypes capable of adapting to both WL and D conditions, such as PS862 and PSJT941, exhibited greater root weights, which may contribute to their resilience under stress (Comas et al., 2013).
The stomatal response to D was followed by a change in leaf sugar content (data not shown); genotypes with higher gs also had higher sugar content. A decrease in the leaf sugar content during D stress may inhibit the photosynthetic activity of a plant that is susceptible to D. However, there was no decrease in the leaf soluble content of a plant that is resistant to D (Doan et al., 2019).
Morphological traits, particularly root development, correlate with tolerance to water stress. For instance, genotype PS862, which is suspected to be tolerant to waterlogging (WL) conditions, exhibited higher root and aboveground dry matter weights than the other genotypes. Meanwhile, under drought (D) conditions, PSJT941 demonstrated greater root weight than the other genotypes. This suggests that under water stress, plants tend to allocate more resources to root development than to shoot growth to enhance water uptake and stress adaptation (Comas et al., 2013). Plants subjected to waterlogging or flooding form adventitious roots much more readily than those under subterranean conditions (Nishiuchi et al., 2012).
Sugarcane (Saccharum spp.), a C4 species adapted to warm climates, exhibits varying tolerance to water stress. Studies have suggested that sugarcane is more tolerant to waterlogging than drought under moderate water stress, as its C4 photosynthetic pathway allows efficient carbon assimilation even under suboptimal conditions (Wahid et al., 1997). However, extremely low soil moisture levels rapidly lead to reduced gs, which negatively affects metabolic activity and dry matter production (Smith et al., 2005). Nevertheless, maintaining gs under moderate water stress may help to minimize metabolic suppression, thereby reducing dry matter loss (Inman-Bamber and Smith, 2005).
Materials and Methods
Four sugarcane genotypes PS 862, PSJK 922, PSJT 941, and Kidang Kencana (KK), were selected from the Jatitujuh sugarcane plantation in Majalengka District, West Java Province, Indonesia. The experiment was arranged in a Randomized Block Design (RBD) with treatments and three replications, with one seedling planted per pot. A total of 48 pots were prepared for each water treatment: waterlogging (WL) and drought (D). The plants were grown in plastic pots measuring 25 × 25 × 50 cm, with a spacing of 70 × 70 cm between pots. Unsterilized field soil (Fluventic Eutrudepts) was used as the growing medium. Each pot received 20 g of NPK fertilizer (15:15:15). The experiment was conducted in a vinyl-covered greenhouse at the Experimental Station of the Faculty of Agriculture, Universitas Padjadjaran (6°55′13″S, 107°46′24″E; altitude: 740 m), from October 2018 to January 2019. For the WL treatment, pots were submerged in larger water-filled containers to maintain soil saturation for 14 days, starting 1.5 months after planting. For the D treatment, irrigation was withheld entirely for the same 14-day period. Following the stress period, all plants were rewatered under normal conditions for two weeks.
Stomatal conductance measurement
Stomatal conductance was measured using a leaf porometer (Decagon Devices Inc., USA) in four plants of each genotype. Measurements were made at 0, 7, and 14 days after treatment (DAT) in WL and D or at the vegetative stage at 1.5 months after growth. Measurements were taken from the second uppermost leaf before noon, when the intensity of sunlight was sufficient for photosynthesis. The percentage difference in gs among genotypes at 0 and 7 DAT under WL and D conditions was subsequently calculated.
Chlorophyll fluorescence measurement (Fv/Fm)
Fluorescence induction was measured with a fluorometer (Handy PEA, Hansatech Instruments Ltd., UK) for the four genotypes in the WL and D treatments at 0, 7, and 14 DAT at the vegetative stage (at 1.5 months of age). Five leaves were collected for each genotype. During the measurements, all leaves were dark-adapted for 5–10 min and then exposed to high light at 1500 µmol·m-2·s-1.
Shoot dry weight and root volume
Three months after growth, all genotypes were sampled and oven-dried at 60 °C for 72 h to evaluate shoot and root dry weight; root volume was measured under wet conditions using a water cylinder. Plant samples were separated into shoots and roots, and then weighed. These parameters were measured to determine which morphological trait was most affected by the WL and D treatments.
Crop water stress index (CWSI)
To evaluate the water stress index for the genotypes, we adopted the equation proposed by Idso et al. (1981):
CWSI = Tc – Ta,
Where Tc is the canopy temperature and Ta is the air temperature. A positive CWSI value indicates that the crop is under stress, whereas a negative value indicates that no stress occurs. The CWSI was calculated between 0 and 14 DAT.
Statistical analyses
The experimental design was a randomized block design. Shoot and root weights and shoot: root ratios were obtained for four plants from each genotype and then averaged and analyzed using ANOVA. SPSS statistical program (version 21; SPSS Inc., San Rafael, CA, USA) was used for all analyses.
Conflict of Interest
“The authors declare that there are no conflicts of interest.”
Acknowledgements
We thank Hibah Internal Unpad in 2018. We are grateful to the Ministry of Research, Technology, and Higher Education of the Republic of Indonesia (Ristek-Dikti) for the post-doctoral program in 2019.
References
Anda A, Simon B, Soós G, Silva TA & Menyhart L (2021) Water stress modifies canopy environment and qualitative and quantitative yield components in two soybean varieties. Irrigation Science 39: 549–566.
Bailey-Serres J & Voesenek LACJ (2010) Life in the balance: a signaling network controlling survival of flooding. Current Opinion in Plant Biology 13(5): 489–494.
Chaves MM, Flexas J & Pinheiro C (2009) Photosynthesis under drought stress: regulation by osmotic adjustment and antioxidant defense. Plant, Cell & Environment 32(12): 1584–1600.
Comas LH, Becker SR, Cruz VMV, Byrne PF & Dierig DA (2013) Root traits contributing to plant productivity under drought. Frontiers in Plant Science 4: 442.
*Cornic G (1994) Drought stress and high light effects on leaf photosynthesis. In: Baker NR & Bowyer JR (eds) Photoinhibition of photosynthesis: from molecular mechanisms to the field. BIOS Scientific Publisher, Oxford.
Way DA, Katul GG, Manzoni S & Vico G (2014) Increasing water use efficiency along the C3 to C4 evolutionary pathway: a stomatal optimization perspective. Journal of Experimental Botany 65(13): 3683–3693.
Daryanto S, Wang L & Jacinthe PA (2016) Global synthesis of drought effects on maize and wheat production. PLoS ONE 11(5): e0156362.
DeJonge KC, Taghvaeian S, Trout TJ & Comas LH (2015) Comparison of canopy temperature-based water stress indices for maize. Agricultural Water Management 156: 51–62.
Doan D, Toshihiro M & Takeo Y (2019) Effect of various drought stresses and subsequent recovery on proline, total soluble sugar and starch metabolisms in rice (Oryza sativa L.) varieties. Plant Production Science 22(4): 530–545.
Roche D (2015) Stomatal conductance is essential for higher yield potential of C3 crops. Critical Reviews in Plant Sciences 34(4): 429–453.
Else MA, Coupland D, Dutton L & Jackson MB (1995) Root signals and stomatal closure in flooded tomato plants. Plant Physiology 70(5): 1508–1513.
Ferreira THS, Tsunada MS, Bassi D, Araújo P, Mattiello L, Guidelli G, Righetto G, Gonçalves V, Lakshmanan P & Menossi M (2017) Sugarcane water stress tolerance mechanisms and its implications on developing biotechnology solutions. Frontiers in Plant Science 8: 1077.
Flexas J, Bota J, Loreto F, Cornic G & Sharkey TD (2004) Diffusive and metabolic limitations to photosynthesis under drought and salinity in C3 plants. Plant Biology 6(3): 269–279.
Flexas J, Barbour MM, Brendel O, Cabrera HM, Carriquí M, Gago J & Medrano H (2013) Mesophyll diffusion conductance to CO₂: an unappreciated central player in photosynthesis. Plant Science 193: 70–84.
Idso SB, Jackson RD, Pinter PJ Jr, Reginato RJ & Hatfield JL (1981) Normalizing the stress degree day for environmental variability. Agricultural Meteorology 24: 45.
Inman-Bamber NG & Smith DM (2005) Water relations in sugarcane and response to water deficits. Field Crops Research 92(2–3): 185–202.
Kitajima M & Butler WL (1975) Quenching of chlorophyll fluorescence and primary photochemistry in chloroplasts by dibromothymoquinone. Biochimica et Biophysica Acta 376: 105–115.
Knapp AK (1993) Gas exchange dynamics in C3 and C4 grasses: consequences of differences in stomatal conductance. Ecology 74: 113–123.
Kröber W, Plath I, Heklau H & Bruelheide H (2015) Relating stomatal conductance to leaf functional traits. Journal of Visualized Experiments 104: 52738.
Kuai J, Liu Z, Wang Y, Meng Y, Chen B, Zhao W, Zhou Z & Oosterhuis MD (2014) Waterlogging during flowering and boll forming stages affects sucrose metabolism in the leaves subtending the cotton boll and its relationship with boll weight. Plant Science 223: 79–98.
*Lakshmanan P & Robinson N (2014) Stress physiology: abiotic stresses. In: Moore PH & Botha FC (eds) Sugarcane: physiology, biochemistry, and functional biology. John Wiley & Sons, Chichester, pp. 411–434.
Lawlor DW & Cornic G (2002) Photosynthetic carbon assimilation and associated metabolism in relation to water deficits in higher plants. Plant, Cell & Environment 25: 275–294.
Lawson T & Blatt MR (2014) Stomatal size, speed, and responsiveness impact on photosynthesis and water use efficiency. Plant Physiology 164(4): 1556–1570.
Lobell DB, Bänziger M, Magorokosho C & Vivek B (2011) Nonlinear heat effects on African maize as evidenced by historical yield trials. Nature Climate Change 1: 42–45.
Mina D, Patil SB, Kumar S, Kehel Z & Wery J (2021) Performance of elite genotypes of barley, chickpea, lentil, and wheat under conservation agriculture in Mediterranean rainfed conditions. Experimental Agriculture 57: 126–143.
Mittler R (2002) Oxidative stress, antioxidants and stress tolerance. Trends in Plant Science 7: 405–410.
Munns R & Tester M (2008) Mechanisms of salinity tolerance. Annual Review of Plant Biology 59: 651–681.
Nicholas JK (2015) The evolution of drought escape and avoidance in natural herbaceous populations. Plant Science 234: 155–162.
Nishiuchi S, Yamauchi T, Takahashi H, Kotula L & Nakazono M (2012) Mechanisms for coping with submergence and waterlogging in rice. Rice 5: 2.
Noya I, González-García S, Bacenetti J, Fiala M & Moreira MT (2018) Environmental impacts of the cultivation-phase associated with agricultural crops for feed production. Journal of Cleaner Production 172: 3721–3733.
Ocheltree TW, Nippert JB & Prasad PVV (2014) Stomatal responses to changes in vapor pressure deficit reflect tissue-specific differences in hydraulic conductance. Plant, Cell & Environment 37: 132–139.
Powell N, Ji X, Ravash R, Edlington J & Dolferus R (2012) Yield stability for cereals in a changing climate. Functional Plant Biology 39: 539–552.
Rampino P, Pataleo S, Gerardi C, Mita G & Perrotta C (2006) Drought stress response in wheat: physiological and molecular analysis of resistant and sensitive genotypes. Plant, Cell & Environment 29: 2143–2152.
Sena GAR & Kozlowski TT (1980) Growth responses and adaptations of Fraxinus pennsylvanica seedlings to flooding. Plant Physiology 66: 267–271.
Shu YL, Po-An C & Bing WZ (2022) The stomatal conductance and Fv/Fm as the indicators of stress tolerance of avocado seedlings under short-term waterlogging. Agronomy 12: 1084.
Smith DM, Inman-Bamber NG & Thorburn PJ (2005) Growth and function of the sugarcane root system. Field Crops Research 92(2–3): 169–183.
Soleh M, Mira A, Intan RD & Kadapi M (2018) Chlorophyll fluorescence and stomatal conductance of ten sugarcane varieties under waterlogging and fluctuating light intensity. Emirates Journal of Food and Agriculture 30: 935–940.
Suralta RR & Yamauchi A (2008) Root growth, aerenchyma development, and oxygen transport in rice genotypes subjected to drought and waterlogging. Environmental and Experimental Botany 64: 75–82.
Turner NC, Wright GC & Siddique KHM (2001) Adaptation of grain legumes (pulses) to water-limited environments. Advances in Agronomy 71: 193–271.
Valliyodan B, Van TTT, Alves JD, de Fátima P, Goulart P, Lee JD, Fritschi FB, Rahman MA, Islam R, Shannon JG & Nguyen HT (2014) Expression of root-related transcription factors associated with flooding tolerance of soybean (Glycine max). International Journal of Molecular Sciences 15: 17622–17643.
Wahid A, Rasul E, Rao AR & Iqbal R (1997) Germination and seedling growth of sugarcane in relation to temperature and moisture. Biologia Plantarum 39(1): 123–130.
*Wang E, van Oosterom E, Meinke H, Asseng S, Robertson M, Huth N, Keating B & Probert M (2003) The new APSIM-Wheat model: performance and future improvements. In: Solutions for a better environment. Proceedings of the 11th Australian Agronomy Conference, Geelong, Victoria.
Zhang J, Zhang S, Cheng M, Jiang H, Zhang X, Peng C & Jin J (2020) Effect of waterlogging stress on root morphology, physiology, and miRNA-mediated molecular adaptation in soybean. International Journal of Molecular Sciences 21(18): 6203.
Zhang L, Wang Y, Li H & Liu B (2022) Stomatal conductance and photochemical efficiency responses to environmental stress in crop plants. Agronomy 12(5): 1084.
Zhou J, QZ Anguo, Wang YC, Shu W & Pei Q (2012) Adventitious root growth and relative physiological responses to waterlogging in the seedlings of seashore mallow (Kosteletzkya virginica), a biodiesel plant. Australian Journal of Crop Science 6: 73–80.