
Australian Journal of Crop Science
Article | https://doi.org/10.21475/ajcs.26.20.07.pne163
Submitted: 30 October 2025 | Revised: 20 January 2026 | Accepted: 11 May 2026
Pages 540-549
Temporal erosion of genetic diversity in Thailand’s Saccharum spontaneum populations revealed by microsatellite markers
Anupong Wongtamee1,2,*, Supansa Chinaworn3 and Tonapha Pusadee4,5
1Department of Agricultural Sciences, Faculty of Agriculture, Natural Resources and Environment, Naresuan University, Phitsanulok 65000, Thailand
2Center of Knowledge and Technology for Cane and Sugar, Faculty of agro-industry, Kasetsart University, 50 Ngamwongwan Road, Ladyao, Chatuchak, Bangkok 10900 Thailand
3Department of Plant Production Technology, Faculty of Agriculture and Natural Resources, Rajamangala University of Technology Tawan-Ok, Bangpra Campus, Chon buri 20110, Thailand
4Department of Plant and Soil Sciences, Faculty of Agriculture, Chiang Mai University, Chiang Mai 50200, Thailand
5Agrobiodiversity in Highland and Sustainable Utilization Research Group, Faculty of Agriculture, Chiang Mai University, Chiang Mai 50200, Thailand
*Corresponding author: anupongw@nu.ac.th
Abstract: Understanding temporal shifts in genetic diversity is critical for maintaining wild sugarcane germplasm. This study used 30 simple sequence repeat (SSR) loci to investigate genetic erosion in Saccharum spontaneum populations in lower northern Thailand over three collection periods (2017, 2019 and 2023). A total of 40 populations representing 15 sampling locations across four provinces in lower northern Thailand were analyzed. These populations were selected to encompass the major lowland habitats of Saccharum spontaneum (floodplains, riverbanks, canals, and swamps), providing an ecologically representative subset of Thai wild sugarcane populations for temporal genetic analysis. Polymorphism, gene diversity, and population structure were investigated in 40 populations across four provinces. The findings revealed a gradual decline in genetic diversity over time, consistent with demographic contraction and habitat fragmentation rather than directional selection, with polymorphic loci (PL) and Nei's gene diversity (h) dropping by 15-20%. When compared to 2017 and 2019, the 2023 populations had lower heterozygosity and narrower allelic richness. AMOVA analysis revealed that 50-52% of total variation occurred within populations, while 33-37% was partitioned among collection years and habitat-size classes (ΦPT = 0.33-0.37; P < 0.001). This indicates moderate genetic differentiation. Neighbor-joining clustering revealed two major temporal groups (2017-2019 vs. 2023), which are consistent with habitat fragmentation and limited gene flow. These findings provide the first temporal evidence of genetic erosion in Thai S. spontaneum germplasm, emphasizing the importance of targeted in situ and ex situ conservation, as well as incorporating wild allelic resources into sugarcane breeding programs under the BCG framework.
Keywords: Saccharum spontaneum, genetic erosion, SSR-based diversity, population structure, conservation in lower northern Thailand
Introduction
One of the most significant industrial crops in the world today is sugarcane (Saccharum spp. hybrids), which yields sugar, bioethanol, and renewable energy. Its limited genetic base, however, is mostly the result of a few interspecific crosses between the wild, stress-resistant S. spontaneum and the high-sucrose S. officinarum (Dillon et al., 2007; Zhang et al., 2018). While S. officinarum contributes sugar content, S. spontaneum provides important adaptive traits like drought, salinity, and disease tolerance, as well as tillering vigor and ratooning capacity (Meng et al., 2020). Thus, S. spontaneum may be a genetic reservoir for improving commercial sugarcane stress tolerance.
According to Ha et al. (1999) and Raboin et al. (2006), Thailand is known as a secondary center of diversity for S. spontaneum, with populations dispersed throughout a broad ecological gradient, from roadside wetlands to floodplains and riverbanks, and exhibiting exceptional adaptability. They provide valuable genetic resources for national and regional cane breeding programs. They are threatened by the continuous loss of natural habitats due to infrastructure development, land conversion, and agricultural expansion (Hasan et al., 2020). Long-term evolutionary potential is threatened by habitat fragmentation because it can lead to increased genetic drift, hinder gene flow, and ultimately decrease allelic richness within isolated populations (Aguilar et al., 2008; Frankham, 2015).
Previous research has used SSR or AFLP markers to characterize the
genetic diversity of S. spontaneum in specific regions (Liu et
al., 2016; Govindaraj et al., 2021), but these studies were largely
cross-sectional, capturing spatial variation at a single time point
rather than assessing temporal changes in diversity within the same
populations. The rate and magnitude of genetic erosion in S.
spontaneum under real-world disturbances remain unknown,
particularly in Southeast Asia, where urbanization and agro-industrial
expansion are most pronounced. Quantifying such temporal patterns is
essential for detecting early warning signs of genetic depletion and
developing effective conservation strategies before irreversible loss
occurs.
To fill this gap, the current study uses 30 highly polymorphic
microsatellite (SSR) markers to look at temporal changes in the genetic
diversity and structure of S. spontaneum populations in lower
northern Thailand over three collection years (2017, 2019, and 2023).
Specifically, we wanted to (i) quantify changes in allelic richness and
heterozygosity across time and population size classes, and (ii) assess
how habitat loss and fragmentation affect within- and between-population
genetic differentiation. We hypothesized that (1) allelic diversity in
S. spontaneum has decreased over time as a result of ongoing
habitat degradation, and (2) smaller or fragmented populations have
greater genetic differentiation (higher FST) than larger, contiguous
populations.
This study is the first to use spatial-temporal analyses in conjunction with molecular evidence to assess genetic erosion in Thailand's wild sugarcane gene pool over a period of years. The findings provide practical insights for conservation planning and pre-breeding utilization as part of Thailand's Bio-Circular-Green (BCG) economy initiative.
Results
SSR polymorphism and marker informativeness
Across 40 S. spontaneum populations genotyped with 30 microsatellite loci, 426 alleles were found (Table 2). The number of alleles per locus ranged from 14 (SMC703BS, SEGM6) to 20 (SMC278CS, mSSCIR3), with an overall mean of 16 loci⁻¹, confirming the high polymorphism typical of Saccharum polyploids. The average allele frequency was 0.83, and the polymorphic information content (PIC) values ranged from 0.32 to 0.63 (mean = 0.44), indicating that all loci were moderately to highly informative. Twelve markers (40%), notably SMC278CS, mSSCIR3, and CIR43, had PIC > 0.50 and were the most effective at detecting inter-population variation. Replicated genotyping yielded ≥98% concordance, demonstrating data reliability.
Table 1. Summary of 15 S. spontaneum populations surveyed in four provinces (Phitsanulok, Sukhothai, Phichit, and Nakhon Sawan) of lower northern Thailand across three collection years (2017, 2019, and 2023). The table presents habitat type and population size (m²) estimated from geospatial mapping.
| No. | Population ID | Province | Habitat type | 2017 (m²) | 2019 (m²) | 2023 (m²) |
| 1 | PSL1 | Phitsanulok | Deep swamp | 253,280 | 198,362 | 101,540 |
| 2 | PSL2 | Phitsanulok | Roadside canal | 1,065 | 872 | 672 |
| 3 | PSL3 | Phitsanulok | Swamp | 2,852 | 2,014 | 1,462 |
| 4 | PSL4 | Phitsanulok | Floodplain | 8,085 | 2,796 | 0 (lost to agriculture) |
| 5 | PSL5 | Phitsanulok | Roadside canal | 2,005 | 1,842 | 1,704 |
| 6 | SKT1 | Sukhothai | Canal | 1,758 | 1,604 | 1,452 |
| 7 | SKT2 | Sukhothai | Floodplain | 2,098 | 1,475 | 0 (lost to agriculture) |
| 8 | SKT3 | Sukhothai | Roadside canal | 894 | 714 | 598 |
| 9 | PC1 | Phichit | Deep swamp | 128,792 | 0 (converted to reservoir) | 0 |
| 10 | PC2 | Phichit | Floodplain | 1,086 | 684 | 0 (lost to agriculture) |
| 11 | PC3 | Phichit | Roadside canal | 640 | 514 | 386 |
| 12 | PC4 | Phichit | Riverbank | 768 | 702 | 568 |
| 13 | PC5 | Phichit | Roadside canal | 646 | 580 | 488 |
| 14 | NSW1 | Nakhon Sawan | Deep swamp | 375,160 | 301,753 | 265,410 |
| 15 | NSW2 | Nakhon Sawan | Riverbank | 2,014 | 1,842 | 1,484 |
Population area was calculated from GPS coordinates using Google Earth Pro (v7.3). A value of “0” indicates complete habitat loss due to agricultural expansion or reservoir construction.
Table 2. Summary of polymorphism statistics for 30 SSR loci used to assess genetic diversity in Saccharum spontaneum populations. Markers with PIC ≥ 0.50 were considered highly informative for detecting inter-population variation.
| No. | SSR marker | Expected fragment size (bp) | No. of alleles | Mean allele frequency | PIC value |
|---|---|---|---|---|---|
| 1 | SMC119CG | 95–192 | 19 | 0.87 | 0.58 |
| 2 | SMC1604SA | 98–145 | 16 | 0.81 | 0.42 |
| 3 | SMC1751CL | 123–175 | 17 | 0.84 | 0.47 |
| 4 | SMC18SA | 135–163 | 16 | 0.83 | 0.42 |
| 5 | SMC22DUQ | 124–174 | 18 | 0.89 | 0.53 |
| 6 | SMC24DUQ | 123–159 | 17 | 0.85 | 0.47 |
| 7 | SMC278CS | 111–225 | 20 | 0.91 | 0.63 |
| 8 | SMC319CG | 90–223 | 15 | 0.76 | 0.37 |
| 9 | SMC31CUQ | 127–215 | 16 | 0.83 | 0.42 |
| 10 | SMC334BS | 137–185 | 15 | 0.78 | 0.37 |
| 11 | SMC336BS | 137–222 | 16 | 0.89 | 0.42 |
| 12 | SMC36BUQ | 99–291 | 15 | 0.81 | 0.37 |
| 13 | SMC486CG | 187–301 | 15 | 0.72 | 0.37 |
| 14 | SMC569CS | 131–252 | 14 | 0.69 | 0.32 |
| 15 | SMC597CS | 109–247 | 15 | 0.83 | 0.37 |
| 16 | SMC703BS | 187–234 | 14 | 0.72 | 0.32 |
| 17 | SMC7CUQ | 99–253 | 16 | 0.67 | 0.42 |
| 18 | SMC851MS | 111–171 | 18 | 0.87 | 0.53 |
| 19 | CIR3 | 159–355 | 18 | 0.91 | 0.53 |
| 20 | CIR43 | 148–253 | 19 | 0.94 | 0.58 |
| 21 | CIR66 | 101–155 | 16 | 0.81 | 0.42 |
| 22 | CIR74 | 105–244 | 15 | 0.79 | 0.37 |
| 23 | mSSCIR3 | 146–192 | 20 | 0.95 | 0.63 |
| 24 | mSSCIR43 | 183–252 | 18 | 0.91 | 0.53 |
| 25 | mSSCIR66 | 127–191 | 16 | 0.82 | 0.42 |
| 26 | mSSCIR74 | 223–272 | 17 | 0.94 | 0.47 |
| 27 | SEGM1 | 131–246 | 15 | 0.83 | 0.37 |
| 28 | SEGM4 | 133–244 | 16 | 0.78 | 0.42 |
| 29 | SEGM6 | 83–184 | 14 | 0.82 | 0.32 |
| 30 | SEGM9 | 167–347 | 17 | 0.78 | 0.47 |
| Mean ± SD | — | — | 16 ± 2 | 0.83 ± 0.08 | 0.44 ± 0.09 |
PIC, polymorphic information content; bp, base pairs. Values were calculated from 30 SSR loci analyzed across 40 S. spontaneum populations from four provinces of lower northern Thailand.
Temporal and spatial patterns of genetic diversity
Overall, there was a high level of within-population diversity (PL = 0.601; h = 0.565; Hs = 0.503; Ht = 0.838), but there was only moderate differentiation between populations (FST = 0.400). However, diversity indices declined steadily from 2017 to 2023 (Figure 2). In 2017, populations had the highest polymorphism (PL = 0.714) and gene diversity (h = 0.597), but both parameters decreased slightly in 2019 (PL = 0.633; h = 0.569). By 2023, PL and h had dropped to 0.457 and 0.529, respectively, representing a 12-18% reduction from 2017 levels.
The temporal erosion was accompanied by a modest rise in population differentiation (FST = 0.388 → 0.419), indicating increased genetic isolation among remaining stands. The loss of allelic richness coincided with a documented reduction in population size (Table 1), implying that demographic contraction was the most likely driver.
Spatially, provincial comparisons revealed the greatest genetic diversity in Phitsanulok (h = 0.658 in 2017) and Nakhon Sawan (h = 0.587 in 2023), reflecting their larger, floodplain-connected habitats. Phichit populations, many of which experienced dredging or conversion to agriculture, showed significant declines (h ≈ 0.51 in 2023). F-tests revealed significant temporal variation in PL in Phitsanulok (P < 0.05), but not in other provinces, indicating site-specific erosion.
Influence of population size
Large populations (> 10,000 m²) showed the highest allelic richness and heterozygosity across all years (Table 3). In 2023, small populations (< 1,000 m²) showed slightly higher average gene diversity (Hs = 0.510) compared to medium populations (Hs = 0.502), indicating that local regeneration or short-distance gene flow may temporarily buffer drift effects.
|
Figure 1. Map of Thailand highlighting the study area in lower northern Thailand, showing the locations of 15 Saccharum spontaneum populations (PSL1–PSL5 in Phitsanulok, SKT1–SKT3 in Sukhothai, PC1–PC5 in Phichit, and NSW1–NSW2 in Nakhon Sawan) surveyed during 2017–2023. The mapped region represents a core lowland distribution area of wild Saccharum rather than the entire national distribution. Colored circles represent provinces: red for Phitsanulok, blue for Sukhothai, green for Phichit, and yellow for Nakhon Sawan.
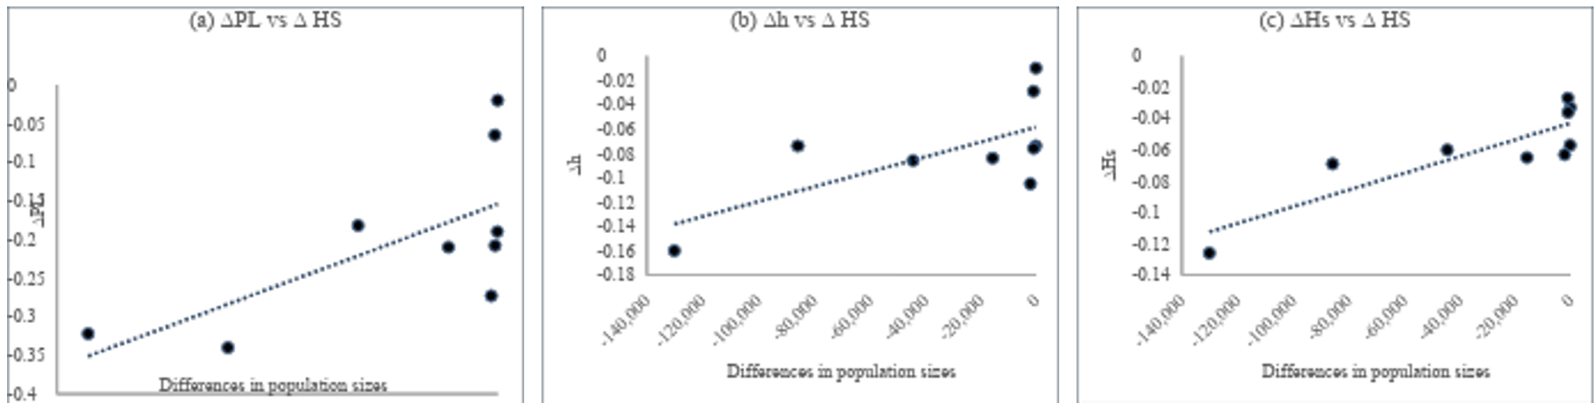
Figure 2. Relationships between changes in habitat size (Δ HS) and genetic diversity indices of S. spontaneum populations across three collection periods (2017–2019, 2019–2023, and 2017–2023): (a) ΔPL vs ΔHS, (b) Δh vs ΔHS, and (c) ΔHs vs ΔHS. Each point represents one population size class. Dashed regression lines and corresponding R² values indicate that decreasing habitat area is associated with reduced genetic diversity.
Despite this anomaly, ANOVA revealed significant differences in PL and Hs among size classes (P < 0.05), confirming population size as an important but not exclusive predictor of genetic variability.
Temporal shifts in genetic structure
Neighbor-Joining clustering using Nei's (1983) genetic distance separated all accessions into two major clusters (Figure 3a), with medium 2023 populations forming a secondary sub-lineage (Figure 3b). Cluster I contained 26 populations sampled in 2017 and 2019, primarily from Phitsanulok, Sukhothai, and Phichit, whereas Cluster II contained 14 populations sampled in 2023, including several small or fragmented sites.
This grouping represents a temporal restructuring of allele composition, with 2023 populations forming a distinct sub-lineage with higher internal homogeneity. The pattern was partially replicated when populations were classified by size, with medium 2023 populations clustering together, implying that medium-sized habitats may be more vulnerable to directional drift.
Partitioning of molecular variance (AMOVA)
AMOVA confirmed that within-population variance predominated, accounting for 50.0% and 52.0% of total variance in temporal and size-based groups, respectively (Table 4). Among-population components accounted for 33-37%, which is consistent with the moderate structuring found in outcrossing grasses. Although the proportion of within-population
Table 3. Genetic diversity indices of S. spontaneum populations across collection years, provinces, and population-size classes in lower northern Thailand (2017–2023). A temporal decline in PL and h and moderate differentiation (FST ≈ 0.40) indicate progressive genetic erosion linked to habitat fragmentation.
| Year / Category | No. of populations | PL | h | Hs | Ht | FST |
| Overall (2017–2023) | 40 | 0.601 ± 0.04 | 0.565 ± 0.03 | 0.503 ± 0.02 | 0.838 ± 0.02 | 0.4 |
| Year of collection | ||||||
| 2017 | 15 | 0.714 ± 0.03 | 0.597 ± 0.02 | 0.531 ± 0.02 | 0.867 ± 0.01 | 0.388 |
| 2019 | 14 | 0.633 ± 0.04 | 0.569 ± 0.03 | 0.507 ± 0.02 | 0.837 ± 0.02 | 0.395 |
| 2023 | 11 | 0.457 ± 0.06 | 0.529 ± 0.04 | 0.471 ± 0.03 | 0.810 ± 0.03 | 0.419 |
| Province (2017–2023) | ||||||
| Phitsanulok | 5 | 0.606 ± 0.07 | 0.597 ± 0.05 | 0.531 ± 0.03 | 0.861 ± 0.03 | 0.384 |
| Sukhothai | 3 | 0.525 ± 0.06 | 0.530 ± 0.04 | 0.466 ± 0.03 | 0.773 ± 0.02 | 0.39 |
| Phichit | 5 | 0.567 ± 0.05 | 0.563 ± 0.04 | 0.506 ± 0.03 | 0.881 ± 0.03 | 0.427 |
| Nakhon Sawan | 2 | 0.695 ± 0.03 | 0.617 ± 0.03 | 0.541 ± 0.02 | 0.878 ± 0.02 | 0.385 |
| Population size class (m²) | ||||||
| < 1 000 | 4 | 0.603 ± 0.04 | 0.564 ± 0.03 | 0.510 ± 0.03 | 0.827 ± 0.03 | 0.383 |
| 1 001–10 000 | 7 | 0.546 ± 0.05 | 0.556 ± 0.03 | 0.502 ± 0.02 | 0.860 ± 0.02 | 0.419 |
| > 10 000 | 3 | 0.619 ± 0.04 | 0.606 ± 0.03 | 0.526 ± 0.02 | 0.896 ± 0.02 | 0.392 |
PL = proportion of polymorphic loci; h = Nei’s (1973) gene diversity; Hs = average within-population diversity; Ht = total gene diversity; FST = genetic differentiation among populations. Values are means ± standard deviations computed from 30 SSR loci across 40 populations.
Table 4. Analysis of molecular variance (AMOVA) of S. spontaneum populations across collection years (2017–2023) and habitat-size classes. Within-population variance (~50%) indicates strong individual heterogeneity, while moderate ΦPT values (0.33–0.37; P < 0.001) reveal temporal and spatial genetic structuring due to restricted gene flow.
| Source of variation | df | SS | MS | Estimated variance | % of total variation |
|---|---|---|---|---|---|
| (a) Temporal grouping (2017, 2019, 2023) | |||||
| Among collection years | 2 | 350.1 | 175.0 | 0.37 | 37.0 |
| Among populations within years | 72 | 130.4 | 1.81 | 0.13 | 13.0 |
| Within populations | 75 | 470.2 | 6.27 | 0.50 | 50.0 |
| Total | 149 | 950.7 | – | 1.00 | 100.0 |
| ΦPT (among years vs. total) | 0.37*** | ||||
| (b) Habitat-size grouping (<1,000; 1,001–10,000; >10,000 m²) | |||||
| Among size classes | 2 | 310.5 | 155.3 | 0.33 | 33.0 |
| Among populations within size classes | 72 | 144.9 | 2.01 | 0.15 | 15.0 |
| Within populations | 75 | 480.8 | 6.41 | 0.52 | 52.0 |
| Total | 149 | 936.2 | – | 1.00 | 100.0 |
| ΦPT (among size classes vs. total) | 0.33*** | ||||
df = degrees of freedom; SS = sum of squares; MS = mean squares; ΦPT = fixation index measuring population differentiation. All tests were based on 999 random permutations using GenAlEx v6.1. Significance levels: P < 0.001 (***).
variance remained high, its relative contribution decreased over time, confirming the genetic differentiation trend predicted by the FST. Thailand's S. spontaneum populations lost genetic diversity over six years, most likely due to habitat fragmentation and population decline.
Discussion
High intrinsic diversity and evolutionary mechanisms
S. spontaneum's high allelic richness and heterozygosity make it a genetically dynamic grassland and riparian species in Thailand. This diversity stems from the polyploid genome architecture and predominantly out-crossing reproductive system, both of which improve allelic buffering and preserve multi-locus polymorphism under selection pressure (Liu et al., 2016; Medeiros et al., 2020). Polyploid buffering lets duplicate loci accumulate mutations without fitness penalties, preserving long-term adaptive potential. Even though floodplain populations were isolated, historical gene flow likely maintained high within-population variance (50-52%). These findings support the idea that S. spontaneum is an irreplaceable genetic reservoir for stress-tolerance traits, such as drought and salinity resistance, that can be introduced into commercial sugarcane lines (Tai and Miller, 2002; Liu et al., 2022).
Despite the genomic complexity of Saccharum, the use of a moderate number of highly informative SSR loci has been widely shown to capture population-level genetic diversity effectively in polyploid species. The strong concordance between
 |
Figure 3. Neighbor-Joining (NJ) cluster analysis of
40 S. spontaneum populations from four provinces in lower
northern Thailand based on Nei’s (1983) genetic distance. (a)
Populations grouped by collection years (2017, 2019, 2023).
(b) Populations grouped by habitat size classes: small (SHs; <1,000
m²), medium (MHs; 1,001–10,000 m²), and large (LHs; >10,000 m²).
Bootstrap values (1,000 replicates) are shown at all nodes, and data
bars represent expected heterozygosity (He), highlighting temporal and
size-related genetic differentiation.
temporal trends in PL, h, FST, AMOVA partitioning, and clustering patterns observed in this study indicates that the selected marker set reliably reflects underlying evolutionary processes rather than sampling artefacts.
Temporal genetic erosion and its underlying drivers
The gradual decline in genetic diversity observed between 2017 and 2023 is unlikely to be primarily driven by directional natural selection. The SSR loci employed in this study are assumed to be selectively neutral; therefore, changes in diversity metrics are more plausibly attributed to demographic and stochastic processes. Progressive habitat loss, population size reduction, and fragmentation reduce effective population size and restrict pollen- and seed-mediated gene flow, thereby intensifying genetic drift and accelerating allelic loss.
The concurrent decrease in polymorphic loci (PL) and Nei’s gene diversity (h), together with increasing FST values and greater among-group variance in AMOVA, supports a drift-dominated erosion model rather than selection-driven differentiation. While local environmental pressures may impose selection on adaptive traits, such effects are unlikely to be detected by neutral SSR markers. Thus, the observed temporal genetic erosion primarily reflects landscape-mediated demographic processes acting on remnant populations.
This study shows molecular genetic diversity erosion between 2017 and
2023 despite its robustness. Polymorphic locus reductions of 12-18%,
expected heterozygosity, and higher FST values indicate genetic drift
and restricted gene flow in fragmented habitats. AMOVA supports Wright's
(1978) interpretation by revealing a 33-37% variation between collection
years and habitat-size classes (ΦPT = 0.33-0.37; P < 0.001). This
suggests moderate differentiation among outcrossing taxa. The decline
corresponds to regional land-use transitions documented in Phichit and
Phitsanulok provinces at the same time, such as canal dredging, paddy
expansion, and road construction. These disturbances reduce population
size and continuity, hastening drift and encouraging allele fixation in
small remnants (Hedrick et al., 2014; Miles et al., 2019).
Surprisingly, a slight increase in diversity among some small 2023
populations suggests transient recruitment from seed banks or
short-distance dispersal, which partially offsets drift. Following
flooding events, Erianthus arundinaceus and Miscanthus
sinensis have shown similar short-term rebounds (Wang et al., 2008).
However, if fragmentation persists, stochastic regeneration cannot
counteract long-term erosion, emphasizing the importance of continuous
monitoring.
Population size, drift–gene-flow equilibrium, and spatial heterogeneity
The complex relationship between population size and diversity observed here lends support to the drift-gene-flow equilibrium model. Large floodplain populations maintained high heterozygosity due to extensive cross-pollination, whereas medium-sized patches experienced greater allele loss, most likely due to being large enough for drift to act but too isolated for effective gene exchange. They support our hypothesis that smaller or fragmented populations have stronger genetic differentiation due to restricted gene flow. Similar nonlinear patterns have been observed in Phragmites australis and Oryza rufipogon (Leimu et al., 2006; Wongtamee et al., 2017). As a result, conservation strategies must acknowledge that "moderate isolation" can be more genetically dangerous than either extensive connectivity or very small but frequently recolonized patches.
Spatial contrasts also highlight the importance of landscape connectivity: Nakhon Sawan's vast wetlands maintained high diversity even in 2023, whereas Phichit's channelized systems experienced the steepest decline. Maintaining hydrological linkages and riparian corridors will help gene flow between populations.
Comparisons with global Saccharum diversity studies
Compared to earlier single-time surveys in India (Govindaraj et al., 2021) and China (Liu et al., 2022), Thai S. spontaneum populations still exhibit comparable or higher allelic richness (A ≈ 16 locus⁻¹), but with a greater temporal fluctuation, suggesting recent anthropogenic impact rather than historical bottleneck. The current study found moderate differentiation (ΦPT ≈ 0.40), similar to Erianthus spp. in Southeast Asia (Ali et al., 2019), indicating that wild Saccharum taxa in tropical Asia exhibit similar levels of within-population variation but differ in temporal stability. The current study fills a regional gap by demonstrating that genetic erosion can occur within six years, or one to two clonal generations, emphasizing polyploid perennials' sensitivity to habitat disturbance.
Conservation and breeding implications
The documented decline is an early indicator of germplasm
vulnerability in Thailand's wild sugarcane gene pool. Conservation
measures should prioritize the following: (1) in situ
protection of the most diverse floodplain and canal-bank habitats (e.g.,
Phitsanulok, Nakhon Sawan). (2) Ex situ preservation using
living collections and cryopreserved germplasm banks to capture allelic
diversity over multiple years. (3) Create connecting riparian corridors
or buffer strips for pollen and seed flow. (4) Tracking He and FST
diversity metrics with molecular monitoring in the national sugarcane
breeding network.
Thailand's Bio-Circular-Green (BCG) economic framework promotes
sustainable use of native biodiversity, which supports these actions.
S. spontaneum alleles in pre-breeding pipelines can improve
commercial cultivars' drought, salinity, and pest resistance, which are
becoming increasingly important due to climate variability. Due to
moderate differentiation (ΦPT ≈ 0.33-0.37), 15-20% loss of polymorphism,
and 12-18% decline in gene diversity, fragmented habitats rapidly lose
allelic richness, highlighting the need for coordinated conservation
interventions.
Future perspectives
To identify environmental variables that predict biodiversity loss, future research should combine molecular monitoring with landscape genomics and remote sensing analyses. High-throughput SNP genotyping and genome-wide association mapping may reveal candidate genes involved in hydrological stress adaptation. Extending temporal sampling beyond 2023 will reveal whether observed declines are a one-time occurrence or a long-term trend toward genetic impoverishment. Evidence-based conservation planning for Saccharum wild relatives in mainland Southeast Asia will require genetic, ecological, and socioeconomic data.
Material and methods
Study area and population sampling
Field surveys of S. spontaneum populations were conducted in four provinces in lower northern Thailand: Phitsanulok (PSL), Sukhothai (SKT), Phichit (PC), and Nakhon Sawan (NSW), where S. spontaneum is commonly found in floodplains, riverbanks, and roadside wetlands (Figure 1). The tropical monsoon climate and seasonal flooding characterize the Nan-Yom-Ping River basin's lowland alluvial ecosystems. Although geographically focused, the study area represents a major lowland ecological zone where wild Saccharum spontaneum is widespread in Thailand and frequently exposed to similar land-use pressures.
Sampling campaigns were carried out at three time points (2017, 2019, and 2023) to assess temporal changes in population diversity. In total, 40 populations derived from 15 sampling locations were included in this study. Sampling sites were distributed across four provinces in lower northern Thailand (Phitsanulok, Sukhothai, Phichit, and Nakhon Sawan), covering the major ecological settings in which wild Saccharum spontaneum naturally occurs. Site selection was guided by explicit criteria to ensure ecological and genetic representativeness, including (i) geographic separation of populations (>15 km), (ii) minimum habitat size (>100 m² at initial sampling), (iii) inclusion of contrasting habitat types (floodplains, riverbanks, canals, and swamps), and (iv) persistence of populations across multiple collection years to allow temporal comparisons.
Although the sampling was geographically focused on lower northern Thailand, this region constitutes a core distribution area of wild Saccharum in the country. Therefore, the selected populations provide a representative model for assessing temporal genetic erosion in Thai lowland Saccharum spontaneum populations under increasing anthropogenic pressure.
To reduce clonal redundancy, 50 plants were randomly sampled at ≥2 m spacing from each site. Leaf tissues were collected, desiccated in silica gel, and stored at -20 degrees Celsius until DNA extraction. Table 1 shows the sampling coordinates, habitat type, and population size for each collection.
DNA extraction and SSR genotyping
Genomic DNA was extracted from silica-dried leaves using a modified CTAB protocol (Pan, 2006), which was optimized for polysaccharide-rich grass tissues. DNA quality and quantity were determined spectrophotometrically (NanoDrop 2000, Thermo Scientific) and confirmed with 1% agarose gel electrophoresis.
Thirty previously validated simple sequence repeat (SSR) primer pairs for Saccharum (Table 2) were chosen due to their high polymorphism and genome coverage (Ali et al., 2019; Xiong et al., 2022). Although sugarcane possesses a highly complex polyploid genome, microsatellite markers remain appropriate for population-level analyses when the objective is to assess neutral genetic variation rather than full genome-wide coverage. The 30 SSR loci used in this study were highly polymorphic, multi-allelic, and distributed across different linkage groups, providing sufficient resolution to detect temporal and spatial genetic differentiation among populations.
PCR reactions (20 µL) used 50 ng genomic DNA, 1× buffer, 2 mM MgCl₂, 200 µM dNTPs, 0.5 µM primers, and 1 U Taq polymerase. The amplification program included 95 °C for 5 minutes, 35 cycles of 95 °C for 45 seconds, 55-60 °C for 45 seconds (primer-specific), 72 °C for 1 minute, and a 10-minute extension at 72 °C.
Ethidium bromide-stained 10% polyacrylamide gels were used to examine amplified products under UV light. Each allele was measured using a 50 bp DNA ladder (GeneRuler™, Thermo Scientific) and scored in base pairs with GelAnalyzer v19.1. We achieved ≥98% accuracy by re-amplifying and re-scoring 10% of samples to ensure consistency.
Genetic diversity analysis
Allele data were converted into a binary matrix (presence/absence) and analyzed using FSTAT v2.9.3 (Goudet, 2001) and GenAlEx v6.1 (Peakall and Smouse, 2006). The following parameters were computed; proportion of polymorphic loci (PL), number of alleles per locus (A), Nei’s gene diversity (h) (Nei, 1973), average within-population diversity (Hs) and total diversity (Ht), and fixation index (Fst) indicating population differentiation.
Temporal comparisons were performed for 2017–2019, 2019–2023, and
2017–2023 periods. Populations were also grouped by habitat size (<
1,000 m², 1,001–10,000 m², > 10,000 m²) to test for size-related
effects on diversity.
Significance of parameter differences among years and population
categories was assessed using one-way ANOVA and F-tests at P <
0.05.
Genetic structure and differentiation
Population relationships were assessed using Nei’s (1983) genetic distance and Neighbor-Joining (NJ) clustering implemented in MEGA v11.0. Bootstrapping (1,000 replicates) was used to test branch stability. The proportion of molecular variance within and among populations was quantified through Analysis of Molecular Variance (AMOVA) in GenAlEx, based on 999 permutations.
To examine whether genetic differentiation corresponded to sampling year or population size, hierarchical AMOVA models were constructed for (i) temporal grouping (2017, 2019, 2023) and (ii) habitat-size grouping (small, medium, large).
Conclusion
This study provides the first temporal assessment of genetic diversity in S. spontaneum populations from lower northern Thailand. A consistent decline in polymorphic loci (PL) and Nei’s gene diversity (h) from 2017 to 2023, together with AMOVA results showing ≈50–52% within-population variance and ΦPT values of 0.33–0.37 (P < 0.001), indicates progressive genetic erosion driven by habitat fragmentation and isolation. The two major clusters observed (2017–2019 vs. 2023) further confirm temporal restructuring of the gene pool. The results confirm our initial hypotheses that allelic diversity declined over time and that fragmentation intensified population differentiation.
These findings suggest urgent in situ and ex situ conservation of remnant S. spontaneum populations as allelic diversity reservoirs for BCG and climate-resilient agriculture sugarcane improvement.
Statement of contributions
Anupong Wongtamee conceived and designed the experiment, conducted field sampling, performed molecular and statistical analyses, and drafted the manuscript. Supansa Chinaworn contributed to statistical validation, data interpretation, and manuscript editing. Tonapha Pusadee supervised data visualization, critically revised the text, and approved the final version. All authors read and approved of the final manuscript.
Acknowledgements
This research was supported by Naresuan University (NU) and the National Science, Research and Innovation Fund (NSRF) under Grant No. R2566B078. The authors gratefully acknowledge the Faculty of Agriculture, Natural Resources and Environment, Naresuan University, and the Faculty of Agriculture, Chiang Mai University, for providing laboratory instruments, technical facilities, and field logistics. Special thanks are extended to the provincial agricultural officers and community partners in Phitsanulok, Sukhothai, Phichit, and Nakhon Sawan for their invaluable assistance in sample collection and habitat documentation.
Conflict of interest
The authors declare that they have no conflict of interest.
References
Aguilar R, Quesada M, Ashworth L, Herrerias-Diego Y, Lobo J (2008) Genetic consequences of habitat fragmentation in plant populations: susceptible signals in plant traits and methodological approaches. Mol Ecol 17(24):5177–5188. https://doi.org/10.1111/j.1365-294X.2008.03971.x
Ali A, Pan YB, Wang QN, Wang JD, Chen JL, Gao SJ (2019) Genetic diversity and population structure analysis of Saccharum and Erianthus genera using microsatellite (SSR) markers. Sci Rep 9(1):395. https://doi.org/10.1038/s41598-018-37233-2
Dillon SL, Shapter FM, Robert HJ, Cordeiro G, Izquierdo L, Lee SL (2007) Domestication to crop improvement: genetic resources for Sorghum and Saccharum (Andropogoneae). Ann Bot 5:975–989. https://doi.org/10.1093/aob/mcm192.
Frankham R (2015) Genetic rescue of small inbred populations: meta-analysis reveals large and consistent benefits of gene flow. Mol Ecol 24:2610–2618. https://doi.org/10.1111/mec.13139
Goudet J (2001) FSTAT, a program to estimate and test gene diversities and fixation indices (version 2.9.3). [Internet]. Available from: http://www2.unil.ch/popgen/softwares/fstat.htm
Govindaraj P, Gowri R, Mohanraj K, Amalraj VA (2021) SSR marker based molecular genetic diversity analysis among Saccharum spontaneum (L.) collected from north western region of India. Sugar Tech 23:730–740. https://doi.org/10.1007/s12355-021-00956-w
Ha S, Moore PH, Heinz D, Kato S, Ohmido N, Fukui K (1999) Quantitative chromosome map of the polyploid Saccharum spontaneum by multicolor fluorescence in situ hybridization and imaging methods. Plant Mol Biol 39(6):1165–1173. https://doi.org/10.1023/A:1006152103335
Hasan SS, Zhen L, Miah MG, Ahamed T, Samie A (2020) Impact of land use change on ecosystem services: a review. Environ Dev 34:100527. https://doi.org/10.1016/j.envdev.2020.100527
Hedrick P, Peterson R, Vucetich L, Adams J, Vucetich J (2014) Genetic rescue in Isle Royale wolves: genetic analysis and the collapse of the population. Conserv Genet 15:1111–1121. https://doi.org/10.1007/s10592-014-0604-1
Leimu R, Mutikainen P, Koricheva J, Fischer M (2006) How general are positive relationships between plant population size, fitness, and genetic variation? J Ecol 94:942–952. https://doi.org/10.1111/j.1365-2745.2006.01150.x
Liu L, Wang H, Li Y, Chen S, Wu M, Dou M, Qi Y, Fang J, Zhang J (2022) Genome-wide development of interspecific microsatellite markers for Saccharum officinarum and Saccharum spontaneum. J Integr Agric 21(11):3230–3244. https://doi.org/10.1016/j.jia.2022.08.129
Liu XL, Li XJ, Xu CH, Lin XQ, Deng ZH (2016) Genetic diversity of populations of Saccharum spontaneum with different ploidy levels using SSR molecular markers. Sugar Tech 18(4):365–372. https://doi.org/10.1007/s12355-015-0320-x
Medeiros C, Balsalobre TWA, Carneiro MS (2020) Molecular diversity and genetic structure of Saccharum complex accessions. PLoS One 15(5):e0233211. https://doi.org/10.1371/journal.pone.0233211
Meng Z, Han J, Lin Y, Zhao Y, Lin Q, Ma X, Wang J, Zhang M, Zhang L, Yang Q, Wang K (2020) Characterization of a Saccharum spontaneum L. with a basic chromosome number of x = 10 provides new insights into genome evolution in the genus Saccharum. Theor Appl Genet 133:187–199. https://doi.org/10.1007/s00122-019-03448-z
Miles LS, Rivkin LR, Johnson MTJ, Munshi-South J, Verrelli BC (2019) Gene flow and genetic drift in urban environments. Mol Ecol 28(18):4138–4151. https://doi.org/10.1111/mec.15221
Nei M (1973) The theory and estimation of genetic distance. In: Morton NE (ed) Genetic structure of populations. University of Hawaii Press, Honolulu, pp 45–54. Available from: https://www.scirp.org/reference/referencespapers?referenceid=32519
Nei M (1983) Genetic polymorphism and the role of mutation in evolution. In: Nei M, Koehn RK (eds) Evolution of genes and proteins. Sinauer Associates, Sunderland, pp 165–190. https://www.scirp.org/reference/referencespapers?referenceid=59366
Pan YB (2006) Highly polymorphic microsatellite DNA markers for sugarcane germplasm evaluation and variety identity testing. Sugar Tech 8:246–256. https://doi.org/10.1007/BF02943564
Peakall R, Smouse PE (2006) GENALEX 6: genetic analysis in Excel. Population genetic software for teaching and research. Mol Ecol Notes 6(1):288–295. https://doi.org/10.1111/j.1471-8286.2005.01155.x
Raboin LM, Oliveira KM, Lecunff L, Telismart H, Roques D, Butterfield M, Hoarau JY, D’Hont A (2006) Genetic mapping in sugarcane, a high polyploid, using bi-parental progeny: identification of a gene controlling stalk colour and a new rust resistance gene. Theor Appl Genet 112:1382–1391. https://doi.org/10.1007/s00122-006-0240-3
Tai PYP, Miller JD (2002) Germplasm diversity among four sugarcane species for sugar composition. Crop Sci 42(3):958–964. https://doi.org/10.2135/cropsci2002.9580
Wang LP, Jackson PA, Lu X (2008) Evaluation of sugarcane × Saccharum spontaneum progeny for biomass composition and yield components. Crop Sci 48:951–961. https://doi.org/10.2135/cropsci2007.10.0555
Wongtamee A, Maneechote C, Pusadee T, Rerkasem B, Jamjod S (2017) The dynamics of spatial and temporal population genetic structure of weedy rice (Oryza sativa f. spontanea Baker). Genet Resour Crop Evol 64:1073–1087. https://doi.org/10.1007/s10722-015-0330-7
Xiong H, Chen Y, Gao S, Pan Y, Shi A (2022) Population structure and genetic diversity analysis in sugarcane (Saccharum spp. hybrids) and six related Saccharum species. Agronomy 12(2):412. https://doi.org/10.3390/agronomy12020412
Zhang J, Zhang X, Tang H, Zhang Q, Hua X, Ma X, et al. (2018) Allele-defined genome of the autopolyploid sugarcane Saccharum spontaneum L. Nat Genet 50(11):1565–1573. https://doi.org/10.1038/s41588-018-0237-2
Wright S (1978) Evolution and the genetics of populations, Vol. 4: Variability within and among natural populations. University of Chicago Press, Chicago, IL.