Australian Journal of Crop Science
Article | https://doi.org/10.21475/ajcs.26.20.08.pne197
Submitted: 02 December 2025 | Revised: 29 April 2026 | Accepted: 30 April 2026
Pages 670-678
Herbicide doses for managing forage growth in corn–Panicum intercropping and their effects on soybean grown in succession
Dayana Cardoso Cruz1, Carlos Henrique Lima e Silva1, Carlos Eduardo Leite Mello1, Estevam Matheus Costa2, Felipe Pereira Cunha*1, Jardel Lopes Pereira1 and Adriano Jakelaitis1
1Weed laboratory, Instituto Federal Goiano – Campus Rio Verde, Rio Verde, Goiás, Brazil
2Grupo Associado de Pesquisa do Sudoeste Goiano – GAPES, Rio Verde, Goiás, Brazil
*Corresponding author: felipe.cunha@estudante.ifgoiano.edu.br
ORCID: https://orcid.org/0009-0003-4479-0593
Abstract: Managing Panicum maximum intercropped with corn requires effective growth-control strategies to minimize competition. This study evaluated glyphosate and nicosulfuron doses for suppressing Panicum maximum cv. BRS Quênia intercropped with corn, and their effects on soybean yield and weed dynamics. Glyphosate was applied at rates of 0, 48, 96, 240, 480, and 960 g a.e. ha⁻¹ (Trial 1), and nicosulfuron at 0, 2.5, 5.0, 12.5, 25.0, and 50.0 g a.i. ha⁻¹ (Trial 2), including corn monocultures as controls. Corn agronomic performance, forage phytotoxicity and dry mass, soybean yield, and weed dynamics were measured. Increasing herbicide doses resulted in greater forage phytotoxicity, with more severe effects in Trial 1 and more moderate but prolonged effects in Trial 2. Dry mass was reduced to 0 and 337 kg ha⁻¹ at the highest doses in Trials 1 and 2, respectively. Corn grain yield decreased due to coexistence with BRS Quênia and reductions of 61% and 52% were recorded compared to monocultures in Trials 1 and 2, respectively. Intercropping also increased the incidence of lodged or broken corn plants; however, it contributed to straw formation and reduced weed infestation. Soybean cultivated in succession to the intercropping system produced average yields of 4,216.40 and 5,354.68 kg ha⁻¹ following glyphosate- and nicosulfuron-treated plots, respectively. Glyphosate (~240 g ha⁻¹) and nicosulfuron (~12.5 g ha⁻¹) provided adequate forage suppression with acceptable corn yield. Straw supported soybean yield and reduced weed pressure, supporting crop–forage integration systems.
Keywords: Glycine max; Megathyrsus maximus; Zea mays; crop-livestock integration; mulch.
Abbreviations: CLI_Crop–livestock integration; CM_Corn monoculture; CV_Coefficient of variation; DAA_Days after application; DAE_Days after emergence; DM_Weed dry mass; DMY_Dry matter yield; EH_Ear height; EI_Ear index; FEH_First ear height; GY_Grain yield; INMET_Instituto Nacional de Meteorologia; LBI_Lodging/breakage index; PH_Plant height; PHf_Forage plant height; PM_Plants per meter; PP_Plant population; PPP_Pods per plant; SD_Stem diameter; SPP_Seeds per pod; TN_Tussock number; TSW_Thousand-seed weight; TiN_Tiller number; WD_Weed density; WM_Weed mass.
Introduction
Crop–livestock integration (CLI) systems have significantly expanded across the Brazilian Cerrado through intercropping, rotation, and crop succession (Zolin et al., 2021). These systems aim at sustainability and optimized land use by integrating grain production with pasture establishment. CLI promotes diversification and the sustainable intensification of food production (Simões et al., 2023) and delivers key ecosystem services, such as biomass generation for soybean no-till systems (Muniz et al., 2021), maintenance of soil fertility via nutrient cycling (Dias et al., 2020), weed control (Mello et al., 2023), and increased grain yields (Silva et al., 2023b).
Interest in Panicum spp. has increased in recent years due to desirable agronomic traits, including high biomass production, deep root systems, drought tolerance, high forage quality, and vigorous regrowth (Costa et al., 2020; Cruvinel et al., 2021). Among available cultivars, Panicum maximum cv. BRS Quênia stands out for its intermediate stature, reduced culm elongation, lower tussock formation, and high biomass production (Valote et al., 2021). It also exhibits good adaptation to tropical conditions and satisfactory nutritive value (Jank et al., 2017), favoring soil cover and conservation.
Managing this forage in corn intercropping systems followed by soybean requires effective growth-control strategies to avoid excessive competition with the main crop. Forage grasses are highly competitive and tend to elongate leaves and culms under intercropping to maximize light interception (Mello et al., 2024). In this context, the use of appropriate herbicide rates is an effective alternative to temporarily reduce forage growth without eliminating it.
Controlled herbicide applications enable balanced establishment of species within the system, ensuring grain crop development and the persistence of forage for grazing and straw formation after harvest. This practice also contributes to improved weed management and to soil chemical, physical, and biological properties (Correia and Lenza, 2024). Thus, selective herbicides are essential tools for integrated management because they promote a temporary phytotoxic effect that attenuates early competition and supports system sustainability (Silva et al., 2023a).
Glyphosate and nicosulfuron are among the herbicides used in integrated systems because of their efficacy in controlling weeds in corn. However, these molecules require detailed knowledge of optimal rates, phytotoxic effects, and impacts on crop and forage productivity when used in intercrops. Information remains scarce regarding the response of P. maximum cultivars to these herbicides (Cruvinel et al., 2021).
Therefore, this study aimed to evaluate the effects of glyphosate and nicosulfuron doses on the management of P. maximum cv. BRS Quênia intercropped with Roundup Ready® corn, considering their implications for corn agronomic traits, forage phytotoxicity, soybean yield in succession, and the dynamics of the weed community.
Results and discussion
Table 1 presents corn growth and yield variables in Panicum maximum cv. BRS Quênia intercrops as a function of glyphosate and nicosulfuron doses. Plant height (PH), ear height (EH), stem diameter (SD), and ear index (EI) were not significantly affected by treatments in either the glyphosate or nicosulfuron experiment, indicating that the doses did not alter vegetative growth or ear development in corn.
Table 1. Ear height (EH), plant height (PH), stem diameter (SD), plant population (PP), ear index (EI), lodging/breakage index (LBI), and grain yield (GY) of corn intercropped with Panicum maximum cv. BRS Quênia as a function of glyphosate rates (Trial 1) and nicosulfuron rates (Trial 2)
| Trial 1: Intercropping of maize and Panicum maximum cv. BRS Quênia treated with glyphosate | ||||||||||
| Variables | Glyphosate doses (g ha-1) | Regression | CM | F0.05 | CV (%) | |||||
| 0 | 48 | 96 | 240 | 480 | 960 | |||||
| EH (m) | 1.12 | 1.10 | 1.12 | 1.11 | 1.13 | 1.13 | Y = 1.12 | 1.12 | 0.31ns | 4.21 |
| PH (m) | 1.66 | 1.63 | 1.67 | 1.67 | 1.69 | 1.66 | Y = 1.66 | 1.68 | 0.53ns | 3.26 |
| SD (mm) | 18.33 | 18.31 | 19.69 | 19.64 | 19.41 | 19.13 | Y = 19.09 | 20.26 | 0.83ns | 8.24 |
| PP (n m-1) | 2.25 | 2.04 | 1.81 | 2.40 | 2.92 | 2.96 | Y = 2.0689+0.0011x R² = 0.72* | 3.10 | 11.94* | 11.61 |
| IE | 1.45 | 1.74 | 2.08 | 1.93 | 1.70 | 1.65 | Y = 1.76 | 1.56 | 1.36ns | 21.38 |
| LBI | 3.50 | 3.50 | 4.50 | 2.50 | 1.50 | 1.00 | Y = 3.7241–0.0032x R² = 0.77* | 0.00 | 11.94* | 29.28 |
GY (kg ha-1) |
3,587.50 | 3,654.17 | 3,850.00 | 6,329.17 | 8,275.00 | 8,725.00 | Y = 8,913.9064/(1+exp(-(x-102.5935)/165.8128)) R² = 0.98* | 9,270.83 | 8.22* | 28.47 |
| Trial 2: Intercropping of maize and Panicum maximum cv. BRS Quênia treated with nicosulfuron | ||||||||||
| Variables | Nicosulfuron doses (g ha-1) | Regression | CM | F0.05 | CV (%) | |||||
| 0 | 2.5 | 5 | 12.5 | 25 | 50 | |||||
| EH (m) | 1.16 | 1.19 | 1.17 | 1.16 | 1.16 | 1.18 | Y = 1.17 | 1.23 | 1.57ns | 3.22 |
| PH (m) | 1.74 | 1.71 | 1.70 | 1.72 | 1.75 | 1.75 | Y = 1.73 | 1.78 | 0.75ns | 3.56 |
| SD (mm) | 17.70 | 19.24 | 19.19 | 19.62 | 17.31 | 18.23 | Y = 18.55 | 19.60 | 0.73ns | 11.17 |
PP (n m-1) |
2.04 | 2.63 | 2.85 | 2.98 | 2.94 | 2.75 | Y = 2.70 | 2.94 | 2.45ns | 15.37 |
| IE | 2.01 | 1.81 | 1.77 | 1.80 | 1.81 | 1.92 | Y = 1.85 | 1.91 | 0.22ns | 19.53 |
| LBI | 3.50 | 2.50 | 2.25 | 1.75 | 1.25 | 2.00 | Y = 3.1038-0.1374x+0.0023x² R²= 0.90* | 0.00 | 7.19* | 42.88 |
GY (kg ha-1) |
4,791.67 | 7,641.67 | 8,695.83 | 10,075.00 | 9,316.67 | 8,245.83 | Y = 6,348.2506+293.8628x-5.2045x² R²= 0.63* | 10,145.83 | 11.24* | 13.07 |
ns – not significant; * – significant at 5% probability by the F test. CM – corn monocropping. CV – coefficient of variation.
The plant population (PP) increased linearly with the glyphosate doses, with an increment of 0.0011 plant m⁻¹ per g a.e. ha⁻¹ applied. This response may be associated with reduced early competition between corn and the forage at higher sub-rates, favoring crop establishment. Conversely, the lodging/breakage index (LBI) decreased linearly, with an estimated reduction of 0.0032 per unit increase in dose, supporting the hypothesis of reduced physical interference by the forage under greater chemical suppression.
Grain yield (GY) followed a sigmoidal model, with a maximum of 8,913.9 kg ha⁻¹ and a subdose of 102.59 g ha⁻¹ producing 50% of the response. GY was reduced at lower doses, likely due to intense competition from the forage, which was insufficiently suppressed. Similar results were reported by Mello et al. (2023), who observed reduced corn GY when low glyphosate doses were applied in intercropping with Panicum maximum cv. BRS Quênia, underscoring that inadequate suppression of the forage compromises crop performance. Given the vigorous growth habit and high biomass production of Panicum cultivars, the absence of adequate chemical control tends to intensify competition for light, water, and nutrients (Jakelaitis et al., 2010).
The corn GY fit a quadratic model in the nicosulfuron experiment, increasing up to 27.93 g ha⁻¹, then slightly decreasing at higher doses. This indicates that moderate nicosulfuron doses balance forage suppression and corn tolerance, maximizing yield. Mello et al. (2024) reported similar behavior, with yield reduction from 22.9 g ha⁻¹ and corn phytotoxicity up to 45% at 7 DAA at 50 g ha⁻¹, demonstrating crop sensitivity. The quadratic trend observed herein reinforces that efficient intercrop management requires intermediate doses which avoid both forage competition and corn toxicity.
The intercrop GY in both experiments was statistically lower than sole-crop corn (Table 1), as expected due to additional competition from the forage during the corn cycle. Even so, judicious herbicide doses can mitigate this interference, maintain acceptable yields, and ensure residual biomass for subsequent no-till.
Table 2 shows forage phytotoxicity and dry matter yield (DMY). Phytotoxicity fit a sigmoidal model in the glyphosate experiment, with an excellent fit (R² = 99%) from 7 to 28 DAA. Injury symptoms were mild at doses below 96 g ha⁻¹, and largely restricted to the first two weeks after application, followed by partial recovery, which was consistent with temporary growth arrest. In contrast, high doses resulted in total control, indicating high sensitivity of cv. BRS Quênia to glyphosate. Maximum phytotoxicity estimates ranged from 85% to 93%; doses corresponding to 50% injury were 225.27 and 260.43 g ha⁻¹ at 7 and 28 DAA, respectively, indicating progressive recovery after the initial impact.
Phytotoxicity also followed a sigmoidal pattern (R² > 95%) in the nicosulfuron experiment. Symptoms gradually increased with dose, peaking at 78% and 75% at 21 and 28 DAA. Doses causing 50% of phytotoxicity were 7.86 g ha⁻¹ at 14 DAA and 10.30 g ha⁻¹ at 28 DAA, demonstrating a more prolonged residual effect of nicosulfuron. Thus, while nicosulfuron is effective against grasses, it should be used cautiously in long-duration intercrops due to potential reductions in forage growth and tillering.
Table 2. Phytotoxicity at 7, 14, 21, and 28 days after herbicide application (DAA) and dry matter yield (DMY) of Panicum maximum cv. BRS Quênia intercropped with corn as a function of glyphosate rates (Experiment 1) and nicosulfuron rates (Experiment 2)
| Trial 1: Intercropping of maize and Panicum maximum cv. BRS Quênia treated with glyphosate | |||||||||
| Variables | Glyphosate doses (g ha-1) | Regression | F0.05 | CV (%) | |||||
| 0 | 48 | 96 | 240 | 480 | 960 | ||||
| 7 DAA | 0.00 | 5.25 | 15 | 48.75 | 80 | 91.25 | Y = 87.2415/(1+exp(-(x-225.2708)/73.8737)) R² = 0.99* | 199.70* | 13.90 |
| 14 DAA | 0.00 | 1.25 | 7.50 | 52.5 | 88.75 | 97.5 | Y = 93.5655/(1+exp(-(x-227.7125)/52.2262)) R² = 0.99* | 350.78* | 11.70 |
| 21 DAA | 0.00 | 0.00 | 0.00 | 50.00 | 93.75 | 100.00 | Y = 96.8750/(1+exp(-(x-239.0061)/15.4008)) R² = 0.99* | 391.76* | 11.87 |
| 28 DAA | 0.00 | 0.00 | 0.00 | 36.25 | 91.25 | 100.00 | Y = 95.8639/(1+exp(-(x-260.4332)/40.3523)) R² = 0.99* | 149.67* | 20.24 |
DMY (kg ha-1) |
5,603.06 | 3,957.19 | 3,938.81 | 3,440.06 | 564.38 | 0.00 | Y = 5,415.5725/(1+exp(-(x-266.8881)/-124.0391)) R² = 0.94* | 21.03* | 32.52 |
| Trial 2: Intercropping of maize and Panicum maximum cv. BRS Quênia treated with nicosulfuron | |||||||||
| Variables | Nicosulfuron doses (g ha-1) | Regression | F0.05 | CV (%) | |||||
| 0 | 2.5 | 5 | 12.5 | 25 | 50 | ||||
| 7 DAA | 0.00 | 6.25 | 18.75 | 30.00 | 41.25 | 46.25 | Y = 43.9288/(1+exp(-(x- 8.5479)/ 4.1427)) R² = 0.95* | 135.97* | 13.50 |
| 14 DAA | 0.00 | 10.00 | 16.25 | 42.50 | 50.00 | 56.25 | Y = 53.1095/(1+exp(-(x-7.8573)/ 3.1826)) R² = 0.98* | 59.12* | 20.34 |
| 21 DAA | 0.00 | 12.5 | 25.00 | 60.00 | 75.00 | 81.25 | Y = 78.0565/(1+exp(-(x-8.1558)/ 3.3253)) R² = 0.98* | 103.35* | 15.95 |
| 28 DAA | 0.00 | 3.75 | 15.00 | 50.00 | 70.00 | 80.00 | Y = 75.4672/(1+exp(-(x-10.3023)/ 3.2449)) R² = 0.98* | 128.64* | 16.84 |
DMY (kg ha-1) |
3,907.31 | 2,933.44 | 1,870.31 | 1,084.13 | 511.88 | 337.31 | Y = 3,798.4617*exp(-0.1093x) R² = 0.97* | 31.97* | 28.25 |
ns – not significant; * – significant at 5% probability by the F test. CV – coefficient of variation.
These findings agree with Cruvinel et al. (2021), who evaluated post-emergence herbicides on forage grasses and observed phytotoxicity of 42.5%–55% in cv. BRS Quênia with glyphosate (200 g ha⁻¹) and nicosulfuron (7.8 and 15.6 g ha⁻¹), followed by recovery at 35 DAA; this behavior was attributed to the cultivar’s high regrowth and tillering capacity (Jank et al., 2017).
In turn, forage DMY decreased with increasing glyphosate doses, reaching 0 kg ha⁻¹ at 960 g ha⁻¹ (total control). The 50% response point was 266.89 g ha⁻¹, and the maximum modeled DMY was 5,415.6 kg ha⁻¹. In addition, DMY decreased exponentially with nicosulfuron from 12.5 g ha⁻¹, with a maximum modeled DMY of 3,798.5 kg ha⁻¹, indicating a more moderate yet persistent effect.
Table 3. Forage plant height (PHf), tussock number (TN), tiller number (TiN), and dry matter yield (DMY) of Panicum maximum cv. BRS Quênia intercropped with corn as a function of glyphosate rates (Experiment 1) and nicosulfuron rates (Experiment 2) assessed before soybean sowing.
| Trial 1: Intercropping of maize and Panicum maximum cv. BRS Quênia treated with glyphosate | |||||||||
| Variables | Glyphosate doses (g ha-1) | Regression | F0.05 | CV (%) | |||||
| 0 | 48 | 96 | 240 | 480 | 960 | ||||
| PHf (m) | 0.75 | 0.77 | 0.78 | 0.65 | 0.61 | 0.00 | Y = 0.8312-0.0008x R² = 0.91* | 124.99* | 9.00 |
| TN (n m-2) | 7.50 | 8.25 | 7.00 | 8.00 | 3.50 | 0.00 | Y = 8.3278-0.0086x R² = 0.92* | 42.41* | 17.69 |
| TiN (n m-2) | 115.50 | 119.50 | 104.75 | 92.50 | 40.25 | 0.00 | Y = 123.3556/(1+exp(-(x-382.1402)/-134.4416)) R² = 0.99* | 32.72* | 22.03 |
DMY (kg ha-1) |
1,237.27 | 1,125.57 | 1,034.75 | 858.55 | 277.50 | 0.00 | Y = 1.303.0804/(1+exp(-(x-312.7553/-133.4239)) R² = 0.99* | 59.23* | 17.24 |
| Trial 2: Intercropping of maize and Panicum maximum cv. BRS Quênia treated with nicosulfuron | |||||||||
| Variables | Nicosulfuron doses (g ha-1) | Regression | F0.05 | CV (%) | |||||
| 0 | 2.5 | 5 | 12.5 | 25 | 50 | ||||
| PHf (m) | 0.62 | 0.61 | 0.59 | 0.49 | 0.59 | 0.56 | No model fit | 4.68* | 7.46 |
| TN (n m-2) | 7.00 | 7.25 | 8.50 | 7.75 | 6.75 | 7.00 | Y = 7.38 | 1.55ns | 14.06 |
| TiN (n m-2) | 139.00 | 124.75 | 126.50 | 121.00 | 124.00 | 81.25 | Y = 119.42 | 2.74ns | 19.93 |
DMY (kg ha-1) |
1,197.83 | 1,244.03 | 1,094.16 | 966.08 | 1,088.64 | 641.67 | Y = 1,202.6730-10.3540x R² = 0.82* | 4.67* | 19.34 |
ns – not significant; * – significant at 5% probability by the F test. CV – coefficient of variation.
Table 3 presents forage height, tussock number (TN), tiller number (TiN), and DMY before soybean sowing. Height and TN decreased linearly with glyphosate doses, at 0.0008 m and 0.0086 m⁻² per g a.e. ha⁻¹, respectively. TiN and DMY fit sigmoidal models (R² = 99%); 50% response doses were 382.14 and 312.76 g ha⁻¹, with maximum values of 123.36 m⁻² and 1,303.1 kg ha⁻¹, respectively. Moreover, no straw was formed at the highest dose (960 g ha⁻¹), confirming effective forage control. Similar responses were reported by Silva et al. (2023a) for P. maximum cv. BRS Zuri, with a 50% reduction in productivity at 229 g a.e. ha⁻¹.
TN and TiN were not affected in the nicosulfuron experiment, averaging 7.38 and 119.42 m⁻², respectively. However, DMY decreased linearly (R² = 82%), at 10.35 kg ha⁻¹ per g a.e. ha⁻¹. The intercept (dose 0) was 1,202.7 kg ha⁻¹, indicating high productive potential in the absence of herbicide. Although nicosulfuron did not markedly alter forage architecture, it reduced total biomass, potentially compromising soil cover in more intensive management systems.
As noted by Mello et al. (2023), higher forage DMY can intensify competition with corn; nevertheless, it also contributes to organic matter accumulation and high-quality straw formation. Cruvinel et al. (2021) highlighted that the shorter stature of cv. BRS Quênia facilitates mechanical management, while Silva et al. (2023a) associated height reductions with growth retardation following glyphosate, at 0.0010 m per g a.e. ha⁻¹. Mello et al. (2024) reported decreases of 0.0113 m in forage height and 0.1704 t ha⁻¹ in forage productivity for each 1 g ha⁻¹ of nicosulfuron, emphasizing the need to keep forage height below corn ear height to ensure efficient harvest without excessively compromising biomass.
The soybean agronomic variables measured after the intercrop (Table 4)—plants per meter, pods per plant, seeds per pod, thousand-seed weight, and grain yield—were not significantly affected by glyphosate or nicosulfuron doses. Hence, herbicide residues from the intercrop did not influence the performance of the subsequent crop. In addition, thousand-seed weight did not fit any regression model, indicating stability across doses.
Soybean grain yield did not differ between intercrop and sole-crop systems in either experiment, confirming that the forage did not compromise productivity. Although direct yield gains were not evident, intercropping provides important ecological and agronomic benefits, including increased soil organic matter and improved physical structure. Huot et al. (2020) noted that tropical grasses access nutrients from deeper layers and gradually release them to subsequent crops, whereas Peterson et al. (2019) and Soares et al. (2023) reported that ground cover reduces evaporation, improves nutrient cycling, and supports soybean root development. These benefits translate into greater system resilience and reduced management costs.
Muniz et al. (2021) observed that CLI systems provide greater ground cover and nutrient cycling than soybean–corn succession, resulting in higher soybean yield and agricultural sustainability. Therefore, even when yield does not increase, intercropping with forage adds cumulative benefits to the production system.
Weed assessments in the glyphosate study (Table 5) showed that weed density followed a quadratic model (R² = 94%) at 57 DAA, with a maximum at 709.75 g a.e. ha⁻¹. Total weed dry mass increased linearly (0.011 g m⁻² per additional g ha⁻¹), suggesting that lower glyphosate doses reduced weed density and biomass, likely due to shading from more vigorous forage growth.
Table 4. Plants per meter (PM), pods per plant (PPP), seeds per pod (SPP), thousand-seed weight (TSW), and grain yield (GY) of soybean grown after corn–Panicum maximum cv. BRS Quênia intercrop as a function of glyphosate rates (Experiment 1) and nicosulfuron rates (Experiment 2)
| Trial 1: Intercropping of maize and Panicum maximum cv. BRS Quênia treated with glyphosate | ||||||||||
| Variables | Glyphosate doses (g ha-1) | Regression | CM | F0.05 | CV (%) | |||||
| 0 | 48 | 96 | 240 | 480 | 960 | |||||
| PM (n m-1) | 10.67 | 10.96 | 10.54 | 10.79 | 9.83 | 9.33 | Y = 10.17 | 9.04 | 3.04ns | 8.60 |
| PPP | 70.55 | 81.45 | 68.00 | 70.10 | 76.15 | 75.75 | Y = 73.23 | 70.60 | 0.36ns | 21.70 |
| SPP | 2.30 | 2.32 | 2.31 | 2.33 | 2.31 | 2.32 | Y = 2.31 | 2.25 | 0.14ns | 6.30 |
| TSW (g) | 186.32 | 190.30 | 183.37 | 188.76 | 172.40 | 188.20 | Y = 183.51 | 175.22 | 1.19ns | 6.99 |
GY (kg ha-1) |
3,561.66 | 4,258.89 | 3,644.78 | 4,711.46 | 4,154.05 | 4,878.36 | Y = 4,216.40 | 4,305.62 | 1.32ns | 20.31 |
| Trial 2: Intercropping of maize and Panicum maximum cv. BRS Quênia treated with nicosulfuron | ||||||||||
| Variables | Nicosulfuron doses (g ha-1) | Regression | CM | F0.05 | CV (%) | |||||
| 0 | 2.5 | 5 | 12.5 | 25 | 50 | |||||
| PM (n m-1) | 11.54 | 11.08 | 11.33 | 10.42 | 11.58 | 11.42 | Y = 11.05 | 10.00 | 1.06ns | 10.73 |
| PPP | 51.30 | 60.65 | 61.45 | 53.95 | 53.75 | 59.50 | Y = 57.19 | 59.70 | 0.86ns | 15.26 |
| SPP | 2.48 | 2.45 | 2.22 | 2.30 | 2.18 | 2.52 | Y = 2.36 | 2.35 | 2.80ns | 6.67 |
| TSW (g) | 198.91 | 199.62 | 205.42 | 199.40 | 178.75 | 187.01 | No model fit | 194.00 | 8.20* | 3.25 |
GY (kg ha-1) |
5,759.26 | 5,368.08 | 5,657.47 | 5,301.89 | 5,117.40 | 5,147.25 | Y = 5,354.68 | 5,131.44 | 0.44ns | 14.66 |
ns – not significant; * – significant at 5% probability by the F test. CM – corn monocropping. CV – coefficient of variation.
Table 5. Weed density (WD) and dry mass (DM) in corn intercropped with Panicum maximum cv. BRS Quênia treated with glyphosate at 57, 95, and 297 days after application (DAA)
| Variables | Glyphosate doses (g ha-1) | Regression | CM | F0.05 | CV (%) | |||||
|---|---|---|---|---|---|---|---|---|---|---|
| 0 | 48 | 96 | 240 | 480 | 960 | |||||
| 57 DAA (reproductive stage of corn) | ||||||||||
| WD (plants m⁻²) | 1.50 | 2.25 | 2.00 | 24.25 | 54.75 | 45.25 | Y = -5.7100+0.1724x-0.0001x² R² = 0.94* | 52.00 | 15.03* | 48.70 |
| WM (g m⁻²) | 0.11 | 0.21 | 0.09 | 1.89 | 9.85 | 9.09 | Y = 0.1329+ 0.011x r² = 0.77* | 4.93 | 8.21* | 79.86 |
| 95 DAA (corn harvest) | ||||||||||
| WD (plants m⁻²) | 0.00 | 0.00 | 0.00 | 13.00 | 35.50 | 29.75 | Y = 1.6719+ 0.0374x r² = 0.72* | 37.00 | 5.12* | 92.55 |
| WM (g m⁻²) | 0.00 | 0.00 | 0.00 | 18.09 | 10.76 | 43.09 | Y = -1.2362+ 0.0435x r² = 0.88* | 39.08 | 4.64* | 108.54 |
| 297 DAA (45 days after soybean sowing) | ||||||||||
| WD (plants m⁻²) | 13.75 | 18.50 | 18.50 | 14.00 | 16.00 | 23.75 | Y = 17.42 | 26.25 | 1.55ns | 40.93 |
| WM (g m⁻²) | 50.33 | 34.04 | 42.32 | 58.16 | 79.75 | 64.13 | Y = 54.78 | 102.02 | 2.84* | 44.80 |
ns – not significant; * – significant at 5% probability by the F test. CM – corn monocropping. CV – coefficient of variation.
Both weed density and dry mass increased linearly at corn harvest by 0.0374 m⁻² and 0.0435 g m⁻² per g ha⁻¹ of glyphosate, respectively. This response reflects reduced forage cover at higher doses, which lowers forage DMY and increases light incidence at the soil surface. Mello et al. (2023) reported similar patterns, and Summers et al. (2021) observed that high-biomass Panicum species reduce weed emergence and the need for herbicides in subsequent crops.
In turn, mean weed density in the soybean crop at 295 DAA was 17.42 m⁻² and mean dry mass was 54.78 g m⁻², with no differences among doses. However, the intercrop showed lower values than the sole crop, indicating residual suppression
Table 6. Weed density and dry mass in corn intercropped with Panicum maximum cv. BRS Quênia treated with nicosulfuron at 57, 95, and 297 days after application (DAA).
| Variables | Nicosulfuron doses (g ha-1) | Regression | CM | F0.05 | CV (%) | |||||
|---|---|---|---|---|---|---|---|---|---|---|
| 0 | 2.5 | 5 | 12.5 | 25 | 50 | |||||
| 57 DAA (reproductive stage of corn) | ||||||||||
| WD (plants m⁻²) | 1.75 | 3.75 | 4.75 | 11.00 | 21.00 | 15.25 | Y = 0.4815+1.2049x-0.018x². R² = 0.97* | 46.00 | 3.44* | 112.09 |
| WM (g m⁻²) | 0.10 | 1.43 | 0.28 | 2.55 | 3.66 | 5.16 | Y = 2.19 | 6.45 | 2.36ns | 112.39 |
| 95 DAA (corn harvest) | ||||||||||
| WD (plants m⁻²) | 1.25 | 0.75 | 0.25 | 3.00 | 7.00 | 10.25 | Y = 0.4939+ 0.2056x. r² = 0.94* | 16.25 | 17.06* | 52.33 |
| WM (g m⁻²) | 2.73 | 0.28 | 1.63 | 2.51 | 13.44 | 15.98 | Y = 6.09 | 41.84 | 10.29* | 82.71 |
| 297 DAA (45 days after soybean sowing) | ||||||||||
| WD (plants m⁻²) | 15.25 | 15.00 | 15.50 | 18.00 | 18.50 | 18.00 | Y = 16.70 | 35.00 | 1.67ns | 56.49 |
| WM (g m⁻²) | 26.30 | 37.62 | 45.43 | 73.73 | 62.56 | 74.48 | Y = 53.35 | 97.20 | 2.27ns | 54.80 |
ns – not significant; * – significant at 5% probability by the F test. CM – corn monocropping. CV – coefficient of variation.
by forage straw. This demonstrates that biomass accumulation has lasting effects on weed community control, reducing early pressure in the following crop.
The most frequent weed species in the nicosulfuron experiment (Table 6) were Alternanthera tenella, Commelina benghalensis, Eleusine indica, Digitaria horizontalis, Sida cordifolia, Digitaria insularis, Cenchrus echinatus, Chamaesyce hirta, Panicum maximum, Cyperus rotundus, Bidens pilosa, Synedrellopsis grisebachii, Euphorbia heterophylla, Ricinus communis, and Ipomoea spp. Weed density fit a quadratic model (R² = 97%) at 57 DAA, with a maximum at 33.40 g ha⁻¹. The response at harvest was linear, increasing by 0.2056 m⁻² per g ha⁻¹ of nicosulfuron due to reduced forage cover.
Weed dry mass did not significantly respond to dose, indicating that control effects were more evident on emergence than on biomass accumulation. Sole-crop corn had greater weed density and dry mass than the intercrop, reinforcing the suppressive role of the forage component. Dominschek et al. (2021) showed that intercropped forage grasses can substantially reduce herbicide needs by competing for light, water, and nutrients and by modifying the soil microenvironment, even under varying infestation pressure.
Beyond immediate effects, forage cover provides lasting physical, chemical, and biological impacts on weed suppression (Silva et al., 2023a). Mello et al. (2024) also reported fewer weed species in the Megathyrsus maximus cv. BRS Quênia intercrop than in sole-crop systems. Correia (2024) found reductions up to 75% in Digitaria insularis density during fallow when the soil was covered with forage grasses (Panicum maximum and Urochloa ruziziensis). Altogether, these results reinforce that CLI systems incorporating vigorous perennial grasses significantly contribute to sustainable weed management and to improved soil structure and fertility.
The corn–P. maximum cv. BRS Quênia intercrop is agronomically feasible when managed with intermediate herbicide doses. Glyphosate provided more effective forage control and a drastic reduction in DMY at higher doses, whereas nicosulfuron showed a moderate yet prolonged effect. Both herbicides maintained satisfactory corn productivity and provided residual cover that benefitted subsequent soybean. Balancing forage suppression with preservation of the main crop is key to a productive system that also supports sustainability and integrated weed management in Cerrado CLI systems.
Material and methods
Experimental site
Field experiments were conducted at the Instituto Federal Goiano – Campus Rio Verde (17°81'03" S, 50°90'51" W; 754 m altitude). The soil at the experimental site is a dystrophic Red Latosol, with the following chemical and physical properties in the 0–20 cm layer: pH (CaCl₂) 5.0; P = 23.8 mg dm⁻³; K = 133 mg dm⁻³; Ca = 1.57 cmolc dm⁻³; Mg = 0.90 cmolc dm⁻³; Al = 0.06 cmolc dm⁻³; base saturation = 55.9%; organic matter = 36.1 g dm⁻³; clayey texture with 51% sand, 4% silt, and 45% clay.
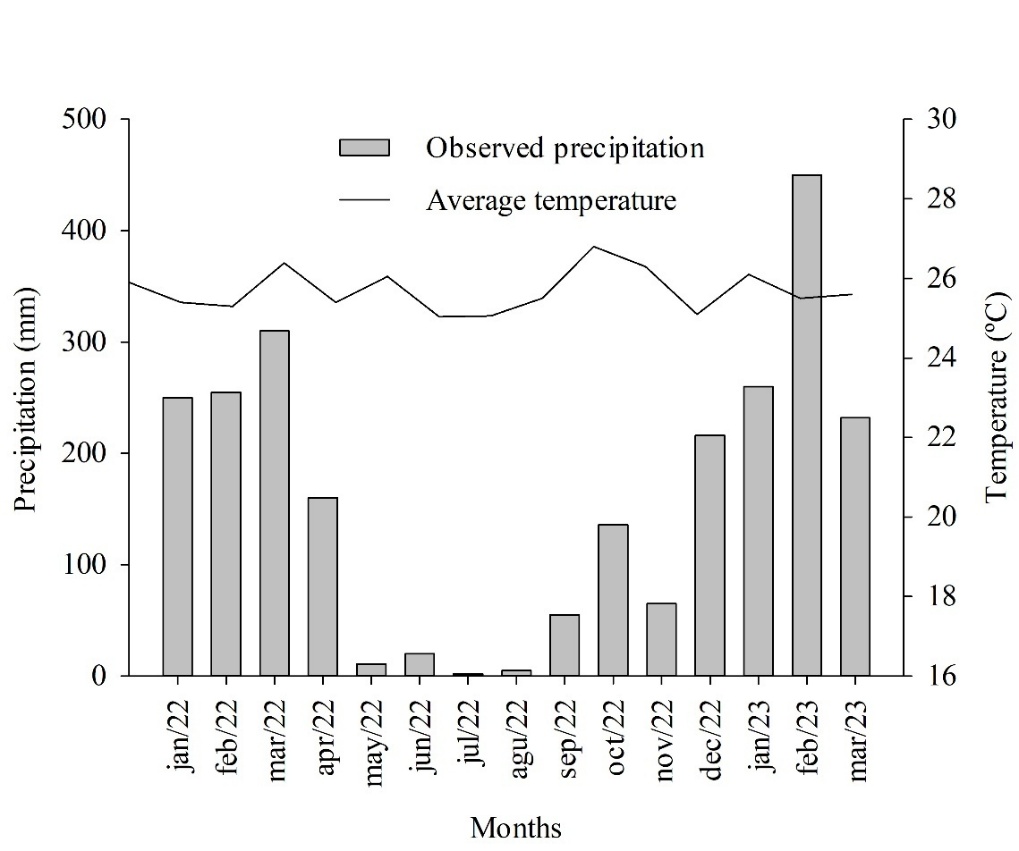
According to the Köppen climate classification, the local climate is Aw (tropical, with a rainy summer and a dry winter). Monthly averages of rainfall, temperature, and relative humidity recorded during the experiment are shown in Fig 1, using data from the National Institute of Meteorology (INMET, 2022).
Study establishment and intercropping
The area was desiccated with glyphosate (Shadow®, 1,680 g a.e. ha⁻¹) prior to sowing and the soil was prepared 15 days later with one plowing and two harrowing applications. The super-early, glyphosate-tolerant DKB 360 Pro3 corn hybrid (Dekalb) was used. Sowing took place on January 27, 2022, with a five-row planter at 0.5 m row spacing, placing seeds at 4 cm depth for an estimated stand of 60,000 plants ha⁻¹. P. maximum cv. BRS Quênia was manually broadcast at 10 kg ha⁻¹ of viable pure seed.
In addition, 300 kg ha⁻¹ of 5-25-15 (N–P–K) was applied at sowing. Topdressing supplied 150 kg ha⁻¹ N as urea at corn V4. Insecticides were applied during the crop cycle at 7, 12, and 27 days after emergence (DAE): teflubenzuron (Nomolt® 150,
Fig 1. Precipitation and average temperature during the experiments.
15 g ha⁻¹), chlorpyrifos (Capataz®) + teflubenzuron (Nomolt® 150, 480 + 15 g ha⁻¹), and thiamethoxam + lambda-cyhalothrin (Engeo Pleno™ S, 35.26 + 26.51 g ha⁻¹), respectively. Lastly, trifloxystrobin + tebuconazole (Nativo®, 75 + 187.5 g ha⁻¹) was applied at tasseling.
Before soybean sowing, desiccation was performed with glyphosate (Roundup Original DI®, 1,110 g a.e. ha⁻¹) + clethodim (Select One Pack®, 96 g ha⁻¹). Next, the early-cycle soybean cultivar Credenz CZ 37B43 IPRO was sown at 0.5-m row spacing and 15 seeds m⁻¹, 23 days after desiccation. Fertilization consisted of 350 kg ha⁻¹ of 02-20-18 (N–P–K). Lambda-cyhalothrin + thiamethoxam (Engeo Pleno™ S, 35.26 + 26.51 g ha⁻¹) and bifenthrin + imidacloprid (Galil SC®, 12.5 + 100 g ha⁻¹) insecticides and azoxystrobin + cyproconazole (Priori Xtra®, 60 + 24 g ha⁻¹) and copper oxychloride (Status®, 176.4 g ha⁻¹) fungicides were applied during the cycle.
Experimental design and herbicide treatments
The experimental design was a randomized complete block with four replications. Each plot measured 20 m² (eight 5-m rows), and the usable area consisted of 3-m sections of the four central rows. Treatments were applied at 20 DAE of corn, when the forage had four tillers. A CO₂-pressurized backpack sprayer equipped with a four-nozzle aluminum boom (TT11002) was used, with 0.5-m nozzle spacing, a spray volume of 194 L ha⁻¹, and a pressure of 2.0 bar. The air temperature at application was 32.1°C, relative humidity 56.1%, and wind speed 1.9 km h⁻¹.
Glyphosate doses (0, 48, 96, 240, 480, and 960 g a.e. ha⁻¹) were tested in the first experiment in the corn + P. maximum intercrop, plus a sole-crop corn treatment. Then, nicosulfuron doses (0, 2.5, 5.0, 12.5, 25.0, and 50.0 g ha⁻¹) were applied in the second experiment, also with an additional sole-crop corn treatment. Atrazine (Aclamado BR®, 1,500 g ha⁻¹) was used to control broadleaf weeds in all treatments. Glyphosate (Shadow®, 1,440 g a.e. ha⁻¹) + atrazine (1,500 g ha⁻¹) were applied in the sole-crop corn.
Traits measured
In corn, plant height (PH), first ear height (FEH), and stem diameter (SD) were measured in five plants per plot at 60 DAE (flowering). Then, plant population (PP), ear index (EI), percentage of broken and lodged plants (lodging/breakage index, LBI), and grain yield (GY) were determined at 123 DAE (harvest), and yields were expressed as kg ha⁻¹ at 13% moisture.
Phytotoxicity to P. maximum cv. BRS Quênia was visually scored at 7, 14, 21, and 28 days after application (DAA) using a 0–100% scale, where 0% = no injury and 100% = plant death. The forage was cut during the corn harvest at 30 cm above the soil within a 2 m² area, weighed, sub-sampled (500 g), and dried at 65°C for 72 h in a forced-air oven. Dry matter yield (DMY) was expressed as kg ha⁻¹. Forage height, tussock number (TN), tiller number (TiN), and DMY were also assessed using the same procedures before soybean sowing.
The soybean crop was harvested manually on February 21, 2023. The following parameters were evaluated: plants per meter, pods per plant, seeds per pod, thousand-seed weight, and grain yield, all expressed as kg ha⁻¹ at 13% moisture.
Weed assessments were performed at 57 and 95 DAA (reproductive phase and corn harvest, respectively) and at 295 DAA (soybean vegetative stage). Sampling used four 0.25 m² quadrats per plot (total 1 m²). Weeds were identified, counted, and dried at 65°C for 72 h to determine dry mass.
Statistical analysis
Data were subjected to regression analysis, with significance assessed by the F-test (p ≤ 0.05). Model selection was based on parsimony, biological meaning, and coefficient of determination. Residual normality was checked by the Shapiro–Wilk test (p ≤ 0.05).
Conclusions
Higher corn grain yields in intercrops are obtained at higher herbicide doses due to effective forage suppression.
Glyphosate promotes more intense and rapid suppression, reaching total control at high doses, whereas nicosulfuron provides moderate and more gradual effects. Glyphosate (~240 g a.e. ha⁻¹) and nicosulfuron (~12.5 g a.i. ha⁻¹) represent suitable management strategies, balancing forage suppression and corn yield. Intercropping corn with the forage reduces weed density and dry mass compared with sole-crop corn, while maintaining straw formation. Residual straw from the intercrop does not interfere with soybean grain yield in succession, preserving the system’s productive potential.
Acknowledgments
The authors thank Instituto Federal Goiano, the Conselho Nacional de Desenvolvimento Científico e Tecnológico (CNPq), and the Coordenação de Aperfeiçoamento de Pessoal de Nível Superior - Brazil (CAPES).
Data availability statement: The authors declare that there are no data underlying the text.
Conflict of Interest: The authors declare that they have no conflicts of interest.
Funding statement: This study was partly financed by the Conselho Nacional de Desenvolvimento Científico e Tecnológico (CNPq), grant number # 313843/2020-1.
References
Correia NM (2024) Estratégias de manejo químico e cultural de capim-amargoso resistente ao glifosato no Brasil Central. Pesqui. Agropecu. Bras., 58: e02900.
Correia NM & Lenza RAB (2024) Intercropping systems of corn and forage grasses with application of low mesotrione herbicide rates. Rev. Caatinga, 37: e12520.
Costa NL, Jank L, Magalhães JA, Bendahan AB, Rodrigues BHN, & Santos FJ (2020) Forage yield and morphogenesis of Megathyrsus maximus cultivars in Roraima’s savannas. Res. Soc. Dev., 9: 1-13.
Cruvinel AGC, Gonçalo TP, Moraes KL, Pereira BCS, Sousa JVA, & Andrade DN (2021) Effects of herbicide underdoses on the vegetative development of Panicum maximum cultivars. Científica, 49: 121-127.
Dias MBC, Costa KAP, Severiano EC, Bilego U, Furtini Neto AE, Almeida DP, Brand SC, & Lourival V (2020) Brachiaria and Panicum maximum in an integrated crop-livestock system and a second-crop corn system in succession with soybean. J. Agri. Sci., 158: 206-217.
Dominschek R, Barroso AAM, Lang CR, Moraes A, Sulc RM, & Schuster MZ (2021) Crop rotations with temporary grassland shifts weed patterns and allows herbicide-free management without crop yield loss. J. Clean. Prod., 306: 1-11.
Huot C, Zhou Y, Philp JN, & Denton MD (2020) Root depth development in tropical perennial forage grasses is related to root angle, root diameter and leaf area. Plant Soil, 456: 145-158.
INMET – Instituto Nacional de Meteorologia (2022) Informações sobre as condições climáticas em Rio Verde, GO. Available at: http://www.inmet.gov.br/. Accessed: September 2023.
Jakelaitis A, Daniel TAD, Alexandrino E, Simões LP, Souza KV, & Ludtke J (2010) Cultivares de milho e de gramíneas forrageiras sob monocultivo e consorciação. Pesqui. Agropecu. Trop., 40: 380-387.
Jank L, Andrade CMS, Barbosa RA, Macedo MCM, Valerio JR, Verzignassi JR, Zimmer AH, Fernandes CD, Santos MF, & Simeão RM (2017) O capim-BRS Quênia (Panicum maximum Jacq.) na diversificação e intensificação das pastagens. Brasília, DF: Embrapa.
Mello CEL, Lima CH, Silva JO, & Jakelaitis A (2024) Nicossulfurom no manejo de Megathyrsus maximus cv. BRS Quênia consorciado com milho. Cad. Pedag., 21: e8253.
Mello CE, Jakelaitis A, Silva CHDL, Sousa GDD, & Silva JOD (2023) Glyphosate doses in the suppression of Megathyrsus maximus cv. BRS Quênia intercropped with transgenic maize. Rev. Bras. Eng. Agric. Ambient., 27: 892-899.
Muniz MP, Costa KAP, Severiano EC, Bilego UO, Almeida DP, Furtini Neto AE, Vilela L, Lana MA, Leandro WM, & Dias MBC (2021) Soybean yield in integrated crop–livestock system in comparison to soybean–maize succession system. J. of Agric. Sci., 159: 188-198.
Peterson CA, Nunes PAA, Martins AP, Bergamaschi H, Anghinoni I, Carvalho PCF, & Gaudin AC (2019) Winter grazing does not affect soybean yield despite lower soil water content in a subtropical crop-livestock system. Agron. Sustain. Dev., 39: 1-10.
Silva CHDLE, Mello CE, Silva JOD, Jakelaitis A, Marques RP, Sousa GDD, & Silva EJD (2023a) Use of glyphosate in the management of Panicum maximum cv. BRS Zuri intercropped with maize. Rev. Bras. Eng. Agric. Ambient., 27: 795-802.
Silva JAG, Costa KAP, Silva LM, Severiano EC, Silva FG, Habermann E, Martinez CA, Vilela L, Silva AG, Costa AC, Costa JVCP, & Oliveira KJ (2023b) Integrated systems improve the sustainability of soybean cultivation in the tropical region. Front. Sustain. Food Syst., 7: 1224530.
Simões VJLP, Souza ES, Martins AP, Tiecher T, Bremm C, Ramos JS, Farias GD, & Carvalho PCF (2023) Structural soil quality and system fertilization efficiency in integrated crop-livestock system. Agric. Ecosyst. Environ., 349: 108453.
Soares DDA, Modesto VC, Nakao AH, Soares WR, Freitas LA, Dickmann L, Pascoaloto IM, & Andreotti M (2023) Soybean yield and nutrition grown on the straw of grain sorghum inoculated with Azospirillum brasilense and intercropped with BRS Paiaguás grass. Plants, 12: 2007.
Summers H, Karsten HD, Curran W, & Malcolm GM (2021) Integrated weed management with reduced herbicides in a no-till dairy rotation. Agron. J., 113: 3418-3433.
Valote PD, Carvalho CAB, Freitas CAS, Morenz MJF, Paciullo DSC, & Gomide CADM (2021) Forage mass and canopy structure of Zuri and Quênia guineagrasses pasture under rotational stocking. Rev. Bras. Zootec., 50: e20200225.
Zolin CA, Matos ES, Magalhães CAS, Paulino J, Lal R, Spera ST, & Behling M (2021) Short-term effect of a crop-livestock-forestry system on soil, water and nutrient loss in the Cerrado-Amazon ecotone. Acta Amazon., 51: 102-112.