
Aust J Crop Sci. 19(04):378-387 (2025) | ISSN:1835-2707
https://doi.org/10.21475/ajcs.25.19.04.p260
Impacts of corn flowering on estimation of evapotranspiration using remote sensing in Brazilian Savanna
Fillipe de Paula Almeida, José Alves Júnior*, Fábio Miguel Knapp, João Maurício Fernandes Souza, Antonio Heriberto de Castro Teixeira, Adão Wagner Pêgo Evangelista, Derblai Casaroli, Rafael Battisti
School of Agronomy, Department of Soil and Water, Federal University of Goiás (UFG), Zip code 74.690.900, Goiania, Goiás, Brazil
*Corresponding author: José Alves Júnior 
 ORCID ID:
000-0002-1187-3
ORCID ID:
000-0002-1187-3
Abstract: Estimation of evapotranspiration using remote sensing is a promising and low-cost alternative, but there is a lack of studies to calibrate the algorithm for different crops and atmospheric conditions. In this context, the objective of the study was to evaluate the efficiency of the SAFER algorithm in estimating evapotranspiration of corn crops (ETa) in three different sources of surface albedo. The study was carried out in a corn (cultivar AG8700) production (March to Jully) area irrigated by central pivot in Itaberaí-GO, Brazil, in 2021. The region's climate is characterized as Aw, with two well-defined seasons, dry winter and rainy summer, and the soil was classified as Red Oxisol of medium texture. Images from a multispectral and thermal camera model MicaSense Altum and albedo images from the Landsat 8 (each 16 days) and Sentinel 2A (each 10 days) satellites were used to estimate the ETa using the SAFER algorithm. These data were compared with ETc (Crop evapotranspiration) obtained by FAO, Embrapa and climatological water balance methods based on statistical indices. In general, the best correlation with standard methods was the Drone method, mainly the FAO and BHC methods. On average, the EQM (mean square error) was less than 0.22 mm day-1. The agreement index ranged from 0.84 to 0.91. The largest errors were observed in phase III, due to contamination of albedo and NDVI pixels caused by screwing. This error was greater for the DroneLand and DroneSent methods. On average the EQM and EMA (mean absolute error) were close to 1 mm day-1, the confidence index was below 0.74 for all methods. Thus, the use of images from multispectral and thermal cameras proved to be a good tool for estimating evapotranspiration. Corn crop flowering interferes with the estimated values of NDVI and surface albedo, leading to greater underestimation. However, when drone images are used to calculate the three SAFER variables, this effect is mitigated. ETa estimation by remote sensing is not recommended for the reproductive phase of corn crop.
Keywords: Drone, energy balance, geoprocessing, flower tassel.
Abbreviations: ETa - Real Crop Evapotranspiration; ETc - Potential Crop Evapotranspiration; ETo - Reference evapotranspiration; Rg - Global radiation; Ta - Average air temperature; SAFER - Simple Algorithm For Evapotranspiration Retrieving; FAO - Food Agriculture Organization; EMBRAPA - Brazilian agricultural research company; BHC - Climatological water balance; REMA - root mean absolute error; EMA - Mean absolute error; EQM - Mean square error; NDVI - Normalized Difference Vegetation Index; Kc - Crop evapotranspiration coeficiente; VT - Vegetative phase; R - correlation coefficient; d - concordance index; c - confidence index; Drone – ETa obtained by drone images; DroneLand - ETa obtained by drone images and albedo extracted from LandSat 8 satellite; DroneSent – ETa obtained by drone images and albedo extracted from Sentnel 2 satellite.
Introduction
Corn (Zea mays L.) is a crop of great economic importance, being one of the main traded commodities (Lopes et al., 2019). According to data published by the United States Department of Agriculture USDA (2021), corn is also the most cultivated grain in the world. It plays a significant role in food security and industry, mainly in the production of energy (ethanol) and animal feed. Brazil is the 3rd largest corn producer in the world, behind the United States and China, together they produce more than 60% of all grain produced in the world annually. Furthermore, it is one of the five largest corn exporters (USDA, 2021).
Despite the country's large production, average productivity is still low. Among the various factors that cause a drop in productivity (genetics, nutrition, phytosanitary control), water deficit is one of the most responsible, mainly due to irregularities in the distribution of precipitation (Sah et al., 2020). Within this scenario, it is essential to know the evapotranspiration (ET) of the corn crop, to estimate productivity and productivity decline. Because, it is mainly cultivated during the rainy season and dry spells directly influence these losses.
Therefore, corn is among the five most irrigated crops in Brazil, and the state of Goiás is among the four with the largest irrigated area (ANA, 2021). Corn production is concentrated in the 1st and 2nd harvest, requiring supplementary irrigation, and knowledge of evapotranspiration (ETc) is essential, both to better manage water resources and to better develop irrigation projects and management.
ET is the process in which water from soil (evaporation) and plants (transpiration) are released into the atmosphere (Fenner et al., 2019). Drought events are increasingly frequent in several areas of the world, which directly affects rainfed crops. Thus requiring a more careful assessment in the feeding of estimation and breakdown models, in addition to irrigation needs (Granata, 2019).
Obtaining different levels of evapotranspiration can be achieved by direct or indirect methods (Evett et al., 2015). Among the indirect methods, remote sensing has been studied and recommended for estimating the evapotranspiration of various crops. Such as: dry beans (Sales et al., 2016), tomatoes (Sales et al., 2017), (Sena, 2021), sugar cane (Souza et al., 2020; Mussi et al., 2020), lawn (Aldrighi, 2020), pasture (Andrade, 2015) and corn (Teixeira et al., 2021). However, many authors warn about the low temporal resolution of the Landsat 8 and Sentinel 2A satellites (16 and 10 days, respectively). This limitation can be resolved with the use of multispectral and thermal cameras coupled to drones. Another problem also reported in the literature, but little studied, is the low quality of the data estimated in the initial and final phases of the crop, due to the soil being poorly covered by the plants and the yellowing of the leaves. And in the case of sugar cane, corn, sorghum and millet there is also a problem with flowering crop. This causes contamination of the NDVI (Normalized Difference Vegetation Index) and albedo pixels, resulting in lower ET values. There is a need to know how this problem can be alleviated by using different image sources, with different pixel sizes.
The pixel size of the Landsat 8 image is 30 x 30 m, Sentinel 2A 10 x 10 m and the drone 0.06 x 0.06 m. According to Nádudvari et al. (2020) drone images are of higher resolution and provide more detailed information. Which leads to more reliable results. And due to this greater detail and reliability, drone data, together with field measurements, are used to calibrate orbital images. There are several studies that report the advantages of using drone images, such as Padró et al. (2018) who found a good correlation between the drone's spectroradio- metric and measurements carried out in the field. And Morgan et al. (2020) who state that the drone data worked for their work as a bridge to what the satellite was seeing.
To calculate energy flows through remote sensing images, it is necessary to use algorithms to obtain the elements (Bezerra et al., 2008). SAFER (Simple Algorithm For Evapotranspiration Retrieving) developed by Teixeira et al. (2012) stands out. The algorithm has shown good results for estimating ET in large and heterogeneous areas. It is a simplified algorithm, as it is not mandatory to use the thermal band. To use it, only three variables are needed: surface albedo, NDVI and surface temperature. In addition to the existence of a meteorological station close to the area of interest, to obtain reference evapotranspiration (ETo), global radiation (Rg) and average air temperature (Ta).
Therefore, the objective of this study was to estimate corn ET using remote sensing and evaluate the impact of crop flowering on this estimate, using images from a multispectral and thermal camera coupled to a drone. And if images collected closer to the plants can mitigate this effect.
Results and Discussion
Air Temperature, rainfall and irrigation
During the cycle the average temperature was 21.03 °C. The extreme limits tolerated by corn are between 10ºC and 30ºC. The ideal temperature from emergence to flowering is between 24ºC and 30ºC (Landau et al., 2005), therefore, the average air temperature throughout the cycle was conducive to the good development of the plant (Thermal sum of 1.478,54 oC). Accumulated precipitation was 141.6 mm, irrigation was 214.9 mm, totaling 356.5 mm during the entire cycle.
Water, nutritional, phytosanitary status and productivity of corn crops
The harvest was carried out on August 3rd, totaling 132 days of cycle. Productivity was 6.1 t ha-¹, 25% above the average for the 2nd harvest for Goiás (CONAB, 2022).
During the cycle there was an infestation of leafhoppers, causing stunting, a disease that affected the development of the crop, causing biotic stress. In several plants, the second corn cob was aborted. A nutritional deficiency in phosphorus was found, with values between 1.06 g kg-1 and 1.22 g kg-1. Values below the limits established by Martinez et al. (1999) which vary between 6 g kg-1 and 20 g kg-1. Figure 1 illustrates the water potential in the leaf throughout the cycle. The average potential was 0.48 Mpa, remaining below the critical level established by Bono et al. (2001) which varies between 0.8 (water stress) and 1.2 Mpa (water deficit), showing that the plants did not suffer water stress.
Figure 2 represents the temporal variation of soil moisture, irrigation and precipitation (rain fall). Soil moisture throughout the crop cycle remained above the critical level in the 0.0 – 0.5 m layers. The corn crop did not suffer water stress at any stage of development.
Crop evapotranspiration
For atmospheric correction of the Sentinel 2A albedo data, Equation 15 was used, correcting the values of “a”
Table 1. Mean square error (EQM, mm day-1), mean absolute error (EMA, mm day-1), root mean absolute error (REMA, mm day-1), correlation coefficient (r), concordance index (d ) and confidence index (c) for the evapotranspiration values obtained by the Drone, DroneLand and DroneSent methods comparing them to the ETFAO, ETEmbrapa and ETBHC methods.
| Method | EQM | EMA | REMA | r | d | c | Classification |
|---|---|---|---|---|---|---|---|
| FAO | |||||||
| Drone | 0.080 | 0.254 | 0.099 | 0.93 | 0.92 | 0.86 | Great |
| DroneLand | 0.414 | 0.576 | 0.222 | 0.90 | 0.70 | 0.63 | Median |
| DroneSent | 0.425 | 0.593 | 0.227 | 0.91 | 0.71 | 0.65 | Good |
| Embrapa | |||||||
| Drone | 0.191 | 0.391 | 0.138 | 0.98 | 0.86 | 0.84 | Very good |
| DroneLand | 0.760 | 0.780 | 0.275 | 0.81 | 0.61 | 0.50 | Bad |
| DroneSent | 0.582 | 0.701 | 0.256 | 0.94 | 0.69 | 0.65 | Good |
| BHC | |||||||
| Drone | 0.384 | 0.157 | 0.066 | 0.94 | 0.96 | 0.91 | Great |
| DroneLand | 0.293 | 0.456 | 0.182 | 0.86 | 0.73 | 0.63 | Median |
| DroneSent | 0.281 | 0.457 | 0.182 | 0.89 | 0.77 | 0.69 | Good |
| Drone | |||||||
| DroneLand | 0.201 | 0.388 | 0.163 | 0.87 | 0.75 | 0.66 | Good |
| DroneSent | 0.153 | 0.349 | 0.150 | 0.93 | 0.83 | 0.78 | Very Good |
| DroneLand | |||||||
| DroneSent | 0.030 | 0.141 | 0.071 | 0.90 | 0.94 | 0.84 | Very Good |
and “b” used in the equation for transforming albedo from the top of the atmosphere into surface albedo. The coefficient values for Landsat 8 were maintained according to Teixeira (2010):
\(\alpha_{0} = 0.7184*\alpha\ top + 0.008\) (15)
Another limitation in estimating evapotranspiration from satellite images is the presence of clouds, especially during the rainy season. The clouds over the study area make it impossible to obtain the algorithm variables. The use of drone images provided better detail of the area, better NDVI indexes, temperature and pixel size. However, on the dates where clouds were present (07/April, 17/April, 27/April, 23/May) the estimation using the DroneLand and DroneSent method was also discarded, as the albedo variable was not obtained.
The underestimation of Kc at the beginning of the cycle is reported by several authors, such as Sales et al. (2016) for the bean crop, Sales et al. (2017) for tomato cultivation and Oliveira et al. (2020) for sugar cane. This fact is due to the large amount of exposed soil or straw, generating Kc’s close to zero. This factor was not observed for this study area, due to the loss of orbital images due to cloud cover at the beginning of the cycle (Figure 2).
Figure 3 illustrates the comparison of kc between drone methods compared to FAO and Embrapa. It is possible to observe a greater underestimation during the reproductive phase, due to the emergence of the tassel (flowering). This effect was greater in DroneSent, as Sentinel 2A has better spatial and temporal resolution than Landsat 8, capturing images immediately before and at the beginning of the corn flowering. This effect caused a drop in albedo values (Figure 4). This effect was also noticeable in DroneLand, and was only not more intense due to the longer interval between images and the incidence of clouds on the date of 23/May/21 at 61 DAP, which coincides with the beginning of flowering.
ETDrone obtained better results compared to other methods with drone images, as the best spatial and temporal resolution made it possible to select the best albedo pixels, thus reducing contamination. According to
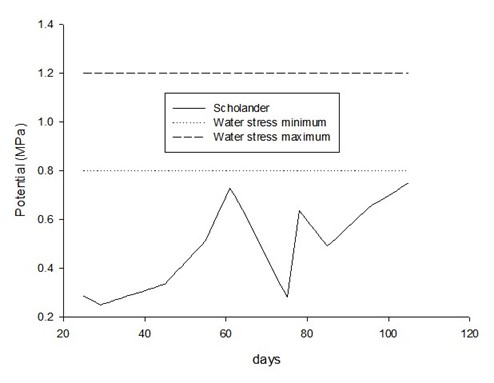
Figure 1. Leaf water potential obtained by Scholander chamber for corn crops according to the methodology of Bono et al. (2001).
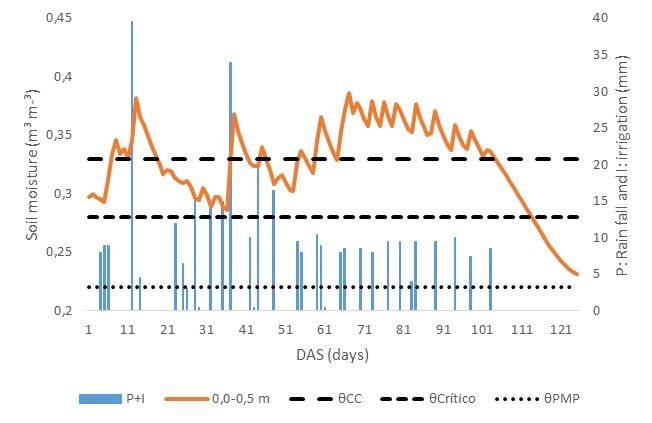
Figure 2. Temporal variation of soil moisture in the 0.0-0.5 m layers and precipitation with irrigation.
Table 2. Mean square error (EQM, mm day-1), mean absolute error (EMA, mm day-1), root mean absolute error (REMA, mm day-1), correlation coefficient (r), concordance index (d) and confidence index (c) for the evapotranspiration values obtained by corn development stage using the Drone, DroneLand and DroneSent methods comparing them to the ETFAO, ETEmbrapa and ETBHC methods.
|
EQM | EMA | REMA | R | d | c | Classification | |||||
|---|---|---|---|---|---|---|---|---|---|---|---|---|
|
||||||||||||
|
||||||||||||
|
0.054 | 0.200 | 0.080 | 0.90 | 0.90 | 0.81 | Very Good | |||||
|
0.363 | 0.577 | 0.232 | 0.92 | 0.71 | 0.65 | Good | |||||
|
0.225 | 0.456 | 0.156 | 0.75 | 0.46 | 0.34 | Very Bad | |||||
|
||||||||||||
|
0.346 | 0.584 | 0.192 | 0.98 | 0.61 | 0.60 | Median | |||||
|
1.276 | 1.102 | 0.366 | 0.80 | 0.39 | 0.31 | Very Bad | |||||
|
0.626 | 0.766 | 0.237 | 0.60 | 0.34 | 0.20 | Very Bad | |||||
|
||||||||||||
|
0.038 | 0.163 | 0.071 | 0.88 | 0.91 | 0.81 | Very Good | |||||
|
0.267 | 0.492 | 0.207 | 0.92 | 0.73 | 0.68 | Good | |||||
|
0.136 | 0.336 | 0.120 | 0.41 | 0.43 | 0.18 | Very Bad | |||||
|
||||||||||||
|
0.318 | 0.518 | 0.216 | 0.85 | 0.60 | 0.52 | Bad | |||||
|
0.062 | 0.208 | 0.077 | 0.69 | 0.64 | 0.44 | Bad | |||||
|
||||||||||||
|
0.091 | 0.270 | 0.127 | 0.38 | 0.52 | 0.20 | Very Bad | |||||
|
||||||||||||
|
||||||||||||
|
0.136 | 0.364 | 0.124 | 0.98 | 0.74 | 0.73 | Good | |||||
|
0.868 | 0.926 | 0.317 | 0.99 | 0.42 | 0.42 | Bad | |||||
|
0.716 | 0.836 | 0.286 | 0.91 | 0.45 | 0.41 | Bad | |||||
|
||||||||||||
|
0.218 | 0.462 | 0.152 | 0.98 | 0.67 | 0.66 | Good | |||||
|
1.061 | 1.024 | 0.339 | 0.99 | 0.40 | 0.40 | Bad | |||||
|
0.891 | 0.934 | 0.309 | 0.912 | 0.43 | 0.39 | Bad | |||||
|
||||||||||||
|
0.071 | 0.241 | 0.085 | 0.91 | 0.80 | 0.73 | Good | |||||
|
0.657 | 0.801 | 0.287 | 0.92 | 0.43 | 0.39 | Bad | |||||
|
0.546 | 0.721 | 0.258 | 0.83 | 0.45 | 0.38 | Bad | |||||
|
||||||||||||
|
0.319 | 0.561 | 0.219 | 0.99 | 0.54 | 0.53 | Bad | |||||
|
0.234 | 0.472 | 0.185 | 0.91 | 0.59 | 0.54 | Bad | |||||
|
||||||||||||
|
0.169 | 0.407 | 0.204 | 0.99 | 0.58 | 0.57 | Bad | |||||
| PHASE IV | ||||||||||||
| FAO | ||||||||||||
| Drone | 0.040 | 0.176 | 0.076 | 0.99 | 0.95 | 0.95 | Great | |||||
| DroneLand | 0.197 | 0.383 | 0.164 | 0.97 | 0.78 | 0.77 | Very Good | |||||
| DroneSent | 0.327 | 0.502 | 0.217 | 0.97 | 0.68 | 0.66 | Good | |||||
| Embrapa | ||||||||||||
| Drone | 0.066 | 0.226 | 0.095 | 0.99 | 0.93 | 0.93 | Great | |||||
| DroneLand | 0.252 | 0.432 | 0.180 | 0.97 | 0.76 | 0.74 | Good | |||||
| DroneSent | 0.397 | 0.552 | 0.232 | 0.96 | 0.66 | 0.64 | Median | |||||
| BHC (Climatical Water Balance) | ||||||||||||
| Drone | 0.015 | 0.097 | 0.049 | 0.96 | 0.98 | 0.95 | Great | |||||
| DroneLand | 0.085 | 0.223 | 0.102 | 0.94 | 0.87 | 0.82 | Very Good | |||||
| DroneSent | 0.169 | 0.339 | 0.157 | 0.93 | 0.76 | 0.71 | Good | |||||
| Drone | ||||||||||||
| DroneLand | 0.060 | 0.206 | 0.096 | 0.98 | 0.90 | 0.89 | Great | |||||
| DroneSent | 0.138 | 0.326 | 0.154 | 0.98 | 0.78 | 0.77 | Very Good | |||||
| DroneLand | ||||||||||||
| DroneSent | 0.018 | 0.119 | 0.070 | 0.98 | 0.94 | 0.93 | Great | |||||
Liang (2001), surface albedo is affected by vegetation morphology, which justifies this effect.
Pang et al. (2022), researching the variation in surface albedo over time and in different soil covers, concluded that this index has a negative correlation with the soil covered by vegetation and soil moisture. In other words, the lower the vegetation cover and soil moisture, the higher the albedo values. In addition to the fact that data obtained by satellites, in general, has lower spatial and temporal resolution than compared to measurements close to the plant (drone), this makes comparison between data difficult (Dittmann et al., 2019).
The feathering also caused NDVI contamination of the drone images. Figure 5 proves the contamination of pixels in the NDVI image, due to the appearance of the tassel (flowering). In 61 days after sowing (planting), the beginning of tasseling (flowering) was observed, 4 days later most of the plants had tassels (flowered), in the VT phase (vegetative phase).
Figure 6A illustrates the temporal variation in surface temperature during the corn crop cycle, it is possible to observe higher values at the beginning due to greater exposure of the soil to the sun (conventional planting). Figure 6B represents the distribution of NDVI throughout the cycle. Note the increase in values during the vegetative stage, later stabilization during the reproductive stage and the decrease from the beginning of senescence.
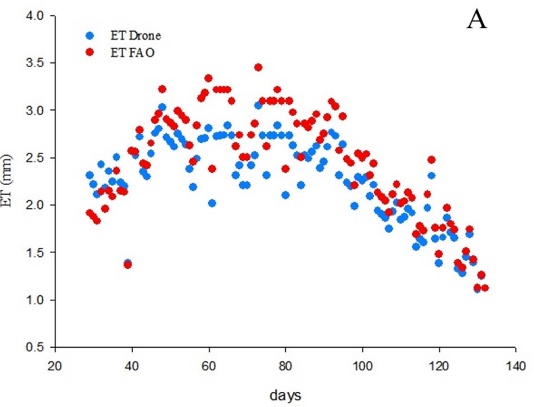
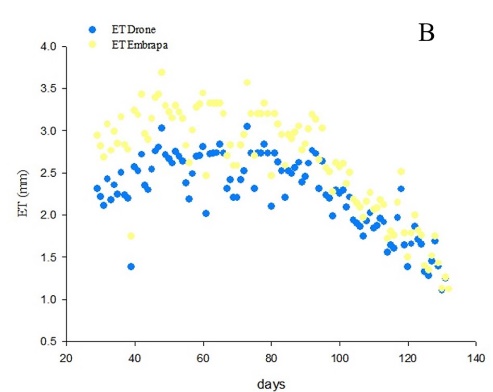
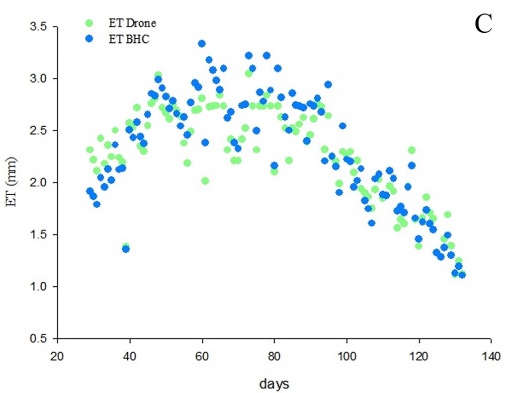
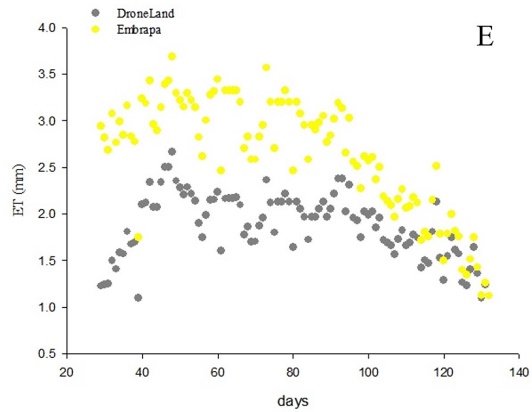
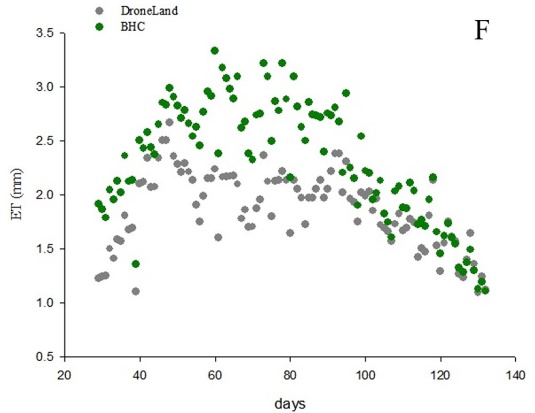
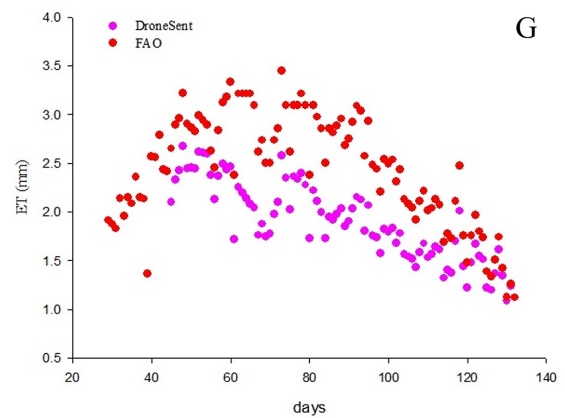
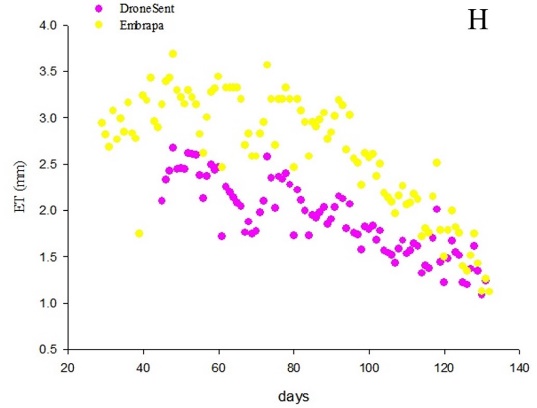
Table 1 and Figure 7 show the evapotranspiration values and the statistical indices of the ETDrone, ETDroneLand and ETDroneSent estimates with the FAO, Embrapa and BHC method for the entire corn crop cycle. In general, the Drone method obtained better results compared to FAO, Embrapa and (Climatical water balance) BHC. The correlation ranged from “very good” to “excellent”. The results were better compared to other drone methods as they did not depend on the albedo of the satellites, which were more affected by tilting (flowering). The mean square error (EQM) values were 0.080, 0.191 and 0.384 mm day-1, for the mean absolute error (EMA) it was 0.254, 0.391 and 0.157 mm day-1 for ETFAO, ETEmbrapa and ETBHC when compared with the ETDrone, respectively. The root mean absolute error was less than 0.1 for the FAO (Allen et al., 1998) and BHC methods (Thornthwaite and Mather, 1955).
ETDroneLand presented the worst results, obtaining an “average” rating from FAO and BHC and “poor” from Embrapa. The mean values of EQM, EMA and REMA were 0.489, 0.604 and 0.226 mm, respectively. This is due to the smaller number of images available, reducing data accuracy.
ETDroneSent obtained a “good” rating when compared to FAO, Embrapa and BHC. Despite the greater interference in albedo, the greater number of images during the cycle provided better correlation when compared to DroneLand.
It is also observed that, in general, the curves generated by the data obtained by both methods follow the same trend, despite this greater underestimation in the reproductive phase.
ET was compared for phases II, III and IV (Table 2). In phase II, ETDrone showed a “very good” correlation with FAO, presenting EQM, EMA and REMA of 0.054, 0.200 and 0.080 mm day-1, respectively. This shows the good efficiency of using this method, before flowering. It presented a value of r = 0.90 and d = 0.90, the confidence index was equal to 0.81. The EQM, EMA and REMA of the ETDroneLand method more than doubled compared to the ETDrone, so the correlation was classified as “good”. The biggest errors in this phase were made by ETDroneSent, due to the influence of the low albedo on flowering, which caused the kc curve to decline.
In comparison with Embrapa data, the splendor was found to range from “average” to “very poor”. According to the Embrapa methodology, the initial value for corn cultivation in direct planting areas starts at 0.75 and rises to 1.23, which differs greatly from other methods, presenting a confidence index of 0.60, 0.31, 0.20 for ETDrone, ETDroneLand, ETDroneSent respectively. The average values of NDE, EMA and REMA were 0.749, 0.817 and 0.265 mm day-1, respectively.
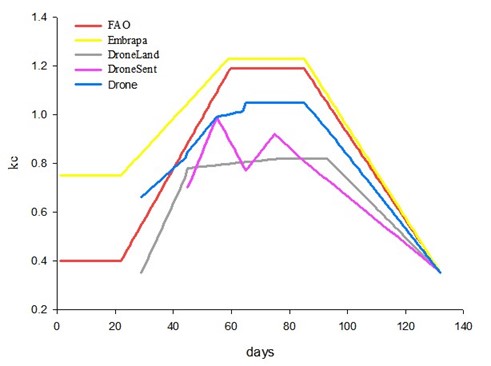
Figure 3. Comparison of the crop coefficient estimated by the FAO 56, Embrapa, DroneLand, DroneSent and Drone methods, throughout the cycle in Itaberaí-GO, 2021.
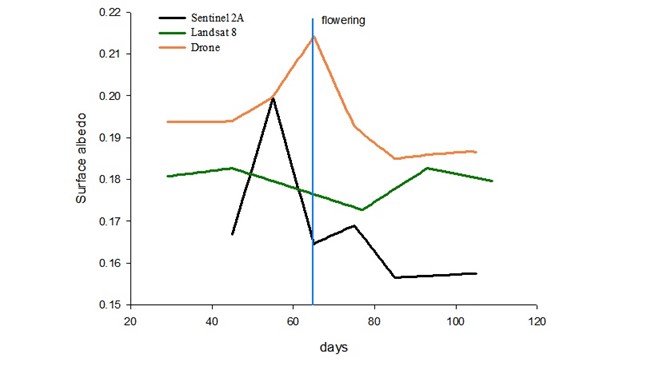
Figure 4. Albedo distribution throughout the corn crop cycle obtained using the SAFER algorithm with drone images and Landsat-8 and Sentinel-2A satellites.
In relation to BHC (water balance climate), the ETDrone method showed better results, the EQM and REMA were below 0.1 mm day-1, obtaining a “very good” rating. The methods with drone images using satellite albedo had worse results, precisely due to the influence of flowering on variable, with ETDroneSent having the worst performance, the correlation level was “terrible”.
When comparing phase II data between drone methods, the correlation varied from “poor” to “terrible”. This is due to the low kc presented by ETDroneLand, in addition to the decreasing curve presented by ETDroneSent. Several authors such as Silva et al. (2009) report that the best spectral response for corn crops is in vegetative growth, as after flowering there is a decrease in correlation coefficients.
In phase III, in which there was this greater influence of flowering on the NDVI values of the drone and albedo of the satellites, the correlation classification with the FAO, Embrapa and BHC methods varied from “poor” to
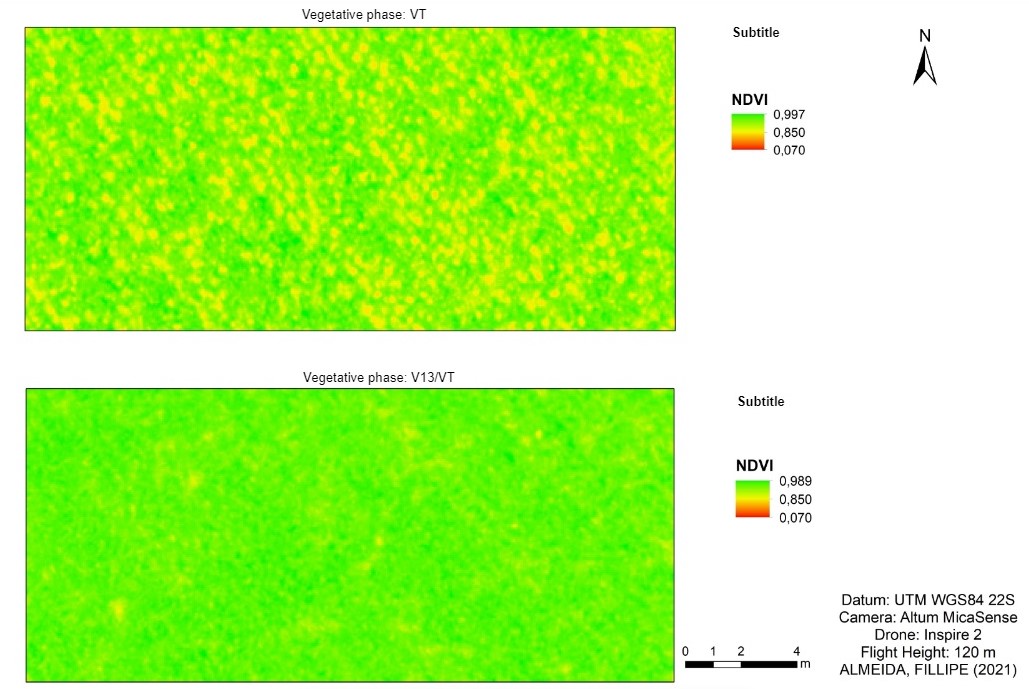
Figure 5. Influence of corn flowering on the distribution of NDVI values in corn crops. *Contamination of pixels in the NDVI image, due to the appearance of the tassel (flowering). *61-65 days after planting (beginning of tasseling/ flowering) in the VT phase (vegetative phase).
“terrible” for ETDroneLand and ETDroneSent. It presented NDE and EMA close to 1 mm day-1. The correlation with the ETDrone method, which had less influence on albedo values, showed better results and was classified as “good”. Among the drone methods, the correlation was “poor”.
In phase IV, ETDrone showed better results when compared to ETFAO and ETEmbrapa, it had an “excellent” correlation and a confidence index ranging from 0.93 to 0.95. At this stage, the plant entered senescence and the tassel (Flowering) no longer had pollen, reducing its influence on the images. ETDroneLand was classified as “very good” and “good”, while ETDroneSent, which presented lower albedo values, was classified as “good” and “average”, respectively. Compared to ETBHC, both methods performed satisfactorily.
Borghi et al. (2016) found a statistical difference in NDVI values at different plant densities for corn crops. This sensitivity of the vegetation index, surface temperature (influenced by the irrigation frequency) and surface albedo (influenced by vegetation morphology) causes a direct influence on the ET values estimated by remote sensing.
Materials and Methods
Experimental area
The study area comprised an area of 25 hectares on a central pivot. It is located in the municipality of Itaberaí-GO, Brazil, coordinates 49º 43’ 23” W and 16º 01’ 41” S. The region's climate is characterized according to Koppen's classification as Aw, with two well-defined seasons, dry winter and rainy summer.
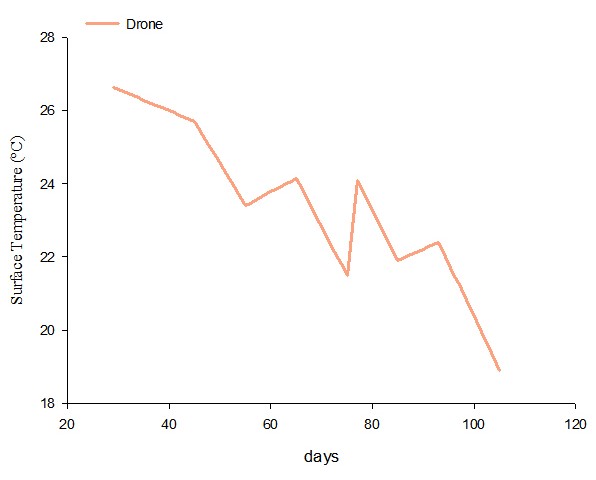
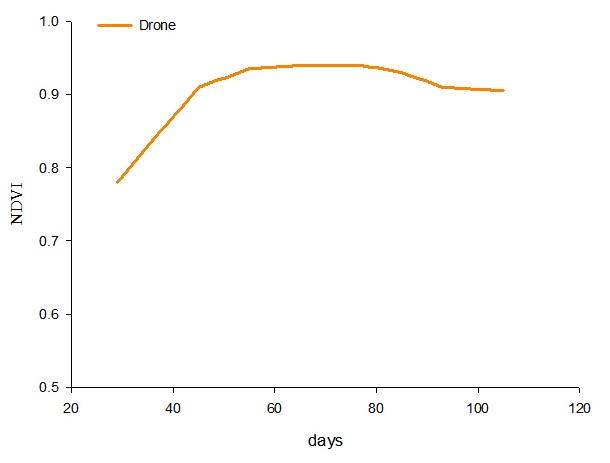
Figure 6. Distribution of surface temperature (A) and NDVI (B) throughout the corn crop cycle obtained using multispectral and thermal camera images.
 |
 |
 |
|---|---|---|
 |
 |
 |
 |
 |
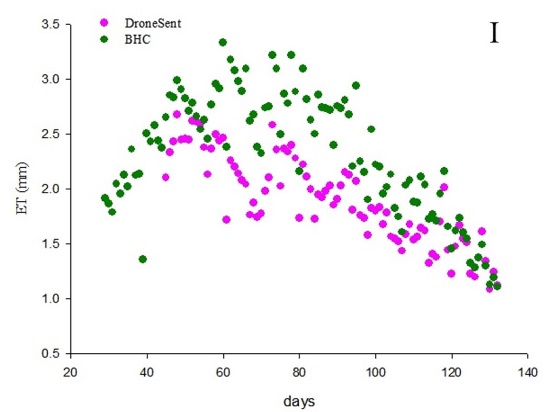 |
Figure 7. Evapotranspiration of the corn crop for the period from March to July 2021 obtained by the Drone (A; B; C;), DroneLand (D; E; F) and DroneSent (G; H; I) method compared with FAO 56, Embrapa and BHC (Climatical Water Balance).
Corn was sown on March 24, 2021 in a conventional planting system, cultivar AG8700, spacing of 0.5 m between rows and 3 plants per linear meter. Top dressing was applied with 0.26 t ha-1 of urea. The soil was classified as Red Oxisol of medium texture (Santos et al., 2018).
Undisturbed soil samples were collected in volumetric rings at eight georeferenced points in layers 0.0-0.1; 0.1-0.2; 0.2-0.3; 0.3-0.5 m. Soil density and texture were obtained according to Embrapa methodology (2017). Data on soil resistance to penetration was also collected using a FALKER digital impact penetrometer. The limits of field capacity and permanent wilting point were defined according to Medrado and Lima (2014). Soil texture was Sandy clay loam (58% Clay, 8% Silt and 34% Sand).
The reference evapotranspiration (ETo) was obtained by the Penman Monteith method (Allen et al., 1998), using data from the automatic weather station installed within a radius of 10 meters from the pivot.
Conduction of study
With the data for preparing the climatological water balance (BHC), the methodology of Thornthwaite and Mather (1955) was used. Considering the data on the pedotransfer function, soil density and effective depth of the root system (Z=0.5 m), the value of 100 mm was used for available water capacity (CAD). And by accounting for water inputs and outputs from the system, ETa was estimated during the corn crop cycle.
To estimate soil moisture variation, three sensor batteries were installed, each battery containing three EC-5 sensors from Decagon Devices, in layers 0.0-0.1, 0.1-0.2, 0.2-0.3 and 0.3-0.5 m connected to an EM-50 datalogger, with a reading interval every 20 minutes. To obtain precipitation and irrigation, two tilting rain gauges with 0.25 mm resolution were installed, connected to a NOVUS infrared datalogger, with readings every 24 hours. The methodology of Sena et al. (2020) was used to calibrate sensor data according to texture.
Field visits were carried out when the Landsat-8 and Sentinel-2A satellites passed, every 16 and 10 days respectively, according to the temporal resolution of each sensor. The dates were: 05/April; 21/April; 07/May; 23/May; 08/Jun; 24/Jun; 10/Jul for Landsat-8 and 07/April; 17/April; 27/April; 07/May; 17/May; 27/May; 06/Jun; 16/Jun; 26/Jun; 06/Jul to Sentinel-2A. The last irrigation was carried out on 04/Jul, so the last visit was carried out on 06/Jul.
On the date of the satellite's passage, readings were taken with the Scholander pump at approximately 5:30 am, using the last fully opened and expanded leaf, with 10 repetitions, to prove whether or not there was a water stress. The first leaf below and opposite the ear was collected for foliar analysis, obtaining macro and micronutrients according to methodology Embrapa (2000).
To estimate ET, albedo data was extracted from images from the Landsat-8 satellite (OLI/TIRS), obtained free of charge on the United States Geological Survey (USGS) website. Images from the Sentinel-2A satellite were also used, obtained from the Copernicus website (European Space Agency). On the same date as the satellites' passage and close to the passage time, a flight was carried out with a drone model DJI Inspire 2, coupled with a multispectral and thermal camera model Micasense Altum.
To obtain evapotranspiration using the SAFER algorithm, it is necessary to follow some steps. These steps follow the methodology proposed by Teixeira (2010).
Conversion of DN values (digital numbers) into radiance
The DN represents a pixel that contains the intensity of electromagnetic energy measured by the satellite sensor. These digital values need to be converted into spectral radiance for each band. Therefore, radiance is the radiant intensity per unit source area.
| \(L\lambda = \left( \frac{LMAX - LMIN}{255} \right)Q_{CAL} + L_{MIN}\) | (2) |
|---|
LMAX: maximum radiance (\(W\ m^{- 2\ }\ {sr}^{- 1}\ {\mu m}^{- 2}\) );
LMIN: minimum radiance \((W\ m^{- 2\ }\ {sr}^{- 1}\ {\mu m}^{- 2})\);
Qcal: pixel intensity (ND), Whole number 0 a 255.
Reflectance calculation
For each thermal band contained in the orbital images, the reflectance (Pλ) is calculated from the radiance values that were obtained in the previous step. Reflectance is the process by which radiation passes through an object such as a cloud or a river.
| \[P\lambda = \frac{\pi*\ L\lambda}{{ESUN}_{\begin{matrix} \lambda\ \ \\ \ \\ \end{matrix}}*cosZ*\ E_{0}}\] | (3) |
|---|
\(L\lambda\): radiance of each band;
SUN\(\ \lambda\): spectral irradiance at the top of the atmosphere;
cosZ: zenith angle;
\(E_{0}\): daily angle;
And: \(E_{0}\) is defined by Equation:
| \[E_{0} = 1.000110\ + \ 0.0342221\ cos(da)\ + \ 0.001280\ (da)\ + \ 0.000719(2*da) + \ 0.000077\ sin(2*da)\] | (4) |
|---|
Da: daily angle
Da is defined by Equation 5:
| \[da = \left( d_{n} - 1 \right)\frac{2\pi}{365}\] | (5) |
|---|
Dn: Julian day of the image
Albedo at the top of the atmosphere
The albedo at the top of the atmosphere can be obtained from the following equation:
| \[\alpha_{top}\ = \ \Sigma\ (\omega p\ \times \ p\lambda)\] | (6) |
|---|
pλ: reflectance
ωλ: coefficient for each band
And, ωλ obtained by the equation:
| \[\omega\lambda\ = \frac{{ESUN}_{\lambda\ }}{{\Sigma\ ESUN}_{\lambda}}\] | (7) |
|---|
Surface Albedo
In SAFER, the surface albedo (α0) was estimated from the albedo at the top of the atmosphere by the following equation:
| \[\alpha_{0}\ = \ a\ *\ \alpha\ top\ + \ b\] | (8) |
|---|
a and b are regression coefficients Teixeira (2010), which present, respectively, values of 0.7 and 0.006, α top, is the albedo at the top of the atmosphere.
Surface temperature
To prepare the surface temperature map (To), it is necessary to use thermal infrared images of the bands, which will be determined later. But the surface temperature is calculated by the equation:
| \[To = 1.11\ x\ T_{bright} - 31.89\] | (9) |
|---|
\(T_{bright}\) is obtained by the equation:
| \[T_{bright} = \frac{1260,56}{\ln\left( \frac{607.76}{L_{termal} + 1} \right)}\] | (10) |
|---|
\(L_{termal}\) = radiance (Lλ) of the bands yet to be chosen.
Normalized difference vegetation index (NDVI)
| \[NDVI = \frac{IVP - V}{IVP + V}\] | (11) |
|---|
IVP is the reflectance in the near-infrared band and V is the reflectance in the red band.
Equation 12 is used to obtain the current evapotranspiration (ETa) (Teixeira, 2010):
\(\frac{ET}{ETO} = exp\lbrack a + b\binom{To}{\infty o\ NDVI}\rbrack\) (12)
a and b are regression coefficients; a = 1 (Teixeira et al., 2013) and b = -0.008.
Using the ETa/ETo relationship, we arrive at the value of the crop coefficient. The respective crop coefficients (kc), by SAFER, were calculated using Equation 16:
\(kc = \ \frac{ETa}{ETo}\) (13)
The surface albedo is a variable within SAFER that images obtained by a drone cannot estimate, as the albedo at the top of the atmosphere is taken into account, which the drone does not capture because it is under the top of the atmosphere. For this variable, in the calculation of ET by the multispectral camera, a methodology according to Planck (1901) was used. Weights were defined for each band and subsequent summation of all bands in reflectance, according to Equation 17:
\(\alpha_{0} = 0.24*Blue + 0.23*Green + 0.2*Red + 0.14*NIR + 0.18*RedEdge\) (14)
Furthermore, the surface albedo estimated by satellites was used. The flight height chosen was 120 meters, a height that provided better battery life and a 6-centimeter pixel. The flight plan was prepared using Pix4D capture software. The camera images were processed in the Pix4d mapper software, where the images were mosaicked, obtaining each band in reflectance, the NDVI (Normalized Difference Vegetation Index) and the surface temperature. Subsequently, the evapotranspiration calculation was carried out using the raster calculator tool of the ArcGis 10.3 software.
Data correlation was performed using the BHC (climatological water balance), FAO and Embrapa method, and between the three albedo sources. The FAO data were calibrated to the air humidity and wind speed conditions of the study area, as described in the bulletin. Pearson correlation (r), linear regression (R²), confidence index (c) and Willmott index “d” were used. This index varies from 0 to 1, the closer it is to 1, the more the estimated values fit the measured values (Willmott et al., 1985).
Conclusions
Biotic stress and nutritional deficiency directly affect ET estimation by remote sensing. Corn crop flowering interferes with the estimated values of NDVI and surface albedo, leading to greater underestimation. However, when drone images are used to calculate the three SAFER variables, this effect is mitigated. ET estimation by remote sensing is not recommended for the reproductive phase of corn crop.
Acknowledgements
Thanks to the Foundation to support research in the state of Goiás (FAPEG), National Research and Development Council (CNPq) by financial support, and the Cerrado Climate and Water Resources Research Group (NUCLIRH) from Federal University of Goiás (UFG) for their collaboration in data collection.
Contribution of authors
José Alves Júnior (Advisor of the doctoral thesis, research planning and discussion of results)
Derblai Casaroli and Antonio H. Teixeira (Co-supervisor of the doctoral thesis, research planning and discussion of results)
Fillipe de Paula Almeida (author of the doctoral thesis, installation, conduction and collection of field data)
Adão Wagner Pêgo Evangelista, Rafael Battisti, Joãoo Maurício Ferdandes Souza and Fabio Miguel Knapp (Researchers collaborators, and discussion of results)
References
Allen RG, Pereira LS, Raes D, Smith M (1998) Crop evapotranspiration: Guidelines for computing crop water requirements. Irrig. Drain., Paper: 56, Rome, 297.
Aldrighi M, Jardim CCS, Alves Jr J, Battisti R, Casaroli D, Evangelista AWP (2020) Necessidades hídricas das gramas batatais (Paspalum notatum Fluggé) e esmeralda (Zoysia Japônica Steud) estimadas por sensoriamento remoto. Braz. J. Dev., Curitiba, 6 (7) 47020-47032.
Andrade RG, Teixeira AHC, Leivas JF, Nogueira SF, SILVA GBS, Victoria DC, Facco A G (2015) Estimativa da evapotranspiração e da biomassa de pastagens utilizando o algoritmo SAFER e imagens MODIS. Anais XVII Simp. Bras. Sens. Rem. (27) 6.
Agência Nacional de Águas e Saneamento Básico (2021). Atlas Irrigação 2021. Disponível em: < https://biblioteca.ana.gov.br/asp/download.asp?codigo=148256&tipo_midia=2&iIndexSrv=1&iUsuario=0&obra=88090&tipo=1&iBanner=0&iIdioma=0> Acesso em: 04 de setembro de 2022.
Bezerra BG, Silva BB, Ferreira NJ (2008) Estimativa da evapotranspiração real diária utilizando-se imagens digitais TM - Landsat 5. Rer. Bras. Meteor., São José dos Campos, 3 (1) 305-317.
Bono L, Bergamaschi H, Rosa LMG, França S, Radin B, Santos AO, Bergonci JI (2001) Alterações no padrão de resposta à luz da condutância estomática do milho causadas pelo déficit hídrico. Revista Brasileira de Agrometeorologia, Santa Maria, 9 (1) 27-34.
Borghi E, Wilda LRM, Resende AV, Pereira Filho IA, Rodrigues RAL (2016) Índice de vegetação, teor de clorofila e eficiência de uso de nitrogênio por híbridos de milho. In: XXXI Congresso Nacional de Milho e Sorgo. Bento Gonçalves. Disponível em: < https://www.alice.cnptia.embrapa.br/alice/bitstream/doc/1054987/1/Indicevegetacao.pdf> Acesso em: 02 de maio de 2022.
Companhia Brasileira de Abastecimento (2022). Acompanhamento da safra brasileira de grãos 2021/2022: 4º levantamento, janeiro de 2022. Disponível em: <https://www.conab.gov.br/info-agro/safras/graos/boletim-da-safra-de-graos> Acesso em: 27 de janeiro de 2022.
Dittmann S, Burnham L, OH SY, Benlarabi A, Choi JH, Ebert M, Figgis B, Gottschalg R, Kim KS, Reindl T, Rüther R (2019) Comparative analysis of albedo measurements (plane-of-array, horizontal, satellite) at multiple sites worldwide. Abstract 36th EU PVSEC, Marseille 2019.
EMBRAPA (2000) - Empresa Brasileira de Pesquisa Agropecuária. Métodos de Análise de Tecidos Vegetais Utilizados na Embrapa Solos. Rio de Janeiro: Centro Nacional de Pesquisa de Solos, 21 ed., 41.
EMBRAPA (2017) Empresa Brasileira de Pesquisa Agropecuária. Manual de métodos de análise de solo. Rio de Janeiro: Centro Nacional de Pesquisa de Solos, 3 ed. ver. e ampl. 212.
Evett SR, Howell TA, Schneider AD, Copeland KS, Dusek DA, Brauer DK, Tolk JA, Marek GW, Marek TM, Gowda PH (2015) The Bushland weighing lysimeters: A quarter century of crop ET investigations to advance sustainable irrigation. American Society of Agricultural and Biological Engineers, Saint Joseph, 58 (5) 163-179.
Fenner W, Dallacort R, Faria Junior CA, Freitas PSL, Queiroz TM, Santi A (2019). Development, calibration and validation of weighing lysimeters for measurement of evapotranspiration of crops. Revista Brasileira de Engenharia Agrícola e Ambiental, Campina Grande, 23 (4) 297-302.
Granata F (2019) Evapotranspiration evaluation models based on machine learning algorithms – A comparative study. Agricultural Water Management, Amsterdam. 217 (1) 303-315.
Landau EC, Magalhaes PC, Guimaraes DP (2005). Relações com o clima: milho. Agência Embrapa de Informação Tecnológica. Disponível em: < https://www.agencia.cnptia.embrapa.br/gestor/milho/arvore/CONTAG01_17_168200511157.html#> Acesso em: 26 de janeiro de 2022.
Liang S (2001) Narrowband to broadband conversions of land surface albedo I: Algorithms. Remote Sensing of Environment, Amsterdam, 76 (2) 213-238.
Lopes JRF, Dantas MP, Ferreira FEP (2019) Identificação da influência da pluviometria no rendimento do milho no semiárido brasileiro. Revista Brasileira de Agricultura Irrigada, Fortaleza, 13 (5) 3610-3618.
Martinez HEP, Carvalho JG, Souza RB (1999) Diagnose foliar. In: Comissão de fertilidade do solo do Estado de Minas Gerais. Recomendações para o uso de corretivos e fertilizantes em Minas Gerais: 5ª aproximação. Viçosa, 143-168.
Medrado E, Lima JEFW (2014) Development of pedotransfer functions for estimating water retention curve for tropical soils of the Brazilian savanna. Geoderma Regional, Amsterdam, 1 (1) 59-66.
Morgan BE, Chipman JW, Bolger DT, Dietrich JT (2020) Spatiotemporal Analysis of Vegetation Cover Change in a Large Ephemeral River: Multi-Sensor Fusion of Unmanned Aerial Vehicle (UAV) and Landsat Imagery. Remote Sensing, Basel, 13 (1) 201-209.
Mussi RF, Alves Jr J, Evangelista AWP, Casaroli D, Battisti R (2020) Evapotranspiração da cana-de-açúcar estimada pelo algoritmo SAFER. Irriga, Botucatu, 25 (2) 263-278.
Nádudvari A, Abramowicz A, Fabianska M, Misz-Kennan M, Ciesielczuk J (2020) Classification of fires in coal waste dumps based on Landsat, Aster thermal bands and thermal camera in Polish and Ukrainian mining regions. Inter. J. Coal Sci. & Tech. 8 (3) 441-456.
Oliveira ER, Silva TC, Ramos RFO (2020) Evapotranspiração de referência de Januária-MG pelos métodos tanque classe “A” e Hargreaves-Samani. Colloquium Agrariae, 16 (1), 48-54.
Padró JC, Muñoz FJ, Ávila LA, Pesquer L, Pons X (2018) Radiometric Correction of Landsat-8 and Sentinel-2A Scenes Using Drone Imagery in Synergy with Field Spectroradiometry. Remote Sensing, Basel, 10 (11) 211-220.
Planck M (1901) Ueber das Gesetz der Energieverteilung im Normalspectrum. Annalen der physic, 19 (1) 202-237.
Pang G, Chen D, Wang X, Lai H (2022) Spatiotemporal variations of land surface albedo and associated influencing factors on the Tibetan Plateau. Science of the Total Environment, 804 (1) 1-16.
Sales DLA, Alves Jr J, Souza JMF, Casaroli D, Evangelista AWP, Pereira RM (2016) Common bean evapotranspiration estimated by orbital images. Afr. J. Agric. Res., Cape Coast. 11 (1) 867-872.
Sales DLA, Alves Jr J, Casaroli D, Evangelista AWP, Souza JMF (2017) Estimativa de evapotranspiração e coeficiente de cultura do tomateiro industrial utilizando o algoritmo SAFER. Irriga, Botucatu, 22 (3) 629-640.
Santos HG, Jacomine PKT, Anjos LHC, Oliveira VA, Lumbreras JF, Coelho MR, Almeida JA, Araujo Filho JC, Oliveira JB, Cunha TJF (2018) Sistema Brasileiro de Classificação de Solos. Embrapa Solos. 355p.
Sah RP, Chakraborty M, Prasad K, Pandit M, Tudu VK, Chakravarty MK, Narayan SC, Rana M, Moharana D (2020) Impact of water deficit stress in maize: Phenology and yield components. Nature Research, Berlin, 10 (1) 1–15.
Sena CC, Alves Jr J, Domingos MVH, Antunes Jr EJ, Battisti R, Evangelista A WP, Casaroli D (2020) Calibração do sensor capacitivo de umidade do solo EC-5 em resposta a granulometria do solo. Braz. J. Dev., Curitiba, ( (4) 17228-17240.
Sena CCR (2021) Uso do sensoriamento remoto para a estimativa da evapotranspiração atual e diagnóstico do manejo da irrigação da cultura do tomate industrial em Goiás. 139 f. Tese (Doutorado em Agronomia: Solo e Água) – Escola de Agronomia, Universidade Federal de Goiás, Goiânia.
Silva MAV, Andrade VMS, Oliveira ECO, Ferreira WPM, Costa JMN (2009) Avaliação da estimativa da biomassa da cultura do milho obtida com base no NDVI. In: Congresso Brasileiro de Agrometeorologia, 2009. Belo Horizonte, MG. Disponível em: <http://sbagro.org.br/anais_congresso_2009/cba2009/402.pdf> Acesso em: 07 de junho de 2022.
Souza JMF, Alves Jr J, Casaroli D, Evangelista AWP, Mesquita M (2020) Validação do modelo SAFER na estimativa da evapotranspiração da cana-de-açúcar. Irriga, Botucatu, 25 (2) 247-262.
Teixeira AHC (2010) Determining regional actual evapotranspiration of irrigated and natural vegetation in the São Francisco river basin (Brazil) using remote sensing an Penman-Monteith equation. Remote Sensing, Bellingham, 5 (2) 1287-1319.
Teixeira AHC, Hernandez FBT, Lopes HL (2012) Application of Landsat images for quantifying the energy balance under conditions of fast land use changes in the semi-arid region of Brazil. In: SPIE Remote Sensing, 2012, Edinburgh. Proc. SPIE 8531, Remote Sensing for Agriculture, Ecosystems, and Hydrology, XIV, (8531) 1-10. Disponível em: <ftp://ftp.feis.unesp.br/agr/pdf/heriberto_safer_landsat.pdf> Acesso em: 04 de julho 2020.
Teixeira AHC, Hernandez FBT, Lopes HL, Sherer-Warren M, Bassoi LH (2013) Modelagem espaço temporal dos componentes dos balanços de energia e de água no Semiárido brasileiro. Campinas: EMBRAPA Monitoramento por Satélite. 32 p. (Documentos, 99).
Teixeira A, Pacheco E, Silva CS, Dompieri M, Leivas J (2021) SAFER applications for water productivity assessments with aerial camera onboard a remotely piloted (RPA). A rainfed corn study in Northeast Brazil. Remote Sensing Applications: Soc. Environ., Amsterdan, 22 (1) 1-15.
Thornthwaite CW, Mather JR (1955) The water balance. Publications in Climatology, New Jersey, Drexel Inst. of Technology. 104.
USDA (2021) Commodity Forecasts. World Agricultural Supply and Demand Estimates. USDA, 2021. Disponivel em: <https://www.usda.gov/oce/commodity/wasde/>. Acesso em: 17 de agosto de 2021.
Willmott CJ, Ackleson SG, Davis RE, Feddema JJ, Klink KM, Legates DR, O’Donnell J, Rowe CM (1985) Statistics for the evaluation and comparison of models. J. Geophys. Res., Ottawa, 90 (1) 8995-9005.