
Aust J Crop Sci. 19(04):458-465 (2025) | ISSN:1835-2707
https://doi.org/10.21475/ajcs.25.19.04.p358
Assessing income distribution and economic viability of smallholder rubber farming in tropical agroecosystems
Shorea Khaswarina*, Eliza
Agribusiness study program, Faculty of Agriculture, Riau University, Indonesia
*Corresponding author: Shorea
Khaswarina 
 ORCID ID:
https://orcid.org/0000-0002-0194-9643
ORCID ID:
https://orcid.org/0000-0002-0194-9643
Abstract: Income distribution is an analysis being used to assess the extent of income sharing within a specific social or economic class of people. Income distribution is usually assessed by identifying various sources of income of sample farmers, namely income from rubber farming, non-rubber farming income and non-agricultural income. This study was conducted on household income of rubber farmers in Kuapan Village, Tambang District, Kampar Regency. 50 rubber farmers were sampled, divided into two groups, namely non-owner tapping farmers (15 farmers) and tapping farmers who were also owners (35 farmers). The sample was identified using proportionate stratified random sampling and snowball sampling. Based on the results of the study, there was no income inequality in either the group of non-owner tapping farmers or the group of tapping farmers who were also owners, with a combined Gini ratio of 0.19, reflecting a relatively equitable income distribution. Economic viability analysis that was assessed using Net Present Value (NPV) and Internal Rate of Return (IRR), demonstrated that rubber farming remains financially feasible, yielding an NPV of IDR 457,197,858 and an IRR of 31.49%. Income equity among the farmers was attributed to: (1) tapping farmers have other income besides rubber farming; (2) non-owner tapping farmers benefit from a profit-sharing system with a ratio of 1:2; (3) tapping farmers who are also owners have to pay maintenance and land clearing costs; and (4) non-owner tapping farmers only incur costs for tools and operational materials. To further reduce income inequality and enhance economic viability among smallholder rubber farmers, the study recommends implementing integrated strategies such as promoting income diversification, enhancing profit-sharing arrangements, capacity building through extension services, stabilizing market prices, investing in infrastructure and appropriate technology, and improving financial support and access to credit.
Keywords: distribution, Gini ratio, income, rubber.
Abbreviations: FW_Female Workers; GDP_Gross Domestic Product; GRDP_Gross Regional Domestic Product; GR_Gini ratio; IRR_Internal Rate of Return; NPV_Net Present Value.
Introduction
Indonesia, as an agrarian nation, possesses immense agricultural potential, which significantly contributes to its national development and economic stability. With the majority of its population relying on agriculture for their livelihood, this sector serves as a vital pillar in Indonesia’s economy. Beyond providing employment opportunities, agriculture plays a central role in ensuring food security and supporting the population's right to adequate food (Effendy, 2018).
Within Indonesia's agricultural sector, the plantation sub-sector emerges as a substantial contributor to both the national and regional economies. In 2019, the plantation sub-sector accounted for 3.73% of the Gross Domestic Product (GDP) and 0.57% of Riau's Gross Regional Domestic Product (GRDP) (BPS, 2019). Among the key crops, rubber plays a pivotal role, particularly in regions like Kampar Regency. However, Indonesia's rubber productivity per hectare remains relatively low compared to other major rubber-producing nations, posing challenges for smallholder farmers dependent on this crop (Cox, 2018).
Smallholder rubber farmers in Indonesia face multifaceted challenges that directly impact their livelihood. Prolonged rainy seasons hinder rubber tapping activities, as wet conditions compromise the quality of the latex, ultimately reducing market prices. According to Tongkaemkaew and Chambon (2018) and Promme et al. (2017), the impact of low rubber prices is widespread, and a decline in rubber prices can trigger a labor migration from rubber production to the industrial or service sector, which in turn, can lead to a shortage of labor in rubber production. Furthermore, small landholdings (typically 1–2 hectares) limit production capacity, often failing to meet household needs. As a result, many farmers must diversify their income sources, venturing into non-rubber agricultural activities or even non-agricultural sectors to sustain their families. Similar studies conducted in Vietnam have revealed that fluctuating global rubber prices and limited access to markets significantly affect smallholder farmers' income stability and long-term viability (Nguyen et al., 2018; Tran et al., 2018; Tran, 2020a). Some studies in Thailand emphasized the necessity of income diversification as a strategic measure to manage the uncertainties faced by smallholder rubber farmers (Huang et al., 2020; Longpichai et al., 2023).
Research from India and Thai has shown that enhancing productivity through improved technology adoption, value addition, and strengthening farmer institutions considerably enhances the economic viability of smallholder rubber farms (Viswanathan, 2014). Moreover, Sri Lankan research highlighted the role of government intervention, specifically in price stabilization and subsidized inputs, in safeguarding smallholders' livelihoods (Wijesuriya et al., 2014). In addition, studies from Cambodia identified that smallholder vulnerability could be mitigated through strategic interventions such as improved market access, infrastructure investments, and targeted financial services (UNDP., 2019).
Income inequality among rubber farmers represents another significant concern. Variability in income structures results from differences in farm ownership, land size, and alternative income opportunities. This research explores income distribution dynamics and economic viability within smallholder rubber farmer households in Kampar Regency. By examining rubber-based and supplementary income sources, this study provides insights into the economic resilience of rubber farming communities and identifies actionable strategies to enhance income equity and sustainability.
Results and Discussion
Rubber farming income
Rubber farming income is the total income derived from rubber farming. Successful rubber farming is determined by the amount of net income received, and so in production activities, it is necessary to take into account the amount of revenue and expenditure. The income received by farmers is obtained by calculating all revenues originating from production after deducting production costs. Revenue is calculated by multiplying the total production by the prevailing market price. High farming revenue will encourage farmers to allocate funds to, for example, production costs for the next period, savings, and other expenses to meet household needs. Analysis of average rubber farming income per hectare is shown in Table 1.
Rubber farming income constitutes a significant proportion (approximately 39.87%) of total household income, reinforcing its critical role in sustaining rural livelihoods. Successful rubber farming depends heavily on efficient management practices to balance production revenue and associated expenditures, as corroborated by recent studies which emphasize the importance of optimizing input costs to maximize profit margins (Carmen-Elena and Ciprian, 2018).
The analysis shows a substantial net income from rubber farming, amounting to IDR 9,974,699 per hectare annually, or IDR 831,225 monthly. This high net income illustrates that rubber farming remains a lucrative enterprise for rural farmers, provided they manage production costs effectively. Similar findings have been documented in recent studies in Southeast Asia, indicating that strategic management practices significantly influence rubber farming profitability (Ali et al., 2021).
The highest depreciation cost recorded was for tapping knives, primarily due to their intensive daily use. This aligns with findings by Salam et al. (2019), indicating that equipment depreciation significantly impacts smallholder farm costs, especially for crops that require frequent maintenance.
Variable costs like pesticides and coagulation agents significantly influence total farming expenses. Farmers in this study preferred specific brands such as Roundup and Gramoxone for herbicides, and vinegar as a coagulation agent, reflecting strategic decisions to enhance product quality and economic returns. Recent research supports the adoption of specific inputs to ensure higher market value and sustainability of rubber farming (Nguyen et al., 2018; Tran et al., 2018).
The study identified a clear correlation between farm size and economic returns, supporting the notion that economies of scale enhance production income. This observation aligns with the findings by Salam et al. (2019), who demonstrated that larger farming areas typically yield higher returns per hectare due to increased efficiency and productivity.
Sample farmer household income structure
The structure of household income is the total income of all family members, which comes from various sources of productive business activities carried out in a certain period. Most of the sample farmer household incomes do not come from one source only but from various sources. The household income structure of the sample farmers derives from the income of all family members, starting from the head of the family, wife, and children who contribute their income to the household. In general, the household income of the sample farmers comes from agriculture (rubber farming and non-rubber farming) and non-agriculture.
According to Hasan et al. (2013), each source of income plays an important role in the structure of the household income. The level of household income is one of the variables determining the ability of farmers to adopt technology, in addition to individual characteristics. The amount of income obtained by farmers will affect farmers’ consideration of applying various alternative technologies.
This research conducted in Kuapan Village focused on the land ownership status of rubber farmers. The ownership status consisted of non-owner tapping farmers and tapping farmers who are also owners (Table 2).
The highest percentage of rubber farmers’ household income came from the rubber farming sector (39.87%). The management of rubber farming depends on rainfall, the purchase price of ojol (transport service),
Table 1. Analysis of average rubber farming income per hectare
| Average IDR/year | Average IDR/month | |||
|---|---|---|---|---|
| Fixed costs (FC) | Equipment depreciation | 185,635 | ||
| LF | 12,746,861 | 1,062,238 | ||
| Sub-total | 12,932,496 | 1,077,708 | ||
| Variable costs (VC) | Pesticide | 80,795 | 6,733 | |
| Clotting agent (vinegar) | 61,021 | 5,085 | ||
| LOF | 2,782,209 | 231,851 | ||
| Sub-total | 2,924,025 | 243,669 | ||
| Total cost (TC) | 15,856,521 | 1,321,377 | ||
| Gross income | 25,831,220 | 2,152,602 | ||
| Net income | 9,974,699 | 831,225 | ||
Table 2. Rubber smallholder household income.
| No. | Income structure | Amount (IDR/month) | Percentage (%) | Average income (IDR/month) 1,268,572 |
||
|---|---|---|---|---|---|---|
| 1 | Rubber farming | 1. Rubber | 63,482,610 | 39.87 | ||
| 2 | Non-rubber farming | 33,950,000 | 21.32 | 679,000 | ||
| 1. Palm oil | 27,600,000 | 17.34 | 552,000 | |||
| 2. Paddy rice | 1,750,000 | 1.10 | 35,000 | |||
| 3. Cattle | 4,600,000 | 2.89 | 92,000 | |||
| 3 | Non-farming | 61,780,000 | 38.80 | 1,235,600 | ||
| 1. Civil servant | 8,450,000 | 5.31 | 169,000 | |||
| 2. Honorary employee | 2,380,000 | 1.49 | 47,600 | |||
| 3. Employee | 9,000,000 | 5.65 | 180,000 | |||
| 4. FW | 3,000,000 | 1.88 | 60,000 | |||
| 5. Grocery shop | 8,400,000 | 5.28 | 168,000 | |||
| 6. Stall | 5,600,000 | 3.52 | 112,000 | |||
| 7. Merchant | 10,850,000 | 6.81 | 217,000 | |||
| 8. Labor | 4,000,000 | 2.51 | 80,000 | |||
| 9. Tractor service | 4,400,000 | 2.76 | 88,000 | |||
| 10. Tailor | 800,000 | 0.50 | 16,000 | |||
| 11. Posts from family | 4,900,000 | 3.08 | 98,000 | |||
| Total income | 159,212,610 | 100.00 | 6,445,839 | |||
and the pattern of cultivation (quality of ojol), which causes the income of each farmer to be different. This means that the job of being a farmer is a permanent job, and if there is additional work outside the arable land or outside the agricultural sector, the job is considered temporary to earn additional income.
Additional household income for non-rubber agricultural sector farmers in Kuapan Village comes from palm oil, lowland rice and cattle farming. Based on the research, all family members can play a role in farming activities outside the main income as rubber farmers. Another significant source of household income is activities outside the agricultural sector. These activities include work as civil servants, temporary employees, employees, female workers (FW), on grocery stalls, food stalls, as traders, laborers, in tractor rental services, as tailors, and in deliveries. The activity mostly occupied by rubber farmers and their families is market trading in basic needs such as vegetables, fruits, and clothes.
Table 2 describes the household income structure of rubber farmers from rubber farming, non-rubber farming, and non-agriculture, with a total income of IDR 159,212,610 per month and an average income of IDR 6,445,839 per month. Income from rubber farming contributed 39.87 percent, compared to 38.80 percent from non-agriculture and 21.32 percent from non-rubber farming. Therefore, it can be concluded that rubber farming contributes more income than other sources of agricultural income.
In addition to rubber farming, rubber farming households in Kuapan Village have other sources of income from palm oil, lowland rice and cattle farming. Non-rubber agricultural income is only generated by a few farmers. Rubber farmers try to find innovations and alternative activities to get other income but still make rubber farming their main job. Welfare will increase according to income received (Hammond et al., 2017). Based on the research, one reason that farmers have other income outside of rubber farming is that the income from rubber farming alone is not sufficient for their household needs.
Table 3. Gini ratio of household income of non- owner tapping farmers and tapping farmers who are also owners.
| No. | Total income/month | Income proportion | Income in class | Cumulative income | Yi-Yi-1 | fi | fi(Yi-Yi-1) | |
|---|---|---|---|---|---|---|---|---|
| 1 | Lowest 40% | 32,898,556 | 23.55 | 23.55 | 23.55 | 0.4 | 0.09 | |
| 2 | Middle 40% | 54,104,144 | 38.72 | 62.27 | 85.81 | 0.4 | 0.34 | |
| 3 | Highest 20% | 52,722,469 | 37.73 | 100.00 | 185.81 | 0.2 | 0.37 | |
| Amount | 0.80 | |||||||
| Gini index ratio | 0.19 | |||||||
Low-income farmers tend to rely on off-farm work to stabilize household incomes, because agricultural commodity prices vary more than off-farm wages. However, off-farm work has two effects on production. The negative impact is the loss of agricultural labor due to non-agricultural activities, while the positive impact is the variety of income sources which can later be reinvested for farming activities. This is emphasized by Salam (2019), who stated that an increase in non-agricultural activities by farming households is caused by a reduction in agricultural income and the need to protect themselves from the risk of production failure.
Palm oil is the second commodity managed by rubber farmers. The average land area managed by farmers with ownership status is one hectare. The palm oil land that was worked on was usually originally rubber land that was no longer productive. Farmers usually shift to other crops or plant functions to meet household needs that cannot be fulfilled through rubber farming alone.
Another non-rubber farming income that is cultivated by the sample rubber farmers is lowland rice. Based on the research conducted, the average area of paddy fields owned by rubber farmers is small (<1 hectare). The last source of non-rubber farming income is from the livestock sector. The type of livestock developed by rubber farmers is cattle.
Sources of non-agricultural income for rubber farmers in Kuapan Village are the civil service, temporary employment, employment, female workers (FW), grocery stores, stalls, trading, laboring, tractor servicing, house rental, and deliveries. The highest average non-agricultural income of IDR 217,000 per month is obtained from trading, while the smallest average income, IDR 16,000, is obtained from house rental.
The community’s higher economic growth will affect the increase in output or household expenditure for a certain period. This shows that there is a need for an increase in efficient human resources and income from various sectors. Based on the research, various non-agricultural incomes are influenced by the financial conditions and assets owned by each rubber farmer.
Based on the research conducted, rubber farmers still see rubber farming as their main livelihood, because income from the non-agricultural sector is obtained through family members. In other words, all family members play a role in meeting household needs. In Kuapan Village, both non-owner tapping farmers and tapping farmers who are owners have other incomes outside the agricultural sector that can support the fulfillment of household needs.
Non-agricultural household incomes such as civil service, temporary employment, employment, FW, grocery stalls, food stalls, trading, laboring, tractor servicing, tailoring, and house rental are within the scope of the research area. In other words, the location of the non-agricultural sector assets is adjacent to the rubber farmers. Meanwhile, non-agricultural income is a sum of money sent by family members who are far from the residence of the rubber farmer.
Income diversification emerged as an essential strategy among rubber farmers to mitigate the risks associated with rubber market volatility. Income from non-rubber agriculture and non-agricultural sources significantly supports household resilience, particularly during periods of economic uncertainty. These findings are consistent with research from Thai and Vietnam, highlighting the effectiveness of diversification in enhancing economic stability and reducing vulnerability (Longpichai et al., 2023; Tran, 2020b).
To ensure long-term sustainability and profitability, integrated strategies such as capacity building through extension services, market stabilization policies, infrastructure improvement, and access to financial services are recommended. Evidence from Sri Lanka and India underscores that government interventions, including price stabilization measures and subsidies, significantly enhance economic sustainability and resilience in rubber farming communities (Wijesuriya et al., 2014; Karthiayani, 2014).
Gini ratio
The Gini index is obtained by calculating the area between the diagonal line (perfect equality) and the Lorenz curve compared to the total area of the half square where the Lorenz curve is located. The value of the Gini coefficient (Gini ratio) ranges from zero (perfect equality) to one (perfect inequality). The distribution of income is found by sorting the total amount of household income per month, starting from the lowest total income to the highest (Table 3).
Table 3 shows the combined Gini ratio of the household income of non-owner tapping farmers and tapping farmers who are also owners (0.19). This means that income inequality is low, or there is an even distribution of income in the two sample groups (Eliza et al., 2014). This equitable distribution of income can be attributed primarily to the presence of diversified income sources among farmers and the application of an effective profit-sharing system. These results align with recent studies by Longpichai et al. (2023), highlighting that income diversification significantly contributes to reducing economic disparities in rural communities dependent on plantation crops.
A comparison of the Gini ratio of household income of non-owner tapping farmers and tapping farmers who are also owners is listed in Table 4.
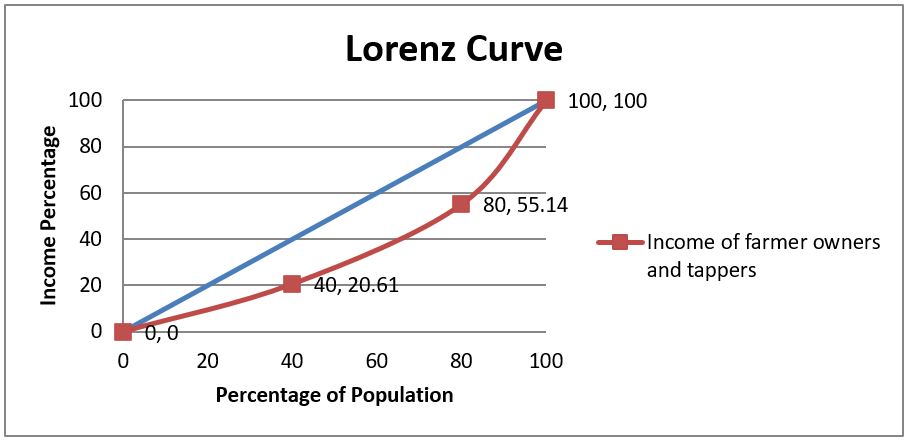
Figure 1. Lorenz curve of household income of non-owner tapping farmers and farmers who are also owners.
Table 4. Comparison of the Gini ratio of household income of non-owner tapping farmers and tapping farmers who are also owners.
| Gini ratio of non-owner tapping farmers | ||||||||
|---|---|---|---|---|---|---|---|---|
| No. | Total income/month | Income proportion | Earnings in class (%) | Pro. cumulative income (%) | Yi-Yi-1 | fi | fi(Yi-Yi-1) | |
| 1 | Lowest 40% | 10,096,585 | 22.32 | 22.32 | 22.32 | 0.4 | 0.09 | |
| 2 | Middle 40% | 15,414,897 | 34.07 | 56.39 | 78.70 | 0.4 | 0.31 | |
| 3 | Highest 20% | 19,732,100 | 43.61 | 100 | 178.70 | 0.2 | 0.36 | |
| Amount | 0.76 | |||||||
| Gini index ratio | 0.24 | |||||||
| Gini ratio of tapping farmers who are owners | ||||||||
| No. | Total income/month | Income proportion | Earnings in class (%) | Pro. cumulative income (%) | Yi-Yi-1 | fi | fi(Yi-Yi-1) | |
| 1 | Lowest 40% | 22,820,302 | 20.03 | 20.03 | 20.03 | 0.4 | 0.08 | |
| 2 | Middle 40% | 40,159,772 | 35.25 | 55.29 | 75.32 | 0.4 | 0.30 | |
| 3 | Highest 20% | 50,934,955 | 44.71 | 100.00 | 175.32 | 0.2 | 0.35 | |
| Amount | 0.73 | |||||||
| Gini index ratio | 0.27 | |||||||
Table 5. Value of NPV and IRR of smallholder rubber.
| NPV (IDR) | IRR (%) | |
|---|---|---|
| Value | 457,197,858.00 | 31.49 |
Table 4 shows that the Gini ratios of household income of non-owner tapping farmers and tapping farmers who are also owners in Kuapan Village are at a low level of inequality (0.24, 0.27). Equitable inequality between the household income ratios of non-owner tapping farmers and tapping farmers who are owners can occur because (1) non-owner tapping farmers have other sources of income besides rubber farming which are large enough to meet household needs; (2) non-owner tapping farmers benefit from a profit-sharing system, in which the net profits of the farm are divided by one-third for the owner and two-thirds for the tapper; and (3) tapping farmers who are also owners have to pay maintenance and land clearing costs.
The detailed comparison presented in Tables 3 and 4 illustrates the specific distributional dynamics within different farmer groups. For non-owner tapping farmers, the Gini ratio stood at 0.24, slightly higher than the 0.27 ratio for tapping farmers who own their lands. This minor discrepancy might be explained by the additional financial responsibilities borne by owner farmers, including maintenance and land-clearing costs. A similar outcome was observed by UNDP (2019) in Cambodian smallholder settings, indicating that land-owning farmers often encounter higher costs, potentially offsetting their income advantages.
Furthermore, the profit-sharing arrangements observed in this study significantly enhanced economic equity, particularly benefiting non-owner tapping farmers. This finding is consistent with research by Nguyen et al. (2018), who demonstrated that equitable profit-sharing systems could markedly improve economic equality in agricultural sectors exposed to price fluctuations, such as rubber farming.
Lorenz curve
The Lorenz curve depicts the cumulative distribution of population income in each layer of the population. The Lorenz curve compares the proportion of total household income in the cumulative sample and the proportion of the cumulative number of households, thereby showing the distance between the income distribution and the poverty line. This curve is located in a square where the level side represents the cumulative percentage of national income, and the inner side represents the cumulative percentage of the population. Lorenz curve which is closer to the diagonal (straighter) implies a more even distribution of national income. On the other hand, if the Lorenz curve is further away from the diagonal
(more curved), which reflects a worsening situation, and the distribution of national income is increasingly unequal and uneven (Fellman, 2012; Huang, 2017).
Figure 1 explains that rubber farmers in the lowest 40 percent received 20.61 percent of the total income. The middle 40 percent received 55.14 percent of the total income, and the highest 20 percent received 24.25 percent of the total income. The Lorenz curve for rubber farmers’ household income was close to the 45 degree line/diagonal line. This shows that the income distribution of rubber farmers' households indicates low inequality or equality.
The level of inequality in the distribution of household income, which is classified as low, indicates that the accumulation of income among certain groups of people is also relatively low. Based on the research, the equality between the household income of non-owner tapping farmers and tapping farmers who are also owners is influenced by the profit-sharing system and the non-agricultural sector, because income from outside agriculture varies among farming households.
The low level of inequality in the distribution of farmers’ household incomes can occur because farmers that have knowledge about farming and the availability of selling price information. Promme et al. (2017) stated that knowledge and information on farming, the size of the land area that has not been utilized, or the area of immature land positively affect the sale of fresh latex.
Based on data from the General Secretariat of Agriculture in 2020 to achieve the level of household welfare, rubber farmers allocate more income for basic food consumption needs, being 45.73 percent for grains and processed food and beverages compared to 11.75 percent for non-food needs such as cigarettes. This is in accordance with what was conveyed by Allo et al. (2018) and Kuswanto (2019), indicating that farmers’ household welfare is achieved by allocating more income for food consumption needs compared to non-food consumption needs and fuel.
Benefits of rubber plantations
The methods used to assess the benefits of rubber plantations are net present value (NPV) and internal rate of return (IRR). The NPV and IRR are shown in Table 5.
The economic viability analysis of smallholder rubber plantations, as illustrated in Table 5, demonstrates a net present value (NPV) of IDR 457,197,858 and an Internal Rate of Return (IRR) of 31.49%. These results underscore the financial feasibility and attractiveness of investing in rubber plantations, significantly exceeding the typical smallholder loan interest rate of 7%. Such a positive economic indicators affirm the long-term profitability of rubber farming when managed effectively.
Recent studies corroborate these findings, indicating robust profitability and sustainability in rubber plantation investments across similar contexts. Tran (2020b) emphasized that improved technological practices substantially enhance rubber plantation profitability in Vietnam, resulting in positive NPV and IRR outcomes similar to those observed in this study. Likewise, Ali et al. (2021) demonstrated that adopting advanced rubber farming technologies significantly increases economic returns, reinforcing the economic attractiveness of such investments.
The positive NPV and IRR values in this study further indicate that rubber plantations are economically resilient, provided the discount rate remains moderate. However, sensitivity to the discount rate indicates potential vulnerability under increasing financing costs. This sensitivity aligns with findings by Tran (2020b), who highlighted that changes in interest rates and market volatility significantly affect smallholder rubber profitability, necessitating policy interventions such as subsidies or stabilizing mechanisms to safeguard profitability.
Moreover, it is essential to note the critical impact of rejuvenation practices and intensive cultivation of young plants are necessary to sustain economic efficiency in rubber farming. Studies by Giroh and Nachandiya (2022) support these recommendations, emphasizing rejuvenation and modernization as critical strategies to maintain or enhance economic returns and productivity in aging plantations.
These insights suggest that continued profitability and sustainability of rubber farming require ongoing investments in plantation management, rejuvenation practices, and technological improvements. Thus, policymakers and agricultural stakeholders should prioritize these areas through targeted financial incentives, training, and extension services.
Materials and methods
Place and time of study
This research was conducted in Kuapan Village, Kampar Regency, Indonesia. Selection of the location was based on the consideration that the majority of the population are subsistence farmers on rubber plantations. The research was conducted from October to December 2022.
Data and sampling methods
The research method was a survey method, in which we collected data using a questionnaire as a data collection tool. The object of this research is rubber farmers’ households in Kuapan Village, Kampar District, Kampar Regency. The population of rubber farmers in Kuapan village is 319, consisting of two groups, namely non-owner tapping farmers and tapping farmers who are also owners. From this population, 15 percent is selected, so that the sample size is 15% x 319 people = 48 people, rounded up to 50 sample farmers. The 50 sample farmers were divided into two classes: non-owner tapping farmers (15 sample farmers) and tapping farmers who are also owners (35 sample farmers). A proportionate stratified random sampling technique is used. The reason for using this technique is that all groups of farmers, based on land ownership, can be represented, so samples are taken from each group in the same proportions. The sampling procedure for this study was the snowball technique.
Data analysis
Income structure
An income structure analysis was conducted. Household income is income from all household members that contributes to meet the needs of families or individual household members (Allo et al., 2018). Sources of farmers’ household income can be classified into income from the agricultural sector and from the non-agricultural sector. Based on research conducted on rubber farmers in Kuapan Village, there are three sources of revenue, being farming income from rubber, farming income not from rubber (palm oil, rice fields, cattle), and non-farming income (e.g., civil service, employees, traders, laborers, house rental, delivery).
To calculate the net income of farmers, the following formula is used:
π = TR - TC (1)
π = Y.Py - (TVC + TFC) (2)
π = Y.Py - (X1 . Px1 + X2 . Px2+… + Xn.PXn + D) (3)
where:
π = Income (IDR/month)
TR = Gross income (IDR/month)
TC = Total cost (IDR/month)
TVC = Total variable cost (IDR/month)
TFC = Total fixed cost (IDR/month)
Y = Total production (kg/month)
Py = Production price (IDR/kg)
D = Depreciation of agricultural equipment (IDR/month)
Xi = Factor of production, i = 1, 2, 3, 4 .., n
Pxi = Price of production factors (IDR)
The depreciation in value of the equipment used is calculated using the straight-line depreciation method:
\(NP = \frac{NB - NS}{UE}\) (4)
where:
NP = Equipment depreciation value (IDR/month)
NB = Purchase value of equipment (IDR/unit)
NS = Residual value 20% of the purchase price (IDR/unit)
EU = Economic age (years)
The calculation above is used to analyze the income of rubber farmers. To obtain income from rubber and palm oil farming in one month, a one-year income approach is used. To obtain other farming income and non-farming income, no detailed income analysis was carried out, but farmers were directly asked their net income obtained per month or per production process or per year (IDR).
After data from all sources of income are obtained, the next step is to calculate the income structure using descriptive quantitative analysis based on agricultural and non-agricultural income. The percentage of each type of income in relation to the total household income is obtained. The income structure is formulated as follows:
Y = A + B + C (5)
where:
Y = Household income (IDR/month)
A = Income from rubber (IDR/month)
B = Income from other agriculture (IDR/month)
C = Income from non-agriculture (IDR/month)
Gini ratio
Analyzing the distribution of income, the Gini ratio coefficient is used to ascertain the inequality of household income:
\(GR = 1 - \sum_{i = 1}^{n}\left( X_{i - 1} - X_{i})(Y_{i} - Y_{i - 1} \right)\) (6)
\(GR = 1 - \sum_{i = 1}^{n}{f_{i\ }(Y_{i} - Y_{i - 1})}\) (7)
where:
GR = Gini ratio
X i = Proportion of cumulative number of households in class i
Fi = Proportion of households in class i
Y I = Proportion of total cumulative household income for class i
Class i is divided into three classes (k=3):
Class 1 = 40% lowest
Class 2 = 40% moderate
Class 3 = 20% highest
The Gini ratio criteria for inequality in income distribution, according to Eliza et al. (2014) are as follows:
1. Gini score <0.3 is low or mild inequality
2. Gini score 0.3–0.4 is moderate inequality
3. Gini score >0.4 is severe inequality
To illustrate the distribution of income, the Lorenz curve is used. The Lorenz curve is a method commonly used to analyze individual income statistics. Equity is analyzed by measuring the inequality that occurs in the distribution of income itself, where the Lorenz curve shows the quantitative relationship between the percentage of the population and the percentage of income they receive for one year.
Conclusion
The household income structure of rubber farmers in Kuapan Village consists of income from rubber farming, non-rubber farming and non-agricultural work. Income from rubber farming contributed more than other sources of income at 39.87 percent; non-agricultural work contributed 38.80 percent and non-rubber farming 21.32 percent. The distribution of household income of non-owner tapping farmers and tapping farmers who are also owners in Kuapan Village shows a low level of inequality with a Gini ratio of 0.19. That rubber farming remains financially feasible, yielding an NPV of IDR 457,197,858 and an IRR of 31.49%. This may be because (1) tapping farmers have income other than rubber farming; (2) non-owner tapping farmers benefit from a profit-sharing system with a ratio of 1:2; (3) tapping farmers who are also owners have to pay maintenance and land clearing costs; and (4) non-owner tapping farmers only incur the cost of tools and operational materials.
References
Ali MF, Akber MdA, Smith C, Aziz AA (2021) The dynamics of rubber production in Malaysia: Potential impacts, challenges and proposed interventions. Forest Policy and Economics, 127: 102449.
Allo, A.G., Satriawan, E., Arsyad, L. (2018). The impact of rising food prices on farmers’ welfare in Indonesia. Journal of Indonesian Economy and Business, 33(3): 193–215.
BPS. 2019. Provinsi Riau Dalam Angka 2019. Badan Pusat Statistik (BPS) Provinsi Riau, Pekanbaru.
Carmen-Elena S, Ciprian C (2018) Comparative analysis for estimating production costs. MATEC Web of Conferences, 184: 04004. https://doi.org/10.1051/matecconf/201818404004
Cox R (2018) Indonesia-investments. www.indonesiainvestments.com/id
Effendy (2018) Changes of technical efficiency and total factor productivity of cocoa farming in Indonesia. Bulgarian Journal of Agricultural Science, 24(4): 566–573
Eliza, Khaswarina S, Nasution M (2014) Distribusi pendapatan petani karet di Desa Sei Tonang Kecamatan Kampar Utara Kabupaten Kampar. Jurnal Photon. 4(2): 23-32.
Fellman J (2012) Estimation of Gini coefficients using Lorenz curves. Journal of Statistical and Econometric Methods, 1(2): 31-38.
Giroh DY, Nachandiya N (2022) Technical efficiency and profitability of small holder natural rubber production in southern Nigeria. Journal of Plantation Crops, 50(1): 8-19. doi:10.25081/jpc.2022.v50.i1.7546
Hammond J, van Wijk MT, Smajgl A, Ward J, Pagella T, Xu J, Su Y, Yi Z, Harrison RD (2017) Farm types and farmer motivations to adapt: Implications for design of sustainable agricultural interventions in the rubber plantations of South West China. Agricultural Systems, 154:1–12. http://dx.doi.org/10.1016/j.agsy.2017.02.009
Hasan A, Tarumun S, Dewi N (2013) Struktur dan Distribusi Pendapatan Rumah Tangga Petani Karet di Desa Sukamaju Kecamatan Batang Peranap Kabupaten Indragiri Hulu. http://ditjenbun.deptan.go.id/images/stories/testing/karet.pdf
Huang D-W (2017) Lorenz curves in a new science-funding model. IOP Conf. Series: Journal of Physics: Conf. Series 936: 012013.
Huang IY, James K, Thamthanakoon N, Pinitjitsamut P, Rattanamanee N, Pinitjitsamut M, Yamklin S, Lowenberg-DeBoer J (2020) Rubber-based farming diversification: Current practices and their impact on economic sustainability of small-scale rubber farmers. A systematic review. https://cdn.harper-adams.ac.uk/document/project/200130-Deliverable-1a102810.pdf
Karthiayani VP (2014) Emerging Smallholder Rubber Farming Systems in India and Thailand: A Comparative Economic Analysis. Asian Journal of Agriculture and Development, 5(2): 1-20.
Kuswanto (2019) Analysis of rubber welfare in Jambi Province, Indonesia. Russian Journal of Agricultural and Socio-Economic Sciences, 2(86). 10.18551/rjoas.2019-02.12
Longpichai O, Ahmed F, Kongmanee C (2023) Income diversification strategies of rubber farmers in Southern Thailand: an empirical study. AJCS, 17(6):481-487. doi: 10.21475/ajcs.23.17.06.p3800
Nguyen QV, To XP, Tran LH, Cao TC, Huynh VH (2018) Rubber wood supply chain: Current situation and some aspects of policy. Forest Trends and VIFORES.
Promme P, Kuwornu JKM, Jourdain D, Shivakoti GP, Soni P (2017) Factors influencing rubber marketing by smallholder farmers in Thailand. Development in Practice, 27(6): 865-879. https://doi.org/10.1080/09614524.2017.1340930
Salam S, Bauer S, Palash MdS (2019) Impact of income diversification on rural livelihood in some selected areas of Bangladesh. J Bangladesh Agril Univ 17(1): 73–79.
Viswanathan PK (2014) Emerging Smallholder Rubber Farming Systems in India and Thailand: A Comparative Economic Analysis. Asian Journal of Agriculture and Development, 5(2): 1-20.
Tongkaemkaew U, Chambon B (2018) Rubber plantation labor and labor movements as rubber prices decrease in Southern Thailand. Forest and Society, 2(1): 18–27.
Tran TL (2020b) Economic efficiency of rubber production and affecting factors: Case of smallholder rubber production in Quang Binh Province, Vietnam. African Journal of Agricultural Research, 16(11): 1622-1630.
Tran TL (2020a) Risk assessment of the economic efficiency of rubber production: Case of smallholder rubber production in Quang Binh Province, Vietnam. African Journal of Agricultural Research, 16(5): 567-573.
Tran TTH, To XP, Nguyen TQ, Forest P, Cao TC (2018) Vietnam Rubber Industry Current status and sustainable development solutions. Forest Trends and VIFORES.
UNDP (2019) Reducing the vulnerability of Cambodian rural livelihoods through enhanced sub-national climate change planning and execution of priority actions. Royal Government of Cambodia United Nations Development Programme (UNDP) PROJECT DOCUMENT. https://www.adaptation-undp.org/sites/default/files/resources/5419_cambodia_ldcf_-_prodoc_resubmission_13mar2015.pdf
Wijesuriya W, Disssanayake DMAP, Herath HMLK, Gunaratne PKKS (2014) Constraints in sustainable smallholder rubber farming in the Moneragala district. Journal of the Rubber Research Institute of Sri Lanka, 91: 61-73.