
Aust J Crop Sci. 19(04):351-360 (2025) | ISSN:1835-2707
https://doi.org/10.21475/ajcs.25.19.04.p251
Genomic prediction of yield components in soybean under Asian soybean rust pressure for early-generation selection
Claudio Guilherme Portela de Carvalho*1, Cosme Damião Cruz2, Carlos Alberto Arrabal Arias1, Aaron Joel Lorenz3
1Embrapa Soja, Londrina, PR, Brazil
2Laboratório de Bioinformática, Universidade Federal de Viçosa, Viçosa, Minas Gerais, Brazil
3Department of Agronomy and Plant Genetics, University of Minnesota, Saint Paul, MN, USA
*Corresponding author: Claudio Guilherme Portela
de Carvalho 
 ORCID: https://orcid.org/0000-0003-0394-3752
Abstract: Predicting the yield components of advanced lines based on the genotyping of plants in the initial generations can help to reduce the segregating lines that are carried forward in soybean breeding programs, especially for developing cultivars with high yields under Asian soybean rust (ASR) pressure. This study aimed to predict the average soybean yield components in the F2:3 and F2:5 families, as well as the top 50% lines of each F2:5 family [F2:5(50%] under ASR pressure based on genotyping of the F2 generation from a cross of two elite breeding lines. These lines have indeterminate growth habit and belong to maturity group 6. Phenotypes included seed yield per plant, 50-seed weight, days to maturity, and plant height. The genomic prediction models were G-BLUP, principal component regression, Bagging, and Bayes-C\(\pi\). Bagging and Bayes-C\(\pi\) most often showed the highest predictive ability. Phenotyping of F2:3 as opposed to F2 only increased the predictive abilities of models for 50-seed weight. Phenotyping of F2:5 and F2:5 (50%) resulted in predictive abilities greater than 0.50 for all the traits. Therefore, F2 genotyping and genomic selection enabled prediction of soybean yield components in populations that are genetically similar to the target population and allowed optimizing the mechanical and financial resources of breeding programs to develop soybean cultivars with higher yields under ASR pressure.
Keywords: days to maturity; Glycine max L.; plant height; predictive ability; seed weight; seed yield
Abbreviations: ASR_Asian soybean rust; ASRS_ASR severity; CR_call rate, DM_days to maturity; GEBV_genomic estimated breeding value; PH_plant height; MAF_minor allele frequency; RB lesion_ reddish-brown lesion; SY_seed yield per plant or line; TAN lesion_tan lesion; 50SW_50-seed weight.
Introduction
Asian soybean rust (ASR), caused by Phakopsora pachyrhizi, is one of the most important diseases of soybean (Glycine max L. Merrill) and occurs in several producing regions of the world, where damage can reach up to 90% (Hartman et al., 2015; Godoy et al., 2016; Zambolim et al., 2022). The limited number of fungicides available to control susceptible populations and the presence of a large number of races (pathotypes) that make the control difficult by vertical genetic resistance, increase the importance of developing productive cultivars under disease pressure, even if they show susceptibility symptoms (Godoy et al., 2016; Zambolim et al., 2022).
The selection of new productive cultivars in breeding programs has its basis mainly on the phenotype, and it deals with limitations such as low accuracy in the initial stages of advancement and the high number of genotypes evaluated in more advanced stages. This process is very laborious (Michel et al., 2018). Therefore, developing strategies to provide selection gain increases and mechanical and financial resources optimization of breeding programs is essential to increase competitiveness and help long-term viability.
Several studies on various crops have shown that genomic prediction and selection hold the potential to increase efficiency, allowing not only the optimization of existing resources but also the reduction of the preceding requirements (Duangjit et al., 2016; Matei et al., 2018; Gebremedhin et al., 2024). The adoption of this methodology has been facilitated by a reduction in the cost of genotyping, the development and adoption of statistical models capable of fitting genome-wide marker data, and the increased data processing capacity (Wartha and Lorenz, 2021; Wu, 2011).
The implementation of genomic prediction and selection requires phenotyping and genotyping of plants to create training and validation populations, which are suited to train and validate a genomic prediction model that applies to a target population, which can simply be genotyped without the need for phenotyping (Meuwissen et al., 2001; Duhnen et al., 2017). Penalized regression, dimensionality reduction, machine learning, and Bayesian analysis are some approaches underlying these models (Sousa et al., 2019; Costa et al., 2022; Miller et al., 2023).
New strategies to increase selection gains and reduce costs need constant development or improvement, even with the advances already achieved through genotyping. Selection in the F2 generation for seed yield is uncommon in breeding programs due to the heritabilities of single-plant phenotypes, and consequently, the low predictive ability of the models generated (Costa et al., 2022). Strategies to increase the predictive ability and generate information about advanced generations from genotyped F2 plants could allow increased selection accuracy and reduce the number of segregating lines conducted in breeding programs. Additionally, measuring seed yield under ASR pressure can be laborious and requires satisfactory climatic conditions for pathogen development (Godoy et al., 2006; Bock et al., 2022). Obtaining these environmental conditions across large experimental areas is challenging and depends on the number of lines under testing. Thus, one alternative is to obtain and validate genomic prediction models in a small population, which can be used for early-generation selection in a larger target population from the same cross or populations that shares a similar genetic background with the target population. Modeling can be done using phenotypic data from advanced generations and genotypic data from the F2 generation. Reducing the number of genotypes in the target population after using predictive models allows better establishment of satisfactory climatic conditions for pathogen development, optimizes the mechanical and financial resources of a breeding program, improves the likelihood of selecting high-yielding soybean genotypes under ASR pressure in more advanced stages, and enhances selection gains.
From this perspective, the current study aimed to predict the average soybean yield components in the F2:3 and F2:5 families, as well as the top 50% lines of each F2:5 family [F2:5(50%)], under ASR pressure based on genotyping of the F2 generation from the cross of two elite breeding lines.
Results
ASR symptoms and severity
All plants of the parental lines BRQ16-5409 and BR13-9499 and the segregating generations (F2, F2:3, and F2:5) resulting from their crosses showed tan (TAN) lesions under ASR pressure. The levels of ASR severity (ASRS) in the parents and the average levels in the populations were below 30% in the first evaluation and above 70% in the fourth evaluation for all generations (Figure A; Supplementary data).
The controls BRS 523 and BRS 531 were additionally evaluated in F2:5 and showed TAN and reddish-brown (RB) lesions typical of plants susceptible and resistant to ASR, respectively. ASRS in the parents and the population average was similar to that observed in the susceptible control in each of the four assessments (Figure Ac, supplementary data). The severity of the resistant cultivar BRS 531 was lower than that of the non-resistant plants and did not increase much between the ratings, ranging from 7.9 \(\pm\) 2.9 (first evaluation) to 17.4 \(\pm\) 3.7 (fourth evaluation). Its severity in the fourth evaluation was slightly higher than the severity of non-resistant plants in the first evaluation.
Phenotypic selection in F2 and F2:3
In this study, we evaluated the efficiency of phenotypic selection by calculating the correlations between F2 and F2:3 with F2:5(50%) and the percentage of F2 plants and F2:3 families that resulted in the best F2:5 families. This efficiency allows us to verify the possibility of using marker information in breeding programs. When phenotypic selection is not efficient, the use of marker information can increase selection accuracy and lead to greater genetic gains.
The phenotypic correlations between F2 and F2:5(50%) for seed yield per plant or line (SY), days to maturity (DM), plant height (PH), and 50-seed weight (50SW) were -0.23, 0.74, 0.67, and 0.56, respectively. By adopting a selection percentage of 20% in F2 and F2:5(50%), seven of the 46 F2 plants with higher SY resulted in the best F2:5(50%) families. Thus, only 15.21% of the plants selected in F2 resulted in families selected in F2:5(50%). It contrasts with DM, PH, and 50SW, whose selection in F2 resulted in 60.86%, 56.52%, and 43.47% of the lines selected in F2:5(50%), respectively. The highest number of families selected in F2:5(50%) from selection in F2 usually occurred for traits with higher heritability. The narrow-sense individual-level heritabilities for DM and PH were 0.79 and 0.84, respectively. Although the heritabilities of SY and 50SW were similar (0.59 and 0.53, respectively), the number of families selected in F2:5(50%) from phenotypic selection in F2 was higher for 50SW.
Another way of selection was to use the average of plants from F2:3 families to replace the phenotype of F2 plants. The correlations between F2:3 and F2:5(50%) for SY, DM, PH, and 50SW were -0.19, 0.85, 0.80, and 0.68, respectively. By adopting a selection percentage of 20% in F2:3 and F2:5(50%), for example, two of the 46 F2:3 plants with higher SY resulted in the best F2:5(50%) families. Thus, only 0.04% of the families selected in F2:3 resulted in families selected in F2:5(50%). That was a lower percentage than when the selection was on F2 plants (15.21%). The heritability at the level of the F3 family mean in the narrow-sense was 0.43, lower than that obtained at the individual level in F2 (0.59). On the other hand, the percentages of families selected for DM, PH, and 50SW (65.21%, 56.52%, and 47.82%, respectively) in F2:3 that resulted in families selected in F2:5(50%) were similar or slightly higher than those obtained in F2 (60.86%, 56.52% and 43.47% respectively). The heritabilities at the level of the F3 family mean in the narrow-sense for these traits were 0.95, 0.93, and 0.84, respectively. These heritabilities were higher than the individual-level heritability obtained for F2 (0.79, 0.84 and 0.53). In contrast to F2,

Fig 1. Predictive ability of models under different approaches (GBLUP-A: additive model, GBLUP-AD: dominant-additive model, GBLUP-AE: epistatic-additive model, Bagging, PCR: principal component regression, Bayes-C\(\pi\): Bayes-C\(\pi\) with additive-dominant model) for seed yield per plant or line evaluated in a segregating soybean population under Asian rust pressure. Approaches within the same generation and with the same uppercase letter do not differ by Tukey's test at 5% probability. The same approach between generations and with the same lowercase letter do not differ by Tukey's test at 5% probability.
the heritability in F3 (0.84) for 50SW was higher than that obtained for SY (0.43). On the other hand, the percentages of families selected for DM, PH and 50SW (65.21%, 56.52%, and 47.82%, respectively) in F2:3, that resulted in families selected in F2:5(50%), were similar or slightly higher than those obtained in F2 (60.86%, 56.52%, and 43.47% respectively).
Analysis of variance
Significant Generation x Approach interaction (p ≤ 0.05) was observed for SY, HP, and 50SW but was not significant for DM (Table 1, Supplementary data). Tukey's test comparing approaches within the same generation and generations within the same approach was performed, when there was a significant Generation x Approach interaction (p ≤ 0.05) (Figures 1, 3, and 4). When the interaction was not significant, comparisons were made between generations and between approaches (Figure 2).
Predictive ability of models for soybean yield components in F2 and F2:3
A total of 1763 SNPs were used in the genomic selection, after eliminating markers with a call rate (CR) of less than 90%, and a minor allele frequency (MAF) of less than 5%, as well as those with genotype ratios significantly different from the expected 1:2:1 ratio [with Bonferroni protection (α = 20%)]. Different predictive models were used to estimate the genomic estimated breeding value (GEBV) for various soybean yield components in an F2 population under ASR pressure (Figures 1 to 4). The models Bayes-C\(\pi\) and Bagging generally produced the highest predictive abilities, while the PCR yielded the lowest. Traits with greater heritabilities showed higher predictive ability. Traits with narrow-sense individual level heritabilities close to 0.55 (0.59 for SY and 0.53 for 50SW) had a predictive ability close to 0.35 and traits
with heritabilities close to 0.80 (0.79 for DM and 0.84 for PH) had a predictive ability close to 0.75.
Like the F2 generation, the predictive abilities for soybean yield components in F2:3 were generally higher with Bayes-C\(\pi\) and Bagging and lower with PCR (Figures 1 to 4). Except for SY in F2:3, there were no significant differences (p ≤ 0.05) between the predictive abilities obtained in GBLUP with additive, additive-dominant, and additive-epistatic models for all yield components in F2 and F2:3. The predictive ability of the model for SY in F2:3 using Bagging was similar to that obtained in F2 using Bayes-C\(\pi\) (Figure 1). However, using the same approach, the predictive ability in F2:3 was generally lower than in F2, which corresponds to a reduction in heritability from 0.59 (F2) to 0.43 (F2:3). This difference between generations was much less pronounced for DM and PH, when comparing the best prediction models for each generation or considering the same approach (Figures 2 and 3). On the other hand, the predictive capacity in F2:3 for 50SW was higher than that obtained in F2 for all approaches (Figure 4). That followed the increase in heritability from 0.53 (F2) to 0.85 (F3).
Predictive ability of models for soybean yield components in F2:5
Predictive abilities for soybean yield components in F2:5 were generally highest with Bagging and Bayes-C\(\pi\) and lowest with PCR (Figures 1 to 4). The predictive ability using the average of six lines as a phenotype for SY in F2:5 was higher than F2:3 using the average of six individuals. That was unverified for the other traits, where similar or higher values in F2:3 were obtained.
Also, averages of the 50% best lines of each F2:5 family were predicted. Similar to F2:5, the predictive abilities for soybean yield components in F2:5(50%) were generally highest with Bagging and Bayes-C\(\pi\) and lowest with PCR (Figures 1 to 4). These predictive abilities were slightly lower than those obtained for F2:5. The Pearson
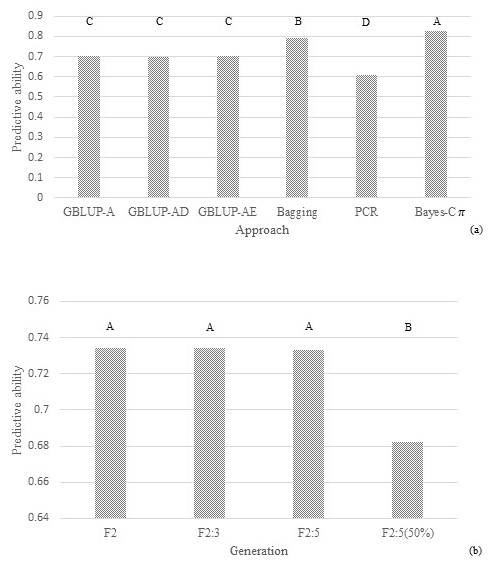
Fig 2. Predictive ability of models under different approaches (GBLUP-A: additive model, GBLUP-AD: dominant-additive model, GBLUP-AE: epistatic-additive model, Bagging, PCR: principal component regression, Bayes-C\(\pi\): Bayes-C\(\pi\) with additive-dominant model) for days to maturity evaluated in a segregating soybean population under Asian rust pressure. Approaches within the same generation and with the same uppercase letter do not differ by Tukey's test at 5% probability. The same approach between generations and with the same lowercase letter do not differ by Tukey's test at 5% probability.
correlations between F2:5 and F2:5(50%) for SY, DM, PH and 50SW were 0.95, 0.94, 0.95 and 0.97, respectively.
Discussion
ASR development in the field
In this study, the line BRQ16-5409 crossed with the line BR13-9499, where both developed by the breeding program of Embrapa Soybean in Brazil through selection for good productivity, even presenting TAN lesions (susceptibility lesion) in the presence of ASR. All the plants in the F2, F2:3, and F2:5 from this cross, showed symptoms of TAN lesion, and the progression of severity in the parents and segregating generations was different from that shown by the resistant cultivar BRS 531 in F2:5 (Figure Ac, supplementary data), indicating the absence of major resistance genes in the studied population.
In addition to resistance, tolerant cultivars avoid productivity losses caused by ASR. Tolerance can be defined as the ability of the plant to support the pathogen development without presenting a significant decrease in productivity (Schafer, 1971). Usually, yield losses are employed to assess tolerance, and the lower the loss, the higher the tolerance (Zambolim et al., 2022). Losses are calculated by the difference in productivity between severely infected and uninfected plots (Zadocks, 1985). Zambolin et al. (2022) reported that rust-tolerant lines can be selected from segregating populations, growing
under conditions of severe ASR attack, simply by selection for productivity. However, plants with TAN lesions in the F2, F2:3, and F2:5 (Figure A; Supplementary data), but with good productivity, may not be tolerant. As we evaluate segregating generations, we do not have information on the loss of productivity of each genotype to know its tolerance level. In addition, one genotype may be more productive than another under disease pressure and have less tolerance. For example, a genotype ‘A’ may produce 2,000 kg/ha in the absence of the disease and 1,900 kg/ha under disease pressure, resulting in a 100 kg/ha yield reduction. Contrarily, genotype ‘B’ may produce 1,800 kg/ha in the absence of the disease and 1,750 kg/ha under disease pressure, resulting in a 50 kg/ha reduction. Thus, genotype A is more productive under disease pressure even though it is less tolerant than genotype B. Here, the study focuses on more selecting productive genotypes under disease pressure, without distinguishing whether they are more or less tolerant (or non-tolerant) compared to those that are not selected.
Plants may also have an escape mechanism, showing rapid phenological development before the disease becomes severe and causes physiological damage (Zambolim et al., 2022). Although all plants had ASRS greater than 70% at the fourth evaluation in all generations (Figure A, supplementary data), earlier plants spent less time suffering the effects of rust attack.
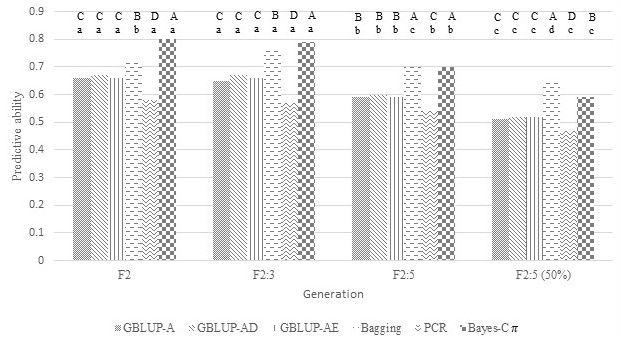
Fig 3. Predictive ability of models under different approaches (GBLUP-A: additive model, GBLUP-AD: dominant-additive model, GBLUP-AE: epistatic-additive model, Bagging, PCR: principal component regression, Bayes-C\(\pi\): Bayes-C\(\pi\) with additive-dominant model) for plant height evaluated in a segregating soybean population under Asian rust pressure. Approaches within the same generation and with the same uppercase letter do not differ by Tukey's test at 5% probability. The same approach between generations and with the same lowercase letter do not differ by Tukey's test at 5% probability.
The escape mechanism was most evident in F2:5, where the correlations between SY and 50SW with DM were -0.77 and -0.75, respectively. In F2, although the Pearson correlation between 50SW and DM was -0.54, the correlation between SY and DM was non-negative (0.34).
The behavior of disease severity progression in generations in 2019, 2020, and 2022 (Figure A; Supplementary data) was similar to that found by Lima et al. (2012), with an increase of more than 40% in severity level between the first and last evaluation, indicating that there were sufficient climatic conditions for disease development in the field. ASRS of more than 70% in the fourth evaluation observed in the F2, F2:3, and F2:5 generations (Figure A; Supplementary data) allowed the construction of models to predict the GEBV of soybean plants for yield components under disease pressure (Figures 1 to 4).
Early-generation selection
The phenotypic selection was efficient in selecting 50SW, but mainly for DM and PH, which had higher heritabilities (0.79 and 0.84, respectively). However, it was unsuccessful for SY, whose correlation between F2 and F2:5 was low (r = -0.23). Several studies have indicated genomic selection use for traits with lower heritability to increase selection gains in soybeans (Duhnen et al., 2017; Matei et al., 2018; Bandillo et al., 2022; Miller et al., 2023). For this, models obtained from the training and validation populations can be used to predict GEBV of a target population (Meuwissen et al., 2001; Sousa et al., 2019; Costa et al., 2022; Miller et al., 2023). In this study, models were obtained from the training and validation populations due to the low accuracy of phenotypic selection for SY (Figures 1 to 4). For this, the phenotyping of yield components of the F2:3 and F2:5 generations and the genotyping of the F2 generation from the crossing of
the lines BRQ16-5409 and BR13-9499 were performed in soybean plants under ASR pressure.
F2:3 phenotyping and F2 genotyping may be beneficial in generating models if their predictive abilities are greater than those generated by models using phenotyping and genotyping in F2. The use of F2:3 in predicting SY, DM, and HP was not advantageous, because the predictive abilities of the best models using F2 and F2:3 were similar or lower than those obtained when using phenotyping and genotyping in F2 (Figures 1 to 3). On the other hand, the predictive abilities of models using phenotyping in F2:3 for 50SW were higher than those obtained in F2 (Figure 4). The greater this superiority, the more advantageous the use of F2:3 phenotyping may be, increasing the possibility of higher selection gains. Although it is necessary to advance one generation and increase the number of phenotyped plants to build the models, this strategy does not increase the cost of genotyping, as this activity is performed in the F2 generation. The results presented in Figures 1 to 4 are related to the heritability differences estimated between generations. The difference in heritabilities for SY (0.59, 0.43, respectively), DM (0.79, 0.95), and PH (0.84, 0.93) in F2 and F2:3 were closer to those found for 50SW (0.53, 0.84). Heritabilities were estimated at the individual level for F2 and at the family average level for F2:3, reflecting the use of individual data in F2 and family mean data in F3 for model estimation. Costa et al. (2022) also found increased predictive ability with increasing heritability. The authors simulated data from F2 populations for twelve traits with heritabilities ranging from 0.5 to 0.8. The predictive capacity of the model generated for a trait with a heritability of 0.8 was 81% greater than that with a heritability of 0.5.
For construction of the predictive models, replacing the phenotype of the F2 plants by the average of the lines of each F2:5 and F2:5(50%) family enabled us to obtain
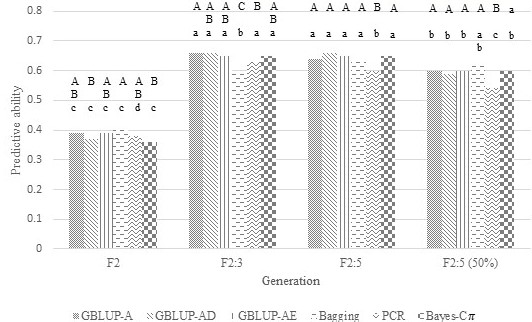
Fig 4. Predictive ability of models under different approaches (GBLUP-A: additive model, GBLUP-AD: dominant-additive model, GBLUP-AE: epistatic-additive model, Bagging, PCR: principal component regression, Bayes-C\(\pi\): Bayes-C\(\pi\) with additive-dominant model) for 50-seed weight evaluated in a segregating soybean population under Asian rust pressure. Approaches within the same generation and with the same uppercase letter do not differ by Tukey's test at 5% probability. The same approach between generations and with the same lowercase letter do not differ by Tukey's test at 5% probability.
their predictive ability between 0.61 \(\pm\) 0.01 to 0.84 \(\pm\) 0.01 in F2:5 and 0.57 \(\pm\) 0.03 to 0.79 \(\pm\) 0.02 in F2:5(50%), depending on the evaluated trait (Figures 1 to 4). The selection of the best F2:5 families for a yield component considered only the average of their lines. However, two families can have the same average but exhibit different standard deviations. When this occurs, the family with the higher deviation will have a higher probability of having superior lines (Zhong and Jannink, 2007). In this study, the superiority was verified in the selection of families, using F2:5(50%). For instance, consider one of the analyses of two F2:5 families under selection for grain yield. The first family had six lines, each producing 200, 389, 391, 250, 279, and 269 grams of seeds per line, respectively. The second family also had six lines, producing individually 363, 253, 291, 355, 247, and 271 grams of seeds per line. Both families had an average yield of approximately 296 grams of seeds per line. However, the standard deviation of the first family was 78 grams of seeds per line, while the standard deviation of the second family was 51 grams of seeds per line. When we selected the top 50% of lines from each family [F2:5(50%)], the average yield of the first family was 353 grams of seeds per line, and the average yield of the second family was 336 grams of seeds per line. Then, the analysis of the F2:5(50%) families considered both the means and variances of the F2:5 families and consequently selected families that generated lines with higher phenotypic values of SY.
Models using different approaches showed different predictive abilities (Figures 1 to 4), as confirmed in other genomic selection studies (Azevedo et al., 2013; Duhnen et al., 2017; Costa et al., 2022; Gebremedhin et al., 2024). However, regardless of these differences, the models were able to detect the same inter-generational variations, such as the increase in predictive ability in F2:3 for 50SW, the increase in predictive ability in F2:5 and F2:5(50%) for SY, and the similar inter-generational predictive abilities for DM and HP.
Breeding program
Although the F2, F2:3, and F2:5 evaluations in both the training and validation populations were conducted under field conditions (Figures 1 to 4), and the F2:4 generation was assessed in a greenhouse, this does not preclude the generation of F2:5(50%) models in breeding programs. These models can be developed by growing the earlier generations (F2, F2:3, and F2:4) in a greenhouse and evaluating only the F2:5 generation in the field, particularly for yield components under ASR pressure. This can reduce the time to advance generations. The inoculation with the pathogen is done in F2:5 and the genotyping in F2. In this study, the numbers of 230 genotyped plants in F2 and 1380 phenotyped lines in F2:5 (230 families x six lines per family) under ASRS pressure have proven to be adequate for construction of the models. Alternatively, the evaluation of yield components under disease pressure can be done in F2:4 by sowing lines within families, which will reduce one generation cycle.
Genomic selection leverages phenotype and genotype data from earlier generations or historical data and the prediction of GEBV of new populations without performing phenotyping to save resources and increase long-term genetic gain (Meuwissen et al., 2001; Duhnen et al., 2017). In this study, the models were built using later-generation (F2:3 and F2:5) phenotypes and F2-generation genotypes from one small population derived from the cross between two elite breeding lines. These models can be potentially applied in the prediction of GEBV in a larger target population derived from the same cross or from crosses that share a similar genetic background with our target population (under current study). This strategy allows the assessment of a higher number of promising genotypes in the advanced stages of the target population, as it eliminates the less promising ones in the initial stages. Early-generation selection is crucial, when there is a requirement for specific environmental conditions for genotype selection, as occurs in selecting productive genotypes under ASR pressure. The number of genotyped F2 plants in a target population may vary depending on the structural capacity of the breeding program. In a hypothetical scenario with 1,000 genotyped F2 plants and a 10% selection rate, one could obtain 100 F3 lines (one F2 plant per F3 line) and subsequently generate 10,000 F4 lines (100 F4 lines per F3 line). A new assessment of ASRS can be made in F2:4 to increase the accuracy of selection. Since genomic selection eliminated 90% of the plants in F2, this evaluation corresponds to one in 100,000 lines in a selection based on phenotype alone. In the latter case, the breeding program requires a larger logistical structure to conduct and harvest the lines, inoculate the pathogen, and maintain appropriate environmental conditions for allowing field disease development. Thus, the reduction in the number of genotypes in a target population is crucial to improve the likelihood of selecting high-yielding soybean genotypes under ASR pressure in more advanced stages.
Genomic selection showed efficiency in predicting yield components of soybean genotypes under ASR pressure in subsequent generations (F2:3 and F2:5) from the cross between two elite breeding lines. For this purpose, phenotyping of advanced generations (F2:3 and F2:5) under disease pressure and genotyping of the F2 generation were used to obtain genomic prediction models. The use of these models for early-generation selection in a target F2 population from the same cross or shares a similar genetic background with the population under study will reduce the number of segregating lines and consequently optimize the mechanical and financial resources of breeding programs to develop productive soybean genotypes under ASR pressure and increase selection gains.
Materials and methods
Plant materials
The yield components of soybean plants under ASR pressure were evaluated in the F2, F2:3, and F2:5 generations resulting from the cross between the lines BRQ16-5409 and BR13-9499, developed by the breeding program of Embrapa Soybean in Brazil (Figure B, supplementary data). BRQ16-5409 was developed to achieve higher productivity under Asian soybean rust pressure, and BR13-9499 for high yield without disease pressure. The BRQ16-5409 line was derived from the cross between the cultivars BRS 284 and W-20, and the BR13-9499 line from the cross between the cultivars BRS 284 and BMX Potência. The parents of BRQ16-5409 and BR13-9499 lack the Rpp1 to Rpp7 genes, which confer resistance to P. pachyrhizi (Childs et al., 2018). BRQ16-5409 and BR13-9499 have indeterminate growth habits and belong to maturity group 6, aimed at planting in the northern region of Paraná, Brazil.
Field trials
Phenotypic data were obtained from three trials carried out at the experimental field of Embrapa Soja in Londrina, PR, Brazil. The field is at latitude 23°11'37” S, longitude 51°11'03” W and altitude 630 meters. The local climate is humid subtropical (Cfa), according to the Köppen-Geiger climate classification and the soil is Typic Haplorthox.
The first trial was sown in November 2019 and included the two parents -- BRQ16-5409 and BR13-9499 -- with 50 replications each, along with 230 F2 plants resulting from this cross, for a total of 330 plants grown in single-plant hill plots (01 hill-plot = 01 plant) randomly arranged in the field (Lima et al., 2012).
The second trial was sown in November 2020 and included the two parents and 230 F2:3 families obtained from the F2 plants of the first trial. Each parent was replicated 30 times in the trial, and each F2:3 family consisted of six plants, for a total of 1440 randomized single-plant hill plots. In 2019 and 2020, the spacing between hill plots within the rows was 20 cm and 1.5 m between the rows. Two rows of the susceptible cultivar BRS Conquista were border at this 1.5 m distance and around the trial.
The third trial was sown in November 2022 and included the two parents with 30 replications each and 230 F2:5 families with six lines each. Each of the 1380 F2:3 plants generated F2:4 plant, which then grown to seeds of an F2:5 line in the greenhouse. In addition, the ASR-resistant and susceptible check cultivars BRS 531 and BRS 523 were evaluated with 30 repetitions each (1 repetition = 1 line). The trial consisted of 1500 single-row plots, three meters long and 0.5 meters apart. The adopted experimental layout was an augmented block design (Federer, 1961). The 1380 F2:5 lines were field-randomized planting. For every 50 F2:5 lines, one line of each parent and each control were sown. The cultivar BRS Conquista was sown as a border around the experiment. The sowing density of the three experiments was close to 250,000 plants ha-1 to simulate soybean growth. Fertilization, weeding, and pest control were adopted to allow optimal plant development (Seixas et al., 2020).
Inoculation with ASR in the three trials was carried out using a manual sprayer. The spore suspension was applied only to the borders sown with the susceptible cultivar BRS Conquista at the V3 developmental stage (Lima et al., 2012). Spraying was carried out with a suspension containing 1 x 10⁴ mL-1 of uredospores in sterilized distilled water supplemented with 0.5 mL of Tween 20, with the uredospore concentration adjusted using a Neubauer chamber. In 2019, the field environmental conditions, from 5 days before to 5 days after inoculation, were an average relative humidity of 86.4%, accumulated rainfall of 26.4 mm, and accumulated global solar radiation of 16 MJm-2. In 2020, the values were 92.3%, 52.2 mm, and 15.3 MJm-2, and in 2022, 87.6%, 139.4 mm, and 14.7 MJm-2, respectively. The pathogen inoculum was propagated in the BRS Conquista sown in 4.0 kg pots containing a sterilized mixture of soil, sand, and manure for approximately 70 days in a greenhouse at an average temperature of 25°C and natural lighting (Ribeiro et al., 2007; Pierozzi et al., 2008).
Plants were harvested at the R7 stage, shade-dried, threshed, and weighed individually in the first two trials and a row in the third one.
Phenotyping
The traits evaluated were SY, 50SW, DM, PH, and ASRS. Assessment of the plant cycle allowed us to verify whether plants with higher SY and greater 50SW had an early cycle, which consisted of a strategy to escape the disease (Godoy et al., 2016). For this purpose, Pearson correlations were calculated between SY and 50SW with DM in F2 and F2:5, since SY and 50SW are traits affected by the occurrence of ASR (Godoy et al., 2006). Plant heights were measured to develop cultivars with higher resistance to lodging.
ASRS was estimated as a percentage of leaf area infected by the pathogen using the graphical scale developed by Franceschi et al. (2020). Four assessments were made in the middle third of the plants at approximately seven-day intervals. The initial assessment took place around 80 days after emergence, when the crop canopy had closed and a more favorable microclimate for infection had been established, due to higher humidity and shading (Isard et al., 2006). Additionally, the plants were evaluated and classified based on the type of present lesion, which were either RB or TAN (Hartman et al., 2015). These assessments allowed for the quantification of disease and the identification of resistant genotypes associated with the unexpected presence of major genes.
Genotyping
When seedlings of 230 F2 plants were three weeks old, leaf tissue samples were collected, placed in 50 mL Falcon tubes, lyophilized, and ground to a fine powder for DNA extraction. DNA was extracted using a modified CTAB protocol (Rogers and Bendich, 1994). Genotyping was performed by selecting a set of 4,224 SNPs from those validated in the previously developed soybean BARCSoySNP6K chip (Song et al., 2020) to populate a sector of the EMBRAPA multispecies 65K Infinium chip. This chip contains 66,413 SNPs in total, shared among 27 different plant and animal species, significantly reducing the cost of genotyping individual samples, while allowing the generation of high-quality and inter-laboratory portable SNP data for all species. SNPs were selected based on criteria that included performance metrics of the SNPs in previously genotyped germplasms including SNP CR, MAF, and SNP quality parameters from previous reports. SNP genome address information in the reference genome was also considered to distribute SNPs across chromosomes to maximize recombination space coverage and allow genotype imputation in future studies. Genotyping was executed at Neogen/Geneseek (Lincoln, NE). Manifest files and intensity data (.idat files) were obtained from Neogen. SNP genotypes were called using GenomeStudio 2.0 (Illumina, Inc. San Diego, CA) following the standard genotyping and quality control procedures (Illumina, 2010) and exported in the AB format where alleles A and T at the SNPs are coded as “A” and alleles G or C at the SNPs are coded as allele “B”. Marker data for F2 plants were coded for genomic selection analyses. Genotypes homozygous for the major allele were coded as 2, heterozygous genotypes were coded as 1, and genotypes homozygous for the minor allele were coded as 0.
Marker quality control
Quality control of SNP markers was performed after genotyping of F2 plants to check for the presence of rare alleles in the population, markers with a large number of missing genotypes, and whether the observed genotypic frequencies of the markers were consistent with the 1:2:1 ratio expected in an F2 population. Markers with CR less than 90% and MAF less than 5% and whose genotype ratios deviated significantly from the expected 1:2:1 ratio (with Bonferroni protection (α = 20%)) were excluded from the analysis.
Genomic breeding values
The models for estimating the GEBV of soybean yield components were obtained using genotyping of individual plants from the F2 generation and phenotyping of the F2, F2:3, F2:5, and the top 50% of lines in each F2:5 family [F2:5(50%)]. The phenotyping consisted of values from individual plants in the F2 generation, average values from six plants in F2:3, average values from six lines in F2:5, and average values from three upper or lower lines in F2:5(50%), depending on the trait. The top 50% of lines in each F2:5(50%) family had the highest SY, highest 50SW, lowest DM, or lowest PH.
We used different approaches for model construction such as G-BLUP (Bernardo, 1994; VanRaden, 2008), bagging (Breiman, 1996; Prasad et al., 2006), principal component regression (Solberg et al., 2009; Azevedo et al., 2013), and Bayes-C\(\pi\) (Habier et al., 2011). The additive, additive-dominant, and additive-epistatic kernels fit in the G-BLUP approach (Zhang et al., 2019; Costa et al., 2022). In the bagging method, 500 trees were grown (Costa et al., 2022). For principal component regression, the number of components was selected based on the highest predictive ability (Long et al., 2011). Bayesian analysis involved 500,000 interactions, a burn-in of 50,000, and a thin of five. Convergence analysis was performed according to Geweke’s criteria (Geweke, 1992).
Predictive ability of models for soybean yield components
A total of 230 F2 plants resulting from the cross between the lines BRQ16-5409 and BR13-9499 were randomly divided into 5 groups (folds), each containing 46 plants. We gathered 184 plants from 4 folds to form a training population and 46 plants from 1-fold to form a validation population. This process of creating training and validation populations was the first iteration. Four more iterations were conducted so that all F2 plants took part in 4 training stages and 1 validation stage.
Models were created using the genotyping and phenotypic values of the yield components of F2 plants from each training population. These models were then used to estimate the GEBV and the predictive capacity of these models. The predictive capacity was measured as the correlation between the GEBV and the phenotypic values of the plants in the validation population. The average of the predictive abilities of the models obtained in the five iterations was defined as the predictive ability of the first division.
The random division of the F2 population into 5 folds was repeated nine more times, resulting in a total of 10 divisions. Similar to the first division, we calculated the model predictive abilities of the other nine divisions, resulting in 10 predictive abilities. Finally, we obtained the mean and the respective standard deviation of the predictive abilities of the 10 divisions.
Additionally, the predictive abilities of the models were calculated using the F2 plant genotyping and the phenotypic values of yield components in F2:3, F2:5, and F2:5(50%). This process involved averaging the data from six plants, six lines, and three lines, respectively, rather than relying on the phenotypic information of individual plants in the F2 generation.
Heritability, correlation and phenotypic selection
The genetic components of variance were estimated using the weighted least squares method, and these estimates were used to calculate the narrow-sense heritabilities of the yield components at the individual level in F2 and the family mean level in F3 (Mather and Jinks, 1984). Correlations of F2 and F2:3 with F2:5(50%) were obtained to verify the feasibility of phenotypic selection, and the correlation between F2:5 and F2:5(50%) was analyzed to check for any differences in the predictive abilities of their generated models. The feasibility of phenotypic selection was also verified by calculating the percentage of F2 plants and F2:3 families that resulted in the best F2:5 families.
Statistical analyses
The narrow-sense heritabilities of the yield components were calculated using the GENFIT software (Toledo, 1991). The correlations of F2 and F2:3 with F2:5(50%) were estimated using the GENES software (Cruz, 2016).
A Tukey´s test compared the predictive abilities of different model approaches for yield components evaluated across different generations (Cruz, 2016). The comparisons between approaches within the same generation and between generations within the same approach were performed when there was a significant Generation x Approached interaction (p ≤ 0.05). When the interaction was not significant, comparisons were made between generations and between approaches.
The marker quality control and the estimates of GEBV and predictive abilities of the models using G-BLUP, bagging, principal component regression, and Bayesian analysis were performed using the GenomicLand software (Azevedo et al., 2019).
Conclusion
The genomic selection allows for constructing models for seed yield per plant, days to maturity, plant height, and 50-seed weight that predict the phenotyping of advanced generations of a population under Asian soybean rust pressure from the genotyping of the F2 generation.
Acknowledgments
To the Brazilian National Council for Scientific and Technological Development (CNPq) for granting a scholarship to the first author (process number 200165/2023-2). We also thank the Embrapa Cenargen team on behalf of Dario Grattapaglia, who developed the Embrapa 65K Multispecies chip.
Statement of contributions
CGP de C, AJL and CDC carried out the conception and design of the study. CGP de C and CAAA prepared the material and collected the data. All authors performed analysis. CGP de C and AJL wrote the first draft of the manuscript. All authors read and approved the final manuscript.
References
Azevedo CF, Resende MDV, Silva FF, Lopes PS, Guimarães SEF (2013) Regressão via componentes independentes aplicada à seleção genômica para características de carcaça em suínos. Pesqui Agropecu Bras. 48:619-626.
Azevedo CF, Nascimento M, Fontes VC, Silva FF, Resende MDV, Cruz CD (2019) GenomicLand: Software for genome-wide association studies and genomic prediction. Acta Sci-Agron. 41:45361.
Bandillo NB, Jarquin D, Posadas LG, Lorenz AJ, Graef GL (2022) Genomic selection performs as effectively as phenotypic selection for increasing seed yield in soybean. Plant Genome 16:e20285.
Bernardo R (1994) Prediction of maize single-cross performance using RFLPs and information from related hybrids. Crop Sci. 34:20-25.
Bock CH, Chiang K, Ponte EM (2022) Plant disease severity estimated visually: a century of research, best practices, and opportunities for improving methods and practices to maximize accuracy. Trop Plant Pathol. 47:25-42.
Breiman L (1996) Bagging Predictors. Mach Learn. 24:123–140.
Childs SP, King ZR, Walker DR, Harris DK, Pedley KF, Buck JW, Boerma HR, Li Z (2018) Discovery of a seventh Rpp soybean rust resistance locus in soybean accession PI 605823. Theor Appl Genet. 131:27-41.
Costa WG, Celeri MO, Barbosa IP, Silva GN, Azevedo CF, Borem A, Nascimento M, Cruz CD (2022) Genomic prediction through machine learning and neural networks for traits with epistasis. Comp Struct Biotechnol J. 20:5490-5499.
Cruz CD (2016) Genes Software – extended and integrated with the R, Matlab and Selegen. Acta Sci-Agron. 38:547-552.
Duangjit J, Causse M, Sauvage C (2016) Efficiency of genomic selection for tomato fruit quality. Mol Breeding 36:29.
Duhnen A, Gras A, Teyssèdre S, Romestant M, Claustres B, Daydé J, Mangin B (2017) Genomic selection for yield and seed protein content in soybean: A study of breeding program data and assessment of prediction accuracy. Crop Sci. 57:1325-1337.
Federer WT (1961) Augmented Designs with One-Way Elimination of Heterogeneity. Biometrics 17:447–473.
Franceschi VT, Alves KS, Mazaro SM, Godoy CV, Duarte HSS, Ponte EM (2020) A new standard area diagram set for assessment of severity of soybean rust improves accuracy of estimates and optimizes resource use. Plant Pathol. 69:495-505.
Gebremedhin A, Li Y, Shunmugam ASK, Sudheesh S, Valipour-Kahrood H, Hayden MJ, Rosewarne GM, Kaur S (2024) Genomic selection for target traits in the Australian lentil breeding program. Front Plant Sci. 14:1284781.
Geweke J (1992) Evaluating the accuracy of sampling-based approaches to the calculation of posterior moments. In: Bernardo JM, Berger JO, David AP, Smith AFM (eds) Bayesian statistics. Oxford University Press, Oxford, pp. 625.
Godoy CV, Koga LJ, Canteri MG (2006) Diagrammatic Scale for Assessment of Soybean Rust Severity. Fitopatol Bras. 31:63–68.
Godoy CV, Seixas CDS, Soares RM, Marcelino‑Guimaraes FC, Meyer MC, Costamilan LM (2016) Asian soybean rust in Brazil: past, present, and future. Pesqui Agropecu Bras. 51:407-421.
Habier D, Fernando RL, Kizilkaya K, Garrick DJ (2011) Extension of the bayesian alphabet for genomic selection. BMC Bioinformatics 12:186.
Hartman GL, Sikora EJ, Rupe JC (2015) Rust. In: Hartman GL, Rupe JC, Sikora EJ, Domier LL, Davis JA, Steffey KL (eds) Compendium of soybean diseases and pests, 5th edn. APS Press, Saint Paul, pp 56-59.
Illumina (2010) Illumina Inc., https://www.illumina.com/Documents/products/technotes/technote_infinium_genot21yping_data_analysis.pdf. Accessed 23 November 2010
Isard SA, Dufault NS, Miles MR, Hartman GL, Russo JM, Wolf ED, Morel W (2006) The effect of solar irradiance on the mortality of Phakopsora pachyrhizi urediniospores. Plant Dis. 90:941-945.
Lima WF, Prete CEC, Ribeiro AS, Toledo, JFF (2012) Resistência da soja à ferrugem-asiática avaliada pela análise da produtividade de grãos. Summa Phytopathol. 38:73-78.
Long N, Gianola D, Rosa GJM, Weigel KA (2011) Dimension reduction and variable selection for genomic selection: application to predicting milk yield in Holsteins. J Anim Breed Genet. 128:247-257.
Matei G, Woyann LG, Milioli AS, Oliveira IB, Zdziarski AD, Zanella R, Coelho ASG, Finatto T, Benin, G (2018) Genomic selection in soybean: accuracy and time gain in relation to phenotypic selection. Mol Breeding 38:1-13.
Mather K, Jinks JL (1984) Introdução à genética biométrica. Sociedade Brasileira de Genética, São Paulo. pp.242.
Meuwissen THE, Hayes BJ, Goddard, ME (2001) Prediction of total genetic value using genome-wide dense marker maps. Genetics 157:1819-1829.
Michel S, Kummer C, Gallee M, Hellinger J, Ametz C, Akgöl B, Epure D, Löschenberger F, Buerstmayr H (2018) Theor Appl Genet. 131:477-493.
Miller MJ, Song Q, Fallen B, Li Z (2023) Genomic prediction of optimal cross combinations to accelerate genetic improvement of soybean (Glycine max). Front Plant Sci. 14:1171135.
Pierozzi PHB, Ribeiro AS, Moreira JUV, Laperuta LDC, Rachid BF, Lima WF, Arias CAA, Oliveira MF, Toledo JFF (2008) New soybean (Glycine Max Fabales, Fabaceae) sources of qualitative genetic resistance to Asian soybean rust caused by Phakopsora pachyrhizi (Uredinales, Phakopsoraceae). Genet Mol Biol. 31:505–511.
Prasad AM, Iverson LR, Liaw A (2006) Newer classification and regression tree techniques: Bagging and random forests for ecological prediction. Ecosystems 9:181-99.
Ribeiro AS, Moreira JUV, Pierozzi PHB, Rachid BF, Toledo JFF, Arias CAA, Soares RM, Godoy CV (2007) Genetic control of Asian rust in soybean. Euphytica 157:15-25.
Rogers SO, Bendich AJ (1994) Extraction of total cellular DNA from plants, algae and fungi. In: Gelvin SB, Schilperoort RA (eds) Plant Molecular Biology Manual, 2nd edn. Kluwer Academic Publishers, Dordrecht, pp 1–8.
Schafer JF (1971) Tolerance to plant disease. Annu Rev Phytopathol 9:235-252.
Seixas CDS, Neumaier N, Balbinot Junior AA, Krzyanowski FC, Leite RMVBC (2020) Tecnologias de produção de soja. Embrapa Soja, Londrina. pp.346.
Solberg TR, Sonesson AK, Woolliams JA, Meuwissen THE (2009) Reducing dimensionality for prediction of genome‑wide breeding values. Genet Sel Evol. 41:29.
Song Q, Yan L, Quigley C, Fickus E, Wei H, Chen L, Dong F, Araya S, Liu J, Hyten D, Pantalone V, Nelson RL (2020) Soybean BARCSoySNP6K: An assay for soybean genetics and breeding research. Plant J. 104:800-811.
Sousa TV, Caixeta ET, Alkimim ER, Oliveira ACB, Pereira AA, Sakiyama NS, Zambolim L, Resende MDV (2019) Early Selection Enabled by the Implementation of Genomic Selection in Coffea arabica Breeding. Front Plant Sci. 9:1934.
Toledo JFF (1991) Programa de computador para estimar parâmetros genéticos, componentes de médias e variâncias, pelo método dos quadrados mínimos ponderados. Pesqui Agropecu Bras. 26:1023–1039.
VanRaden PM (2008) Efficient methods to compute genomic predictions. J Dairy Sci. 91:4414-4423.
Wartha CA, Lorenz AJ (2021) Implementation of genomic selection in public-sector plant breeding programs: Current status and opportunities. Crop Breed Appl Biotechnol. 21:e394621S15.
Wu X, Beissinger TM, Bauck S, Woodward B, Rosa GJM, Weigel KA, Gatti NL, Gianola D (2011) A primer on high-throughput computing for genomic selection. Front Gent. 23:1-10.
Zadocks JC (1985) On the conceptual basis of crop loss assessment: The threshold theory. Annu Rev Phytopathol. 23:455-473.
Zambolim L, Reis EM, Guerra WD, Juliatti FC, Menten JOM (2022) Integrated Management of Asian Soybean Rust. Eur J Appl Sci. 10: 602-633.
Zhang H, Yin L, Wang M, Yuan X, Liu X (2019) Factors Affecting the Accuracy of Genomic Selection for Agricultural Economic Traits in Maize, Cattle, and Pig Populations. Front Genet. 10:1-10.
Zhong S, Jannink J (2007) Using quantitative trait loci results to discriminate among crosses on the basis of their progeny mean and variance. Genetics 177: 567-576.