
Aust J Crop Sci. 19(04):436-441 (2025) | ISSN:1835-2707
https://doi.org/10.21475/ajcs.25.19.04.p322
Effects of varying electrical conductivity levels on plant growth, yield, and photosynthetic parameters of Tochiotome strawberry (Fragaria × ananassa 'Tochiotome) in a greenhouse
Nguyen Quoc Hung1, Nguyen Thi Thanh Nga3*, Vu Phong Lam2*
1Fruit and Vegetable Research Institute, Ha Noi 12400, Vietnam
2Faculty of Agriculture and Forestry, Tay Bac University, Son La 360000, Vietnam
3Faculty of Heath Sciense, Tay Bac University, Son La 360000, Vietnam
*Corresponding author: Nguyen Thi Thanh Nga  and Vu Phong
Lam
and Vu Phong
Lam
Abstract: This study aimed to identify the salinity threshold affecting plant health and optimal conditions for sustainable strawberry cultivation in greenhouses. By identifying the optimal EC range that promotes plant growth while minimizing salinity stress, this study offers strategies to mitigate the negative effects of salinity on crop production. This study was conducted in a hydroponic system, where strawberries were irrigated with different EC levels (0.5, 1.0, 2.0, 4.0, 6.0, and 8.0 dS·m⁻¹) using Hoagland nutrient solutions. We applied irrigation treatments with different electrical conductivity (EC) levels to evaluate their effects on the growth, yield, and photosynthetic performance of Fragaria × ananassa ‘Tochiotome’ strawberries. The crown and leaf fresh weights, root length, individual fruit weight, leaf area, SPAD values (chlorophyll content), Brix percentage (fruit sweetness), and overall yield were measured. The results showed that EC influenced water uptake, nutrient availability, and physiological aspects of the plant. The EC levels above 6.0 dS·m⁻¹ significantly reduced crown and leaf fresh weights due to osmotic stress and nutrient imbalances, negatively affecting biomass accumulation. Root length also decreased at higher EC levels, indicating compromised root growth, while individual fruit weight was declined likely due to impaired nutrient uptake. In contrast, leaf area, SPAD values (chlorophyll content indicator), and Brix percentage (fruit sweetness) remained stable, suggesting resilience in some plant traits. Yield was declined at both high and low EC levels, which might be attributed to a reduced fruit size and nutrient uptake limitations. Moderate salinity levels (2.0–4.0 dS·m⁻¹) initially improved photosynthetic parameters, but higher levels (6.0–8.0 dS·m⁻¹) reduced photosynthetic efficiency. These results suggest that maintaining the EC between 2.0 and 4.0 dS·m⁻¹ optimizes plant growth and photosynthesis, whereas deviations above or below this range may lead to salinity stress or nutrient deficiencies.
Keywords: electrical conductivity, growth, yield, photosynthetic parameters, strawberry.
Introduction
Strawberries (Fragaria × ananassa) are renowned for their high economic value and allure in Vietnam. This delectable fruit boasts delicate flavor, refreshing qualities, and an attractive red hue, making it a favorite globally (Fan et al., 2021a). Strawberry production has evolved with growers adopting various cultivation systems, including open ground production, protected environments, and hydroponics. A hydroponic system is a method of growing plants without soil, involving the precise delivery of nutrient solutions and blending both art and science in crop cultivation (Hernández-Martínez et al., 2023). In hydroponics, plants receive essential nutrients directly through a water-based solution that delivers them to the roots. Combining greenhouse technology with high-tech agriculture requires substantial capital investment but offers high productivity, efficient water and land use, and environmental protection. In these systems, careful regulation of both the aerial and root environments is essential. Production occurs within enclosures that are specially designed to manage air and root temperatures, light, water, nutrients, and protection from adverse climate conditions (Achour et al., 2021). Strawberries, esteemed for their economic significance and widespread cultivation, face a significant challenge in drought stress due to their rapid growth and shallow root system. Their reliance on ample water for transpiration contrasts with their low tolerance for waterlogging. Consequently, drought stress and its impact on internal water levels emerges as the foremost concerning among all abiotic factors influencing strawberry growth (Fan et al., 2021b; Hernández-Martínez et al., 2023). Maintaining the appropriate EC concentration in the nutrient solution is essential for delivering the necessary nutrients to the plants and ensuring their optimal growth and development (Farhangi et al., 2023). The growth of pak choi plants was shown to be hindered by an unbalanced ion composition, as well as excessively low or high concentrations of the nutrient solution (NS) (measured at 0.3, 0.6, and 1.2 dS·m−1, or a higher value of 9.6 dS·m−1), leading to nutritional deficiencies, ion toxicity, and salinity stress (Ding et al., 2018). The salt concentration and electrolyte concentration index of the solution are dictated by the EC. Furthermore, the EC of the nutrient solution serves as an indicator of ion availability for plants within the root zone (Lu et al., 2017). Research has indicated that a high EC of the nutrient solution (NS) can hinder plant growth, decrease osmotic potential, and impede the absorption of nutrients due to salt stress. Conversely, a low EC of the NS has been shown to diminish yield and plant growth as a result of nutrient deficiency (Park et al., 2016). At an EC of 2.0 dS·m−1, the total phenol, chlorogenic acid, and kaempferol contents reached their maximum levels in carrots (Cho et al. 2018). Meanwhile, at 3.0 dS·m−1, the fresh and dry weights of carrots were significantly increased (Cho et al., 2018). Raising the EC from 0.5 to 2.5 dS·m−1 led to a notable increase in the antioxidant capacity and total phenolic content per shoot of Crepidiastrum denticulatum. Concurrently, the number of leaves, fresh weight, and leaf area demonstrated significant elevation at 2.0 and 2.5 dS·m−1 compared to levels observed at 0.5, 1.0, and 1.5 dS·m−1 (Park et al., 2016). At extremes of high or low EC levels in the nutrient solution (NS), there was a significant increase in antioxidant enzyme activities. Conversely, fresh weights exhibited a significant decrease under both low and high EC conditions, attributed to nutrient inadequacy and salinity stress, respectively (Ding et al., 2018). Hence, an overly low EC of the nutrient solution (NS) may result in nutrient inadequacy, while an excessively high EC can induce salinity stress and ion toxicity. Optimizing EC levels in the nutrient solution can help address several environmental challenges such as (a) Water conservation: Hydroponic systems, particularly in greenhouse cultivation, often require precise control over water usage. By optimizing EC levels, growers can ensure that plants receive adequate nutrients without excessive water consumption; thereby, conserving water resources. (b) Nutrient management: Maintaining the appropriate EC level in the nutrient solution is crucial for providing essential nutrients to plants while avoiding nutrient imbalances or deficiencies. This study provides valuable information on the relationship between EC levels and nutrient uptake, helping growers to optimize nutrient management practices. (c) Salinity stress mitigation: High salinity levels in soil or nutrient solutions can adversely affect plant growth and productivity. This study offers strategies to mitigate the negative effects of salinity on crop production by identifying the optimal EC range that promotes plant growth while minimizing salinity stress. (d) Environmental sustainability: Greenhouse cultivation offers opportunities for more sustainable agricultural practices, such as reduced pesticide use, minimized land and water usage, and improved resource efficiency. Optimizing EC levels contributes to the overall sustainability of greenhouse farming by enhancing crop productivity while minimizing environmental impacts. This research contributes valuable insights for improving strawberry cultivation in greenhouse by optimizing nutrient solution management, which can reduce salinity stress and nutrient imbalances. These findings have broader implications for enhancing resource efficiency and minimizing environmental impact in controlled agriculture, supporting sustainable practices that promote productivity and plant health.
The aim of this research was to elucidate how varying electrical conductivities (ECs) of the nutrient solution (NS) affect the growth and development of strawberries. Additionally, we sought to identify the optimal EC of the NS that would result in the highest growth and quality of hydroponically-grown Tochiotome strawberries.
Results
Plant growth, yield, and SPAD value
A significant decrease in crown and leaf fresh weights was observed as EC levels increased from 6.0 to 8.0 dS.m−1 (Table 2). This suggests that higher EC values negatively affect the plant's ability to accumulate fresh biomass in both the crown and leaves. The reduction in fresh weight could be attributed to osmotic stress and nutrient imbalances induced by elevated EC levels (Arif et al., 2020). As EC levels increased from 6.0 to 8.0 dS.m−1, there was a significant decrease in both crown and leaf fresh weights (Table 2). This decline suggests that higher EC values negatively impact the plant's ability to accumulate fresh biomass. Elevated EC levels are likely to induce osmotic stress and disrupt nutrient balance within the plant, impairing its growth and leading to reduced fresh weight (Farhangi et al. 2023). The reduction in crown and leaf fresh weights could be attributed to osmotic stress and nutrient imbalances induced by elevated EC levels (Atta et al., 2023a). There was no significant difference in leaf area among EC treatments (Table 2). There was not a clear trend in leaf number and leaf area across the different EC levels. This indicated that EC might not have a significant direct impact on these parameters within the range studied. Other factors such as genetic variability or environmental conditions may play a more dominant role in determining leaf number and area. The lack of significant differences in leaf area could suggest that salinity impacts might be less pronounced for these parameters and could be influenced by genetic variability or environmental conditions (Negrao et al., 2017; Gonzáles et al., 2021). Leaf dry weight follows a similar pattern to fresh weight, showing a decline with increasing EC levels from 6.0 to 8.0 dS.m−1 (Table 2). This suggests that the reduction in fresh weight was not solely due to changes in water content but also reflects a decrease in structural biomass accumulation. The decrease in dry weight could be attributed to impaired nutrient uptake and assimilation under high EC conditions (Guo et al., 2019). Root length displayed a consistent decrease as EC levels rise (Table 2). This indicated that higher EC values (8.0 dS.m−1) negatively impacted root development and elongation. Salinity disrupts root cell division and elongation by altering phytohormonal balances, particularly reducing auxin transport while increasing abscisic acid (ABA) levels, which restricts root elongation (Zou et al., 2022). The observed decline in root length suggests that plants may experience difficulties in nutrient acquisition and water uptake under conditions of elevated salinity, leading to compromised root growth (Lopez et al., 2023).
There was a significant decrease in individual fruit weight with increasing EC levels under 8.0 dS.m−1 (Table 3). This suggests that higher EC values negatively affect fruit development and size. The reduction in individual fruit weight could be attributed to decreased water uptake and impaired nutrient availability under high salinity conditions (Shahid et al., 2020). Moreover, excessive accumulation of Na⁺ and Cl⁻ ions disrupts nutrient homeostasis, particularly by reducing K⁺ and Ca²⁺ uptake, which are essential for maintaining cell turgor and enzymatic activities (Hussain et al., 2021). The highest value of individual fruit weight was found under 2.0 dS.m−1 (Table 3). The SPAD value was a measure of leaf chlorophyll content and indirectly reflects plant health and photosynthetic efficiency. Interestingly, there was no significant difference in SPAD values across the different EC levels (except for 8.0 dS.m−1) (Table 3). The lowest value of SPAD was found under 8.0 dS.m−1. Brix percentage is a measure of soluble solids content in fruit, often correlated with sweetness. In this study, there was no significant variation in Brix percentage among the different EC levels (Table 3). This implies that despite changes in fruit weight, the overall sweetness of the fruit remains relatively constant across the tested salinity levels. It suggests that salinity stress may not have a pronounced impact on fruit sugar accumulation. Yield showed a significant decrease as EC levels increase or decline (Table 3). This aligns with the observed reduction in individual fruit weight, indicating that nutrient deficiency or higher salinity negatively impacts overall fruit production (Denaxa et al., 2022). This reduction in fruit weight could be attributed to restricted water uptake, nutrient deficiencies, and hormonal imbalances caused by salinity stress (Arif et al., 2020). The decrease in yield could be attributed to a combination of factors, including reduced fruit size, decreased flowering, and impaired nutrient uptake, all of which contribute to diminished overall productivity (Burgess et al., 2023). Root dry weight displayed a significant decrease with increasing or decreasing EC levels (Table 3). This suggests that nutrient deficiency or higher salinity adversely affects root growth and development (Awad et al., 2021). The reduction in root dry weight indicates impaired root system functionality, which can further
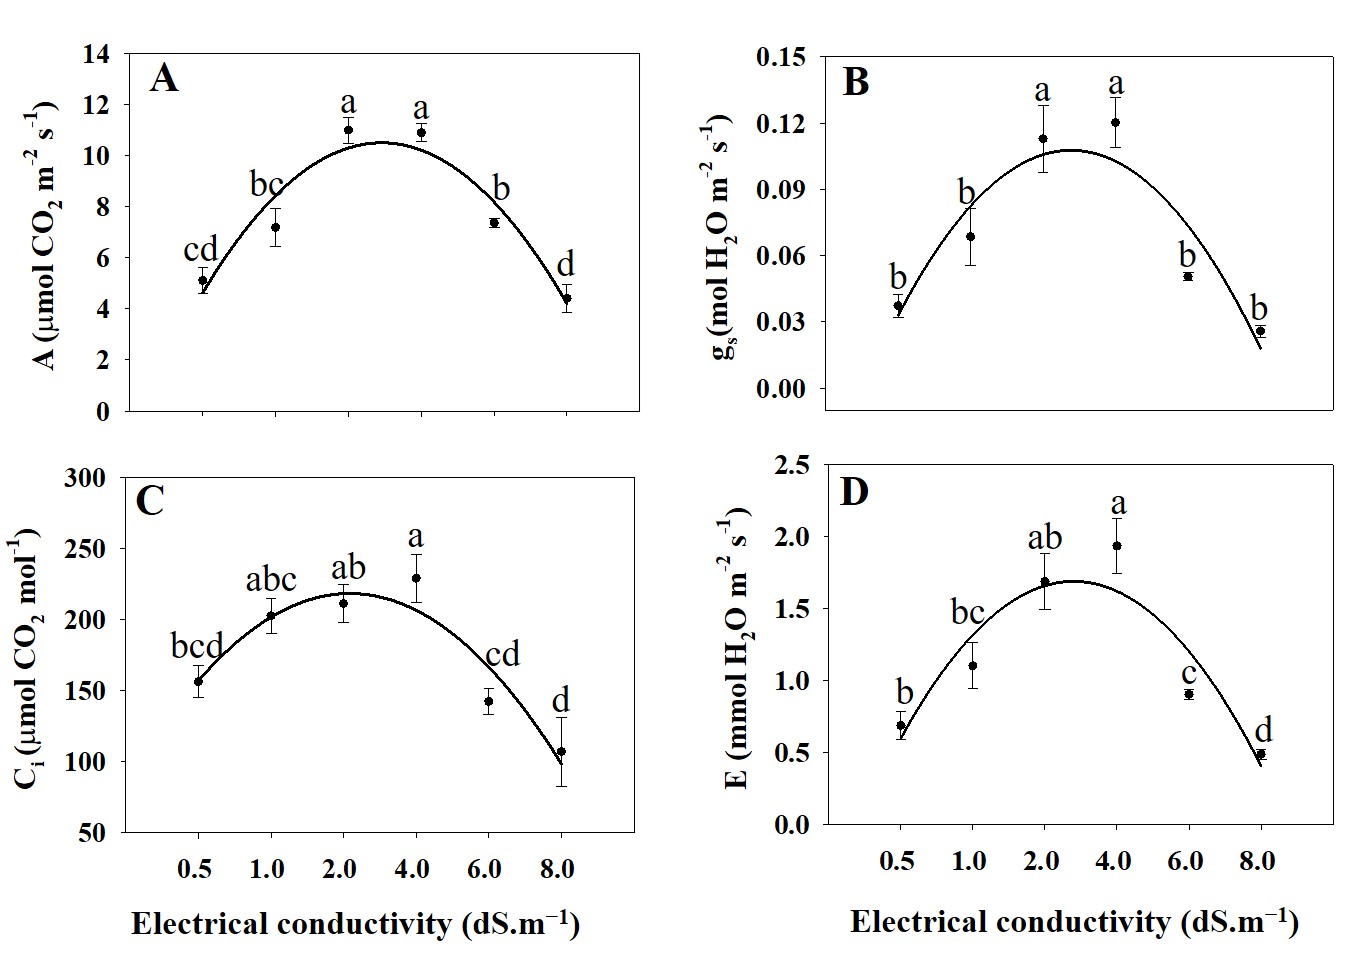
Fig. 1. Net photosynthetic rate (Pn; A), stomatal conductance (gs; B), intercellular CO2 concentration (Ci; C), and transpiration rate (Tr; D) of A. rugosa under different electrical conductivity treatments (0.5, 1.0, 2.0, 4.0, 6.0, and 8.0 dS.m−1). Each value indicates the mean ± standard error (SE) of four samples (n = 4). Different letters represent the significant differences at p ≤ 0.05, as assessed using the analysis of variance (ANOVA), followed by Tukey’s multiple range test.
exacerbate the negative effects of nutrient deficiency or salinity stress on overall plant health and productivity (Atta et al., 2023b).
Crown and leaf fresh weights were decreased significantly as EC levels increased from 6.0 to 8.0 dS.m−1, indicating a negative impact on biomass accumulation likely due to osmotic stress and nutrient imbalances. Leaf area remained unaffected by EC levels, suggesting that factors other than EC may influence this parameter. Root length consistently decreased with higher EC levels, indicating compromised root growth and potential difficulties in nutrient uptake. Individual fruit weight declined under elevated EC levels, potentially due to decreased water uptake and impaired nutrient availability. Despite variations in fruit weight, there were no significant differences in SPAD values (reflecting chlorophyll content) or Brix percentage (indicating fruit sweetness) across different EC levels. Overall yield decreased with increasing or decreasing EC levels, attributed to factors including reduced fruit size and impaired nutrient uptake.
Photosynthetic parameters
The net photosynthetic rate (Pn) showed a significant increase from 0.5 to 4.0 dS.m−1, reaching its peak at EC level 4.0, and then decreasing sharply at higher EC levels (6.0 and 8.0 dS.m−1) (Fig. 1). This suggests that moderate levels of salinity (up to 4.0 dS.m−1) might stimulate photosynthesis, possibly due to improved nutrient availability or osmotic adjustments. However, beyond this threshold, higher salinity appears to have a detrimental effect on photosynthetic efficiency, leading to a decline in Pn (Hnilickova et al., 2021). Stomatal conductance (gs) follows a trend similar to that of Pn, gradually increasing with rising EC levels up to 4.0 dS·m⁻¹, but declining at higher levels (6.0 and 8.0 dS·m⁻¹) (Fig. 1). This indicates that stomatal regulation responds positively to moderate salinity levels, facilitating gas exchange and CO2 uptake (Orzechowska et al., 2021). However, at higher salinity levels (6.0 and 8.0 dS.m−1),
stomatal conductance decreases, potentially due to stomatal closure as a response to osmotic stress or ion toxicity (Jalakas et al., 2021). Intercellular CO2 concentration (Ci) exhibits a significant increase with rising of EC levels up to 4.0 dS.m-1, and then higher salinity levels (6.0 and 8.0 dS.m−1) lead to reduced CO2 assimilation efficiency within the leaf (Fig. 1). The rise in Ci suggests a decrease in photosynthetic capacity and possibly impaired CO2 diffusion through stomata or alterations in biochemical processes associated with photosynthesis (Peng et al., 2021). Transpiration rate (Tr) showed a pattern similar to Pn and gs, increasing with EC levels up to 4.0 dS.m−1 and then decreasing at higher EC levels (6.0 and 8.0 dS.m−1) (Fig. 1). This suggests that moderate salinity levels may initially enhance water uptake and transpiration rates, possibly due to osmotic adjustments or increased stomatal opening (Arif et al., 2020). However, at higher salinity levels, transpiration rate decreases, likely due to stomatal closure and reduced water availability to the plant (Arif et al., 2020) (Fig. 1). Moderate salinity levels (up to 4.0 dS.m−1) initially improved photosynthetic efficiency and stomatal conductance, possibly due to enhanced nutrient availability or osmotic adjustments. However, higher salinity levels (6.0 and 8.0 dS.m−1) led to a decline in net photosynthetic rate, stomatal conductance, and transpiration rate, indicating reduced photosynthetic efficiency and impaired CO2 assimilation.
Materials and Methods
Experiment design
The study was conducted within the greenhouse facilities located in Dong Sang commune, Moc Chau district, Son La province, Vietnam. To shield against rainwater, we dropped plastic sheeting over the roof of the open greenhouse, measuring 6 meters by 40 meters, while leaving all four sides open to promote air circulation throughout the experiment. The
Table 1. Mineral Composition of A and B Hoagland Nutrient Solutions (g/L).
| Component | A Hoagland Solution (g/L) | B Hoagland Solution (g/L) |
|---|---|---|
| FeEDTA | 4.898 | - |
| Ca(NO₃)₂∙4H₂O | 191.880 | - |
| KNO₃ | 61.310 | 61.310 |
| H₃BO₃ | - | 0.603 |
| MnSO₄∙5H₂O | - | 0.435 |
| ZnSO₄∙7H₂O | - | 0.044 |
| CuSO₄∙5H₂O | - | 0.010 |
| Na₂MoO₄∙2H₂O | - | 0.004 |
| MgSO₄∙7H₂O | - | 100.610 |
| NH₄H₂PO₄ | - | 23.470 |
Table 2. Plant growth parameters of Tochiotome strawberry grown at different electrical conductivity (EC) treatments (0.5, 1.0, 2.0, 4.0, 6.0, and 8.0 dS.m−1).
| EC (dS.m-1) | Crown fresh weight (g) | Leaf number | Leaf area (cm2) | Leaf fresh weight (g) | Leaf dry weight (g) | Root length (cm) |
|---|---|---|---|---|---|---|
| 0.5 | 10.87 ± 0.189a | 16.50 ± 1.360ab | 28.16 ± 1.146ab | 26.298 ± 1.399a | 5.19 ± 0.335ab | 56.30 ± 1.447a |
| 1.0 | 10.97 ± 0.136a | 17.33 ± 1.382ab | 28.94 ± 2.228ab | 24.922 ± 1.161a | 5.43 ± 0.349a | 62.65 ± 2.640a |
| 2.0 | 10.45 ± 0.204a | 19.00 ± 1.238a | 30.38 ± 0.854a | 25.423 ± 1.388a | 5.56 ± 0.165a | 65.17 ± 3.553a |
| 4.0 | 10.58 ± 0.135a | 17.33 ± 1.429ab | 26.90 ± 1.069ab | 25.387 ± 0.979a | 5.94 ± 0.362a | 62.05 ± 1.593a |
| 6.0 | 9.48 + 0.108b | 15.50 ± 0.921ab | 28.22 ± 1.251ab | 17.478 ± 0.599b | 4.19 ± 0.196b | 58.68 ± 1.598a |
| 8.0 | 6.05 ± 0.263c | 13.00 ± 0.577b | 24.29 ± 0.511b | 13.00 ± 0.938b | 2.94 ± 0.182c | 45.02 ± 1.399b |
| Significance | *** | * | * | *** | *** | *** |
Data are the mean of six separate plants (n = 6). Different letters (a-c) indicate significant differences among treatments at the level of 5% according to Tukey’s test. NS: Not significant (p > 0.05), z significant at * p ≤ 0.05, ** p ≤ 0.01, and *** p ≤ 0.001.
Table 3. Individual fruit weight, SPAD value, Brix, yield, and root dry weight of Tochiotome strawberry grown at different electrical conductivity (EC) treatments (0.5, 1.0, 2.0, 4.0, 6.0, and 8.0 dS.m−1).
| EC (dS.m-1) | Individual fruit weight (g) | SPAD value | Brix (%) | Yield (g) | Root dry weight (g) |
|---|---|---|---|---|---|
| 0.5 | 8.37 ± 0.102b | 50.23 ± 0.622bc | 7.24 ± 0.115 | 165.52 ± 8.571b | 3.01 ± 0.291b |
| 1.0 | 8.83 ± 0.211b | 52.43 ± 0.731ab | 7.27 ± 0.096 | 188.92 ± 8.533b | 3.02 ± 0.234b |
| 2.0 | 9.08 ± 0.264 a | 53.98 ± 0.823a | 7.61 ± 0.149 | 211.43 ± 6.388a | 3.11 ± 0.448a |
| 4.0 | 8.78 ± 0.215b | 54.18 ± 0.718b | 7.61 ± 0.156 | 205.22 ± 5.669a | 3.31 ± 0.356a |
| 6.0 | 8.18 ± 0.157b | 52.93 ± 1.286ab | 7.53 ± 0.111 | 175.93 ± 4.137b | 3.09 ± 0.354b |
| 8.0 | 4.98 ± 0.240c | 48.40 ± 0.595c | 7.25 ± 0.124 | 167.46 ± 5.447b | 2.54 ±0.219b |
| Significance | *** | *** | NS | *** | * |
Data are the mean of six separate plants (n = 6). Different letters (a-c) indicate significant differences among treatments at the level of 5% according to Tukey’s test. NS: Not significant (p > 0.05), z significant at * p ≤ 0.05, ** p ≤ 0.01, and *** p ≤ 0.001.
average temperature during the experiment was 20.2 ± 5°C, with a relative humidity of 77.5 ± 10%.
We utilized strawberry stolon-propagated plantlets of the "Tochiotome" variety sourced from Japan for this experiment. Specifically, we selected stolon-propagated plantlets boasting 4–5 leaves and standing between 20–30 cm tall. These were carefully transplanted into plastic pots filled with a soil mixture comprising perlite, peat soil, and vermiculite in equal proportions by mass (1:1:1), ensuring a pH level of 6.0. Each pot, with dimensions of 18.5 cm in top diameter, 22 cm in height, and 12.5 cm in bottom diameter, featured a circular hole at the base for drainage. The stolon-propagated plantlets remained within these pots throughout the experiment. To regulate soil moisture, we regularly monitored and adjusted the water content in all pots, aiming to maintain it within the range of 75% to 85% of the maximum field water capacity.
The mineral salt composition of the A and B Hoagland nutrient solution is presented in Table 1. Starting from 8 days after transplanting (DAT), the plants were subjected to six different EC treatments: 0.5, 1.0, 2.0, 4.0, 6.0, and 8.0 dS.m-1 by irrigation every day. The EC levels were regulated using the Hoagland Nutrient Solution. To monitor and adjust the EC levels, a portable conductivity meter and pH tester combination (HI98129, Hanna Instruments, Woonsocket, USA) were employed. This instrument was utilized to measure both the EC and pH values of the nutrient solution.
Measurements of plant growth parameters
At the conclusion of the experimental period, the plants were gently removed from their pots along with the growth media.
The leaf fresh weight, and the crown and individual fresh weights was weight by a digital scale (ARG224 OHAUS, Sigma-Aldrich. Co. LLC, Seoul, Korea). Leaf number was counted. The root length was manually determined by a measuring tape. Subsequently, the shoot and root sections were thoroughly washed to remove any adhering soil particles. Following this, they were subjected to oven drying at 70°C for 48 hours. The dry weight of both the shoot and root sections was then determined and expressed in grams. Leaf chlorophyll content (SPAD value) was assessed using a SPAD-502 chlorophyll meter manufactured by Konica Minolta, Singapore. Three fully expanded leaves from each plant were selected for measurement, and the readings were averaged to determine the chlorophyll content. Three fully expanded leaves were selected from each plant for assessment. The total leaf area was determined using a leaf area meter manufactured by Delta T Devices Ltd., located in Burwell, Cambridge, England. The data were presented in square centimeters (cm²), and an average value was calculated and reported. The number of mature berries and their respective fresh weights from each harvest were aggregated to calculate the total yield.
Evaluation of photosynthetic characteristics
The photosynthetic traits, including the net photosynthetic rate (Pn; measured in μmol CO2 m−2 s−1), stomatal conductance (gs; measured in mol H2O m−2 s−1), intercellular CO2 concentration (Ci; measured in μmol CO2 mol−1), and transpiration rate (Tr; measured in mmol H2O m−2 s−1), were assessed utilizing a portable photosynthesis system (LICOR 6400; Licor, Inc., Nebraska, NE, USA). The leaf chamber was set up with a CO2 concentration of 400 μmol⋅mol−1, a photosynthetic photon flux density (PPFD) of 1000 μmol⋅m−2⋅s−1, leaf temperature maintained at 25 °C, and an airflow rate of 500 cm3⋅s−1 prior to measurements. The assessment of photosynthetic characteristics occurred between 9:00 AM and 12:00 PM, focusing on the third intact leaf from the apex of the plant. Data collection was automated, with four measurements conducted for each replication within each treatment (n = 4).
Measurements of brix
Total soluble solids (TSS), expressed in degrees Brix (°Brix), were measured using a refractometer and were analyzed on 10 fruits. Degrees Brix (%) was determined following the method of McDonald et al., 2013 (McDonald et al., 2013).
Statistical analysis
All plant growth and yield parameters, and Brix degree were recorded from six plants and six fruits (n = 6). The experiment was conducted with 2 replications. Photosynthetic parameters were recorded on four plants (n = 4) The data were analyzed using SPSS software (version 20.0; IBM Corp., Armonk, NY, USA). The experimental results were analyzed using one-way analysis of variance (ANOVA) followed by Tukey’s multiple range test. The mean values of the treatment groups were compared using Tukey’s test, at a significance level of p ≤ 0.05.
Conclusions
The study indicates that maintaining an electrical conductivity (EC) level between 2.0 to 4.0 dS·m−1 is optimal for promoting plant growth, fruit development, and enhancing photosynthesis in Tochiotome Strawberry plants. Within this range, moderate salinity levels stimulate photosynthesis and stomatal conductance, potentially due to improved nutrient availability or osmotic adjustments. However, deviating from this range (either too high or too low) can lead to salinity stress or nutrient deficiency, respectively. These findings underscore the importance of carefully managing EC levels in agricultural practices to optimize plant growth, yield, and photosynthetic performance in saline environments. Further research is warranted to elucidate the underlying mechanisms driving these responses and to develop effective strategies for mitigating the adverse effects of salinity stress on crop productivity.
Competing interests: The authors have no conflicts of interest.
Acknowledgements: This research was supported by Fruit and Vegetable Research Institute
Authors' contributions: N.Q.H.: Experimental design, experimental conducting, investigation, data collection and analysis, writing – original manuscript, and writing – review and editing. N.T.T.N.: Experimental conducting, investigation and preparation of the manuscript, and writing – review and editing. V.P.L.: Project administration, supervision, experimental design, data analysis, writing – original manuscript, and writing – review and editing.
References
Achour Y, Ouammi A, Zejli D (2021) Technological progresses in modern sustainable greenhouses cultivation as the path towards precision agriculture. Renew Sust Energ Rev 147. 10.1016/j.rser.2021.111251.
Arif Y, Singh P, Siddiqui H, Bajguz A, Hayat S (2020) Salinity induced physiological and biochemical changes in plants: An omic approach towards salt stress tolerance. Plant Physiol Bioch 156: 64-77. 10.1016/j.plaphy.2020.08.042.
Atta K, Mondal S, Gorai S, Singh AP, Kumari A, Ghosh T, Roy A, Hembram S, Gaikwad DJ, Mondal S, Bhattacharya S, Jha UC, Jespersen D (2023a) Impacts of salinity stress on crop plants: improving salt tolerance through genetic and molecular dissection. Frontiers in Plant Science 14. ARTN 1241736
10.3389/fpls.2023.1241736.
Atta K, Mondal S, Gorai S, Singh AP, Kumari A, Ghosh T, Roy A, Hembram S, Gaikwad DJ, Mondal S, Bhattacharya S, Jha UC, Jespersen D (2023b) Impacts of salinity stress on crop plants: improving salt tolerance through genetic and molecular dissection. Frontiers in Plant Science 14: 1241736. 10.3389/fpls.2023.1241736.
Awad A, Odat N, Abu-Romman S, Hasan M, Al-Tawaha AR (2021) Effect of salinity on germination and root growth of jordanian barley. J Ecol Eng 22: 41-50. 10.12911/22998993/128875.
Burgess AJ, Masclaux-Daubresse C, Strittmatter G, Weber APM, Taylor SH, Harbinson J, Yin XY, Long S, Paul MJ, Westhoff P, Loreto F, Ceriotti A, Saltenis VLR, Pribil M, Nacry P, Scharff LB, Jensen PE, Muller B, Cohan JP, Foulkes J, Rogowsky P, Debaeke P, Meyer C, Nelissen H, Inzé D, Lankhorst RK, Parry MAJ, Murchie EH, Baekelandt A (2023) Improving crop yield potential: Underlying biological processes and future prospects. Food and Energy Security 12: e435. 10.1002/fes3.435.
Cho YY, Cha MK, Ku YG, Kim HC, Bae JH (2018) Effect of different culture nutrient solution ec on carrot top growth and nutritional contents in a closed-type plant factory system. Hortic Sci Technol 36: 37-45. 10.12972/kjhst.20180005.
Denaxa NK, Nomikou A, Malamos N, Liveri E, Roussos PA, Papasotiropoulos V (2022) Salinity effect on plant growth parameters and fruit bioactive compounds of two strawberry cultivars, coupled with environmental conditions monitoring. Agronomy-Basel 12: 2279. 10.3390/agronomy12102279.
Ding XT, Jiang YP, Zhao H, Guo DD, He LZ, Liu FG, Zhou Q, Nandwani D, Hui DF, Yu JZ (2018) Electrical conductivity of nutrient solution influenced photosynthesis, quality, and antioxidant enzyme activity of pakchoi (Brassica campestris L. ssp Chinensis) in a hydroponic system. Plos One 13. 10.1371/journal.pone.0202090.
Fan Z, Hasing T, Johnson TS, Garner DM, Schwieterman ML, Barbey CR, Colquhoun TA, Sims CA, Resende MFR, Whitaker VM (2021a) Strawberry sweetness and consumer preference are enhanced by specific volatile compounds. Hortic Res 8. 10.1038/s41438-021-00664-2.
Fan Z, Hasing T, Johnson TS, Garner DM, Schwieterman ML, Barbey CR, Colquhoun TA, Sims CA, Resende MFR, Whitaker VM (2021b) Strawberry sweetness and consumer preference are enhanced by specific volatile compounds (vol 8, 66, 2021). Horticulture Research 8. ARTN 224
10.1038/s41438-021-00664-2.
Farhangi H, Mozafari V, Roosta HR, Shirani H, Farhangi M (2023) Optimizing growth conditions in vertical farming: enhancing lettuce and basil cultivation through the application of the Taguchi method. Scientific Reports 13. 10.1038/s41598-023-33855-z.
Gonzáles HHS, Peñuelas-Rubio O, Argentel-Martínez L, Ponce AL, Andrade MHH, Hasanuzzaman M, Aguilera JG, Teodoro PE (2021) Salinity effects on water potential and the normalized difference vegetation index in four species of a saline semi-arid ecosystem. Peerj 9: e12297. 10.7717/peerj.12297.
Guo JX, Jia YM, Chen HH, Zhang LJ, Yang JC, Zhang J, Hu XY, Ye X, Li Y, Zhou Y (2019) Growth, photosynthesis, and nutrient uptake in wheat are affected by differences in nitrogen levels and forms and potassium supply. Scientific Reports 9: 1248. 10.1038/s41598-018-37838-3.
Hernández-Martínez NR, Blanchard C, Wells D, Salazar-Gutiérrez MR (2023) Current state and future perspectives of commercial strawberry production: A review. Sci Hortic 312. 10.1016/j.scienta.2023.111893.
Hnilickova H, Kraus K, Vachova P, Hnilicka F (2021) Salinity stress affects photosynthesis, malondialdehyde formation, and proline content in Portulaca oleracea L. Plants-Basel 10: 845. 10.3390/plants10050845.
Hussain S, Hussain S, Ali B, Ren XL, Chen XL, Li QQ, Saqib M, Ahmad N (2021) Recent progress in understanding salinity tolerance in plants: Story of Na/K balance and beyond. Plant Physiol Bioch 160: 239-256. 10.1016/j.plaphy.2021.01.029.
Jalakas P, Takahashi Y, Waadt R, Schroeder JI, Merilo E (2021) Molecular mechanisms of stomatal closure in response to rising vapour pressure deficit. New Phytologist 232: 468-475. 10.1111/nph.17592.
Lopez G, Ahmadi SH, Amelung W, Athmann M, Ewert F, Gaiser T, Gocke MI, Kautz T, Postma J, Rachmilevitch S, Schaaf G, Schnepf A, Stoschus A, Watt M, Yu P, Seidel SJ (2023) Nutrient deficiency effects on root architecture and root-to-shoot ratio in arable crops. Front Plant Sci 13: 1067498. 10.3389/fpls.2022.1067498.
Lu N, Bernardo EL, Tippayadarapanich C, Takagaki M, Kagawa N, Yamori W (2017) Growth and accumulation of secondary metabolites in perilla as affected by photosynthetic photon flux density and electrical conductivity of the nutrient solution. Front Plant Sci 8: 708. 10.3389/fpls.2017.00708.
McDonald H, Arpaia ML, Caporaso F, Obenland D, Were L, Rakovski C, Prakash A (2013) Effect of gamma irradiation treatment at phytosanitary dose levels on the quality of 'Lane Late' navel oranges. Postharvest Biol Tec 86: 91-99. 10.1016/j.postharvbio.2013.06.018.
Negrao S, Schmöckel SM, Tester M (2017) Evaluating physiological responses of plants to salinity stress. Annals of Botany 119: 1-11. 10.1093/aob/mcw191.
Orzechowska A, Trtílek M, Tokarz KM, Szymanska R, Niewiadomska E, Rozpadek P, Wator K (2021) Thermal analysis of stomatal response under salinity and high light. Int J Mol Sci 22: 4663. 10.3390/ijms22094663.
Park SY, Oh SB, Kim SM, Cho YY, Oh MM (2016) Evaluating the effects of a newly developed nutrient solution on growth, antioxidants, and chicoric acid contents in Crepidiastrum denticulatum. Hortic Environ Biote 57: 478-486. 10.1007/s13580-016-1060-2.
Peng YK, Bloomfield KJ, Cernusak LA, Domingues TF, Colin Prentice I (2021) Global climate and nutrient controls of photosynthetic capacity. Commun Biol 4: 462. 10.1038/s42003-021-01985-7.
Shahid MA, Sarkhosh A, Khan N, Balal RM, Ali S, Rossi L, Gómez C, Mattson N, Nasim W, Garcia-Sanchez F (2020) Insights into the physiological and biochemical impacts of salt stress on plant growth and development. Agronomy-Basel 10: 938. 10.3390/agronomy10070938.
Zou YT, Zhang YX, Testerink C (2022) Root dynamic growth strategies in response to salinity. Plant Cell Environ 45: 695-704. 10.1111/pce.14205.